Latest Data from Euromonitor shows that while the United States remained Shein’s largest apparel sales market in 2025, the value of sales declined by 4.5%, affected by factors such as higher tariffs on Chinese products, the elimination of the “de minimis” rules, and young U.S. consumers’ growing concern about sustainability. Based on the value of sales, Shein’s market share in the U.S. also dropped from 1.8% in 2024 to 1.7% in 2025, the first time since 2021.
Shein’s business outlook in the U.S. is expected to remain challenging in 2026 due to ongoing high tariffs affecting imports from China, tighter regulations and enforcement on cross-border e-commerce shipping, and consumers’ increasing demand for sustainable apparel products and supply chain transparency.
Amid headwinds in the US, Shein is diversifying its sales markets in the rest of the world. For example, Shein achieved more apparel retail sales in key EU markets in 2025, including the UK (up 4.2%), France (up 26.7%), Germany (up 31%), Italy (up 19.7%), and Spain (up 26.6%). Likewise, Shein’s sales in Brazil increased by over 698% between 2021 and 2025, much higher than 131% in the US.
As of 2025, Shein’s total apparel sales in the UK, France, Germany, Italy, Spain, and Brazil (around 6.5 billion USD) already surpass the sales in the US (around 5.9 billion). It is likely that emerging markets like Brazil will become increasingly important to Shein’s future global expansion due to the price competitiveness of Shein’s products in local markets, the relatively relaxed regulatory environment, and the attractiveness of Shein’s commitment to investing in production there.
Additional reading: Inside the Chinese factories of fast-fashion giant Shein (by FRANCE 24 English | February 2026)
Textiles and apparel today are produced through a global supply chain. For clothing labeled as “Made in Vietnam,” it is likely that the textile raw materials, such as yarns, fabrics, and trims, are sourced from elsewhere.
According to the newly released 2025 OECD trade in value added estimation, as of 2022, a country’s apparel exports commonly contain value added created in another country due to the use of imported textile materials and other inputs. This is the case for exports from leading apparel exporting countries in Asia, such as Vietnam (44% foreign value added), ASEAN members (35% foreign value added), Cambodia (45% foreign value added), India (21% foreign value added), and Jordan (42% foreign value added). Other emerging apparel sourcing destinations in North, South, and Central America, as well as the EU, also used substantial imported inputs for their apparel exports, such as Mexico (27.3% foreign value added), Türkiye (23.9% foreign value added), and Egypt (19.7% foreign value added). [See detailed data here]
Notably, among the sixteen countries and regions examined, they mostly increased the use of non-domestic value added in textile and apparel exports between 2015 and 2022 (note: paired T-test result was statistically significant at the 99% confidence level). This suggests that co-production through regional or global supply chains, rather than 100% domestic production, has become a more prominent phenomenon in the textiles and apparel industry. [See detailed data here]
Furthermore, the value added from China appears to be increasing in the textile and apparel exports of many countries. Specifically, between 2015 and 2022, textile and apparel exports from several countries contained a higher percentage of value added from China, including not only Asian countries such as Vietnam (up 6 percentage points), ASEAN (up 4.1 percentage points) and Jordan (up 6.1 percentage points), but also those in other regions such as Egypt (up 3.3 percentage points), Mexico (up 1.7 percentage points), and South & Central America as a whole (up 4.7 percentage points). [See detailed data here] This result reflected China’s deliberate effort to expand its global economic presence through foreign direct investment, Belt and Road initiatives, and new trade agreements in recent years.
The latest data from the World Trade Organization (WTO) also shows that while China’s market share in the world clothing exports fell to 29.6% in 2024—the lowest level since 2010—China’s market share in textile exports increased to 43.3% in 2024, up from 41.5% a year earlier. In other words, consistent with the stage of development theory, China’s role as a major textile supplier to other apparel-exporting countries continues to grow, despite a decline in its finished garment exports. [See detailed data here]
In comparison, while the United States remained an important contributor to the value added of textile and apparel exports from Mexico and Canada, its contribution slightly declined between 2015 and 2022 (i.e., from about 12%-14% to 11%). As the USMCA undergoes its mandated six-year review, it is critical to strengthen, rather than weaken, this North American co-production supply chain, which has a significant impact on the economic interests of the U.S. textile and apparel industry. This is particularly important given that supply chain collaboration between the U.S. and Asian or EU countries for textile and apparel production has been limited, with little indication of growth: According to OECD data, the U.S. value added in Asian and EU countries’ textile and apparel exports remained only around 1.5% [See detailed data here].
by Sheng Lu
(This post is not open for discussion due to its technical nature)
First, as a result of the IEEPA reciprocal tariff, the average tariff rate for U.S. apparel imports (HS Chapters 61 and 62) reached 26.4% in July 2025, marking a new high in decades (note: was 25.4% in June, 23.8% in May and 20.2% in April 2025), and a substantial increase from 14.7% in January 2025, prior to Trump’s second term. Even apparel imports from traditional U.S. free trade agreement partners, such as CAFTA-DR members, now have to be subject to about 10% applied tariffs. And apparel imports from Mexico still enjoyed a relatively low 1.6% tariff rate in July 2025. [Check the applied US apparel import tariff rate here]
Second, U.S. apparel imports fell in July 2025, negatively impacted by the hiking of tariffs and consumers’ growing hesitancy in clothing spending amid uncertainty about their household financial outlook. Specifically, U.S. apparel imports in July 2025 decreased by 3.0% in value and 5.2% in quantity from a year ago, indicating both an overall shrinking import demand and a more notable import price increase. [Check U.S. apparel import index here]
Statistics also show that after removing the seasonal factor, the average U.S. apparel import price went up by nearly 3% from April to July. This trend could become even worse in the coming months as more countries face even higher “reciprocal tariffs” starting from August 2025. However, the average U.S. apparel retail price has not significantly increased, likely because fashion companies fear losing sales at a time when consumers’ clothing spending is already weak. [Check the U.S. clothing retail price index here]
Third, continuing the trends from previous months, U.S. apparel imports from China again fell sharply in July 2025. Facing nearly 50% tariff rates—much higher than those applied to other sourcing countries—U.S. apparel imports from China decreased by 38.4% in value and 27.3% in quantity in July 2025 from a year ago. As a result, in value, China’s market share fell to just 15.6% in July 2025 (was 24.6% in July 2024), significantly lower than Vietnam’s 22.1% (was 19.1% in June 2024). In other words, it may signal a new era where China is no longer the top source of U.S. apparel imports. [Check market shares in U.S. apparel imports here]
Fourth, while Asia as a whole still dominates, trade data suggests more notable trends of sourcing diversification. In July 2025, about 72.9% of U.S. apparel imports came from China, far exceeding the Western Hemisphere (14.8%) and the rest of the world (12.4%). However, Asia’s market share in July 2025 was slightly lower than 74.7% a year ago, suggesting that more imports came from other regions. For example, at the country level, US apparel imports from several emerging Asian suppliers and those in the Middle East and Africa enjoyed fast growth, including Vietnam (up 12.5%), Cambodia (up 25.2%), Pakistan (up 14.7%), Jordan (up 21.6%), and Egypt (up 30.3%).
Meanwhile, U.S. apparel imports from India in July 2025 also increased by over 15%, although the newly imposed higher tariffs on India could alter the trend in the next few months.
Additionally, there is still no evidence that Trump’s tariff policy has meaningfully boosted nearshoring from the Western Hemisphere. On the contrary, in July 2025, U.S. apparel imports from Mexico grew by just 0.5%, despite the significant tariff advantage offered to USMCA-qualifying products. Similarly, imports from CAFTA-DR members decreased by 2.7%. The results revealed the adverse effects of uncertainty in the Trump administration’s tariff policy on encouraging long-term sourcing and investment commitment to the region.
#1 This year, the top business challenges facing U.S. fashion companies center on the Trump Administration’s escalating tariff policy and its wide-ranging impacts on companies’ sourcing and business operations.
100 percent of respondents rated “Protectionist U.S. trade policies and related policy uncertainty, including the impact of the Trump tariffs” as one of their top business challenges in 2025. This included as much as 95 percent of respondents who ranked the issue among their top two concerns.
Respondents also expressed significant concerns about the wide-ranging effects of Trump’s tariff policy, including “Inflation and economic outlook in the U.S. economy” (80 percent), “Increasing production or sourcing cost” (nearly 50 percent), and “Protectionist trade policies and policy uncertainty in foreign countries, including retaliatory measures against the U.S.” (52 percent).
#2 Maintaining a geographically diverse sourcing base has been one of the most popular strategies adopted by U.S. fashion companies to mitigate the impact of rising tariffs and policy uncertainty.
This year, respondents reported sourcing apparel products from 46 countries, similar to the 48 countries reported in 2024 and an increase from 44 countries in 2023. At the firm level, approximately 60 percent of large companies with 1,000+ employees reported sourcing from ten or more countries in 2025, a notable increase from the 45–55 percent range reported in 2022 and 2023 surveys.
Amid escalating tariffs and rising policy uncertainty, Asia has become an ever more dominant apparel sourcing base for U.S. fashion companies in 2025.Respondents reported increased use of several Asia-based sourcing destinations other than China in 2025 compared to the previous year, including Vietnam (up from 90 percent to 100 percent), Cambodia (up from 75 percent to 94 percent), Bangladesh (up from 86 percent to 88 percent), Indonesia (up from 75 percent to 77 percent), and Sri Lanka (up from 39 percent to 53 percent).As part of their sourcing diversification strategy, U.S. fashion companies are also gradually increasing sourcing from emerging destinations in the Western Hemisphere and beyond, such as Jordan, Peru, and Colombia.
Most respondents intend to build a more geographically diverse sourcing base and broaden their vendor network over the next two years. Nearly 60 percent of respondents plan to source apparel from more countries, and another 40 percent plan to source from more suppliers or vendors. Reducing sourcing risk, especially to minimize the impact of rising tariffs and tariff uncertainty, is a key driver of companies’ sourcing diversification strategies
#3 U.S. fashion companies remain deeply concerned about the future of the U.S.-China relationship during Trump’s second term and intend to further “reduce China exposure” to mitigate sourcing risks.
While 100 percent of respondents reported sourcing from China this year, a record-high 60 percent of respondents reported sourcing fewer than 10% of their apparel products from China, up from 40 percent in 2024. Approximately 70 percent of respondents no longer used China as their top apparel supplier in 2025, representing a further increase from 60 percent in 2024 and significantly higher than the 25-30 percent range prior to the pandemic.
Despite the announcement of the reaching of a U.S.-China “trade deal” in May 2025, more than 80 percent of respondents plan to further reduce their apparel sourcing from China over the next two years through 2027, hitting a new record high. Many large-scale U.S. fashion companies are already limiting or plan to limit their apparel sourcing from China to a “low single-digit” percentage by 2026 or earlier, mainly due to concerns about the increasing geopolitical and trade policy risks associated with sourcing from the country.
Still, respondents rated China ashighly economically competitive as an apparel sourcing basecompared to many of its Asian competitors regarding vertical manufacturing capability, low minimum order quantity (MOQ) requirements, flexibility and agility, sourcing costs, and speed to market. However, non-economic factors, particularly the perceived extremely high risks of facing U.S. import restrictions, geopolitical tensions with the U.S., and concerns about forced labor, are driving U.S. fashion companies to continue their de-risking efforts.
#4 No evidence indicates that the Trump Administration’s tariff policy has successfully encouraged U.S. fashion companies to increase domestic sourcing of “Made in the USA” textile and apparel products or to expand sourcing from the Western Hemisphere.
Only about 44 percent of respondents explicitly say that they would expand sourcing from the Western Hemisphere, and even fewer respondents (17 percent) plan to source more textiles and apparel “Made in the USA” amid the tariff increase.
This year, fewer respondents reported sourcing apparel from Mexico and Canada (down from 60 percent in 2024 to 50 percent in 2025) and members of the Dominican Republic-Central America Free Trade Agreement, CAFTA-DR (down from 75 percent in 2024 to 64 percent in 2025).
About half of the respondents plan to expand apparel sourcing from Mexico and CAFTA-DR members over the next two years. Notably, nearly all of these companies also intend to increase sourcing from Asia, indicating that U.S. fashion companies view near-shoring from the Western Hemisphere as a complement, not a replacement, to their broader sourcing diversification strategy.
#5 Respondents overall remain highly committed to sustainability, social responsibility, and compliance issues in the sourcing process.
This year, the top sustainability and compliance areas where respondents plan to allocate more resources include “Investing in technology to enhance supply chain traceability or isotopic testing” (53 percent), “Providing sustainability and social compliance training for internal employees” (50 percent) and “Providing sustainability and social compliance training for suppliers” (50 percent).
Moreover, most respondents (over 70 percent) plan to increase their use of various “sustainable fibers” in clothing over the next three years. This trend is especially strong for recycled materials, with 80 percent of respondents indicating they intend to increase their use.
The top three positions with the highest demand among respondents from 2025 through 2030 are “Environmental sustainability-related specialists or managers,” “Trade compliance specialists,” and “Data scientists”—more than 40 percent of respondents plan to increase hiring. There is also strong demand for “Textile raw material specialists” and “Sourcing specialists.”
#6 With the upcoming expiration of the trade preference program this September, respondents again underscore the importance of immediate renewal of the African Growth and Opportunity Act (AGOA) and extending the agreement for at least another ten years.
Due to the upcoming expiration of AGOA and uncertainty about its future, this year, respondents sourced from only six SSA and AGOA members (i.e., Kenya, Ethiopia, Ghana, Madagascar, Mauritius, and Tanzania), fewer than the seven countries in 2024. And none of these countries were used by more than 20 percent of respondents.
Nearly 80 percent of respondents support “renewing AGOA for at least another ten years,” and no one opposes. This shows a consistent and wide base of support for AGOA among U.S. fashion companies.
More than 70 percent of respondents say that securing a long-term renewal of AGOA for at least ten years is essential for expanding apparel sourcing from the region. Similarly, another 60 percent of respondents believe that a long-term renewal of AGOA is necessary for U.S. fashion companies and their supply chain partners to commit to new investments in the region.
Authored by Dr. Sheng Lu in collaboration with the United States Fashion Industry Association (USFIA), this year’s benchmarking study was based on a survey of executives from 25 leading U.S. fashion companies from April to June 2025. The study incorporated a balanced mix of respondents representing various businesses in the U.S. fashion industry. Approximately 85 percent of respondents were self-identified retailers, 60 percent were self-identified brands, and about 50 percent were importers/wholesalers.
The survey respondents included large U.S. fashion corporations and medium-sized companies. Around 90 percent of respondents reported having over 1,000 employees; the rest (10 percent) represented medium-sized companies with 100-999 employees.
First, the growth of U.S. apparel imports significantly slowed as fashion companies shifted from eagerly piling up stock to the wait-and-see mode. Specifically, in February 2025, U.S. apparel imports moderately went up 3.2% in value and 1.5% in quantity, much lower than the 18-19% increase seen in late 2024 and January 2025. The much-slowed growth confirmed that the earlier U.S. apparel import surge was largely driven by fashion companies’ worries about the upcoming tariff hikes rather than an actual increase in consumer demand.
Adding to the concern, U.S. consumer confidence fell sharply, which could lead to a steep drop in U.S. apparel imports ahead. For example, the Consumer Confidence Index dropped to a two-year low of 92.9 in March 2025, down from 100.1 the previous month (1985=100). Similarly, the Expectations Index—which measures consumers’ short-term outlook for income, business, and labor market conditions—plunged to 65.2, marking its lowest level in 12 years. With the announcement of reciprocal tariffs and the growing likelihood of an economic recession, U.S. consumer demand for clothing may decline significantly, potentially leading to the cancellation of many sourcing orders.
Second, apparel imports have become more expensive. Measured in dollars per square meters equivalent (SME), the unit price of U.S. apparel imports averaged $3.06/SME in the first two months of 2025, up from $3.03/SME a year ago (or a 1.3% increase). The unit price of U.S. apparel imports from many leading Asian countries rose at a notably higher rate, including China (up 2.9%), Vietnam (up 3.6%), and Bangladesh (up 2.6%), as well as those from Mexico (up 4.7%) and CAFTA-DR (up 0.6%). This result reflected the growing pressure of sourcing and production costs facing U.S. fashion companies and their suppliers, driven by rising labor costs and raw material prices among other factors. Indeed, if Trump’s reciprocal tariffs ultimately take effect, import prices could increase even more significantly.
Third, U.S. fashion companies’ sourcing diversification efforts appeared to slow amid rising uncertainty. In February 2025, Asian countries collectively accounted for 71.5% of the total value of U.S. apparel imports—unchanged from a year earlier. Similarly, in the first two months of 2025, the top five suppliers (China, Vietnam, Bangladesh, Cambodia, and India) made up 63.7% of total apparel imports by value, up from 59.7% during the same period in 2024. Even China’s market share remained largely stable at 18.4% in value and 32% in quantity, compared to a year ago.
These figures suggest that U.S. fashion companies somehow have become more hesitant to adjust their sourcing base in response to the universal tariffs imposed by the Trump administration, which target nearly all U.S. trading partners. As a result, U.S. fashion companies may find the sourcing diversification strategies no longer as effective as in the past in effectively mitigating their sourcing risks.
Meanwhile, data from the United Nations (UN Comtrade) show that Asian countries’ dependence on the U.S. market for apparel exports varied. In 2024, Vietnam, Sri Lanka, and ASEAN members exported about 40% of their apparel to the U.S., whereas the U.S. accounted for only about 20% of China’s and Bangladesh’s total apparel exports to the world. At the same time, the U.S. remained the single largest export market for Mexico and CAFTA-DR members, due to the integrated Western Hemisphere textile and apparel supply chain.
Fourth, no evidence shows that the current trading environment has benefited from near-shoring from the Western Hemisphere. On the contrary, measured in quantity, in February 2025, only 7.6% of U.S. apparel imports came from CAFTA-DR members, a notable drop from 9.6% a year ago. Similarly, Mexico accounted for 2.3% of U.S. apparel imports in February 2025, also lower than 2.4% a year earlier.
As a silver lining, the utilization rate of CAFTA-DR reached 81.1% in 2025 (January to February), much higher than 73.8% over the same period in 2024. About 75.3% of U.S. apparel imports from CAFTA-DR in 2025 (January to February) complied with the yarn-forward rules of origin compared to 67.4% a year ago. However, the use of “short-supply” remained low–only about 2.0% in 2025 so far.
Textile and apparel manufacturing in the U.S. has significantly decreased over the past decades due to factors such as automation, import competition, and the changing U.S. comparative advantages for related products. However, thanks to companies’ ongoing restructuring strategies and their strategic use of globalization, the U.S. textile and apparel manufacturing sector has stayed relatively stable in recent years. For example, the value of U.S. yarns and fabrics manufacturing (NAICS 313) totaled $24 billion in 2023 (the latest data available), up from $23.3 billion in 2018 (or up 2.8%). Over the same period, U.S. made-up textiles (NAICS 314) and apparel production (NAICS 315) moderately declined by only 1.8% and 1.6%.
More importantly, the U.S. textile and apparel manufacturing sector is evolving. Several important trends are worth watching:
First, “Made in the USA” increasingly focuses on textile products, particularly high-tech industrial textiles that are not intended for apparel manufacturing purposes. Specifically, textile products (NAICS 313+314) accounted for over 83% of the total output of the U.S. textile and apparel industry as of 2023, much higher than only 56% in 1998 (U.S. Census, 2025). Textiles and apparel “Made in the USA” are growing particularly fast in some product categories that are high-tech driven, such as medical textiles, protective clothing, specialty and industrial fabrics, and non-woven. These products are also becoming the new growth engine of U.S. textile exports. Notably, between 2019 and 2022, the value of U.S. “nonwoven fabric” (NAICS 31323) production increased by 12.32%, much higher than the 1.15% average growth of the textile industry (NAICS 313). Similarly, while U.S. textile exports decreased by 13.75% between 2019 and 2024, “nonwoven fabric” exports surged by 10.48%--including nearly 40% that went to market outside the Western Hemisphere (U.S. International Trade Commission, 2025).
Second, U.S. apparel manufacturers today are primarily micro-factories, and they supplement but are not in a position to replace imports. As of 2021 (the latest data available), over 76% of U.S.-based apparel mills (NAICS 315) had fewer than 10 employees, while only 0.7% had more than 500 employees. In comparison, contracted garment factories of U.S. fashion companies in Asia, particularly in developing countries like Bangladesh, typically employ over 1,000 or even 5,000 workers.
Instead of making garments in large volumes, most U.S.-based apparel factories are used to produce samples or prototypes for brands and retailers. In other words, replacing global sourcing with domestic production is not a realistic option for U.S. fashion brands and retailers in the 21st-century global economy. Nor are U.S. fashion companies showing interest in shifting their business strategies from focusing on “designing + managing supply chain+ marketing” back to manufacturing.
Meanwhile, due to mergers and acquisitions (M&A) and to leverage economies of scale, approximately 5% of U.S. textile mills (NAICS313) had more than 500 employees as of 2021–this is a significant number, considering that textile manufacturing is a highly capital-intensive process.
Third, employment in the U.S. textile and apparel manufacturing sector continued to decline, with improved productivity and technology being critical drivers. As of 2024, employment in the U.S. textile and apparel manufacturing sector (NAICS 313, 314, and 315) totaled 270,700, a decrease of 18.4% from 33,190 in 2019. Notably, U.S. textile and apparel workers had become more productive overall—the labor productivity index of U.S. textile mills (NAICS 313) increased from 89.7 in 2019 to 94.4 in 2023, and the index of U.S. apparel mills (NAICS 315) increased from 105.8 to 110.78 over the same period.
On the other hand, clothing retailers (NAICS 4481) accounted for over 75.7% of employment in the U.S. textile and apparel sector in 2024.
Fourth, international trade, BOTH import and export, supports textiles and apparel “Made in the USA.” On the one hand, U.S. textile and apparel exports exceeded $12.5 billion in 2024, accounting for more than 30% of domestic production as of 2023 (NAICS 313, 314 and 315). Thanks to regional free trade agreements, particularly the U.S.-Mexico-Canada Agreement (USMCA) and the Dominican Republic-Central America Free Trade Agreement (CAFTA-DR), the Western Hemisphere stably accounted for over 70% of U.S. textile and apparel exports over the past decades. However, for specific products such as industrial textiles, markets in the rest of the world, especially Asia and Europe, also become increasingly important. Thus, lowering trade barriers for U.S. products in strategically significant export markets serves the interest of the U.S. textile and apparel industry.
On the other hand, imports support textiles and apparel “Made in the USA” as well. A 2023 study found that among the manufacturers in the “Made in the USA” database managed by the U.S. Department of Commerce Office of Textile and Apparel, nearly 20% of apparel and fabric mills explicitly say they utilized imported components. Partially, smaller U.S. textile and apparel manufacturers appear to be more likely to use imported components–whereas 20% of manufacturers with less than 50 employees used imported input, only 10.2% of those with 50-499 employees and 7.7% with 500 or more employees did so. The results indicate the necessity of supporting small and medium-sized (SME) U.S. textile and apparel manufacturers to more easily access their needed textile materials by lowering trade barriers like tariffs.
The full article is published in Just-Style and below is the summary:
India’s Textiles and Apparel Production
Data from the United Nations Industrial Development Organization (UNIDO) shows that India produced around $76.5 billion in textiles and $26.64 billion in wearing apparel in 2022. Although still smaller than China’s, this production scale has already surpassed that of most other Asian countries, including Vietnam. Behind these numbers were India’s over 4,000 ginning factories, 3,500 textile mills, and around 45 million workers directly employed by the textile and apparel sector.
India is one of the world’s largest textile fiber producers, including regular cotton, organic cotton, silk, polyester, and viscose. India also has more advanced local textile manufacturing capabilities than most other developing apparel-exporting Asian countries, allowing it to benefit from a vertically integrated local textile and apparel supply chain. A recent U.S. International Trade Commission (USITC) study noted that more than 90 percent of India’s textile raw materials needed for its apparel production can be sourced domestically. In comparison, as the World Trade Organization (WTO) global value chain analysis estimated, more than 64 percent of Vietnam’s apparel exports in 2022 contained foreign-made content (i.e., imported yarns and fabrics), 57 percent for Cambodia, 49 percent for Indonesia, and 33 percent for Bangladesh.
India’s Apparel Export
India remained a much smaller apparel exporter than China, Vietnam, and Bangladesh. According to the World Trade Organization (WTO), India exported about $15 billion in apparel in 2023, ranked the world’s sixth largestor 2.8 percent of the global total. Similarly, in 2023, India accounted for 5.5 percent of U.S. apparel imports and 3.5 percent of the EU, showing its position as a significant supplier but not among the largest. However, unlike most other developing Asian countries, India exports less than half of its apparel output due to its massive domestic market with a population of 1.43 billion. This implies that India’s substantial untapped apparel export potential should not be ignored.
Why Sourcing from India?
Firstly, aligned with trade statistics, many U.S. fashion companies already source from India, although in a relatively small volume. For example, the USFIA benchmarking survey respondents consistently ranked India as the 3rd or 4th most utilized apparel sourcing base from 2021 to 2024, after China and Vietnam. However, U.S. fashion companies typically place less than 10 percent of their total sourcing value or volume in India. The recent USITC study also raised concerns that India’s apparel factories were primarily small and medium-sized, which could limit their ability to fulfill large-volume sourcing orders.
Secondly, “Made in India” clothing is not necessarily cheap but could be perceived as “worth the value.” Notably, from January to October 2024, clothing labeled “Made in India” sold in the U.S. retail market was, on average, priced much higher than imports from Bangladesh and Vietnam, particularly in the mass market segment. Meanwhile, in the premium market segment, clothing “Made in India” was, on average, priced relatively lower than “Made in China,” such as dresses, tops, and bottoms. These results suggest that U.S. fashion companies do not typically consider India a preferred sourcing base for basic and price-sensitive items. Instead, India may be seen as a more cost-effective alternative to China for high-quality, value-added clothing.
Thirdly, India has been strengthening its competitiveness in export flexibility and agility, enabling its vendors to quickly adjust the delivery, volume, and product of the sourcing order upon customers’ requests. In the latest 2024 USFIA survey, respondents rated India’s sourcing flexibility and agility second only to China, surpassing Bangladesh, Cambodia, and Central American countries. Likewise, India was regarded as one of the few Asian countries that could fulfill apparel sourcing orders with relatively low “minimum order quantity (MOQ)” requirements.
One major factor contributing to India’s perceived advantages in sourcing flexibility and agility is its ability to produce a wide range of apparel products. For example, the Herfindahl-Hirschman Index (HHI) calculated using trade data at the 6-digit HS code level indicates that U.S. apparel imports from India cover more diverse product categories than most Asian countries.
Moreover, due to India’s position as one of the world’s leading cotton producers, in the first ten months of 2024, nearly 60 percent of U.S. apparel imports from India contained cotton fibers, including 13 percent using organic cotton. This percentage was much higher than imports from other Asian suppliers such as China and Vietnam. In comparison, over the same period, U.S. apparel imports from India appear less likely to contain man-made fibers like polyester, nylon, spandex, and recycled polyester. This fiber composition explains why India has yet to become a leading supplier of certain apparel product categories, like outerwear, which more commonly uses man-made fiber than cotton.
Additionally, in the first ten months of 2024, over 45 percent of India’s apparel newly introduced to the U.S. market targeted the luxury and premium segment, closely matching China’s nearly 50 percent and exceeding other Asian suppliers such as Vietnam (20 percent), Bangladesh (13 percent), Cambodia (5 percent), and Indonesia (18 percent). This result explains why U.S. fashion companies increasingly consider India a strategic alternative to sourcing from China, given the similarities in their product offerings.
Reflections
India’s large country size and population, the presence of an already highly integrated and sophisticated textile and apparel supply chain, and its ability to make a great variety of high-quality products suitable for various market segments position it well in the export competition. U.S. fashion companies’ eagerness to reduce sourcing from China due to rising geopolitical concerns and the limited sourcing capacity elsewhere created historical opportunities for India to expand its apparel exports to the U.S. market further.
Nevertheless, it remains a question mark whether India is fully committed to expanding labor-intensive apparel production and exports, given the country’s economy is moving toward more capital and technology-intensive sectors. Notably, in value, apparel only accounted for about 5.6 percent of India’s total merchandise exports in 2023, similar to China’s 5.3 percent but much lower than other lesser-developed Asian countries, including Vietnam (10 percent), Bangladesh (88 percent), and Cambodia (44 percent).
Moreover, while India is not a primary focus for compliance issues like forced labor, sourcing from the country still carries general social and environmental compliance risks similar to those in most developing countries (note: see the 2024 USITC report). It remains to be seen whether India’s textile and apparel mills are technically and financially prepared to meet more stringent social and environmental standards being adopted in the U.S. and can effectively compete in the growing market for “sustainable apparel.”
by Gabriella Giolli (Honors Marketing major & Fashion management minor, University of Delaware) and Sheng Lu
Note: The revealed comparative advantage (RCA) index measures a country’s relative export performance of a particular product compared to the world average. It helps identify sectors in which a country holds a competitive edge in international trade. RCA =(Country’s exports of product X/Country’s total exports)/(World exports of product X/World total exports).
RCA > 1: A value greater than 1 indicates that the country has a revealed comparative advantage in the product, meaning the product has a higher export share in the country’s portfolio compared to the global average. This suggests the country is more competitive in exporting that product relative to the rest of the world.
RCA < 1: A value less than 1 means the country has a revealed comparative disadvantage in that product. It indicates that the country is less competitive in exporting that product compared to the global average.
Observe the sectors in which the U.S. enjoyed a revealed comparative advantage (i.e., RCA > 1) in 2023. How does this compare with Bangladesh? What is your explanation for the observed differences?
Firstly, while China remained the world’s largest clothing exporter in 2023, rising geopolitical tensions and Western fashion companies’ ongoing de-risking efforts pose increasing challenges to its export outlook.
To some extent, 2023 wasn’t too bad for clothing “Made in China.” In value, China’s clothing exports totaled $164 billion, accounting for 31.6% of the world—unchanged from 2022. While China’s clothing exports decreased by 9.7 percent in 2023 compared to the previous year due to weaker market demand, this performance was better than most other top ten suppliers, including Bangladesh (down 16 percent), Vietnam (down 12 percent), India (down 13 percent), and Indonesia (down 17 percent).
However, China’s clothing exporters face significant challenges ahead. Despite maintaining its overall market share, China is losing momentum in nearly all key Western clothing markets, including the United States, the European Union, the UK, and Canada. This trend is primarily driven by perceived heightened sourcing risks associated with China, ranging from concerns over forced labor in the Xinjiang region to escalating geopolitical tensions involving the country.
For example, according to the 2024 Fashion Industry Benchmarking Study released by the US Fashion Industry Association (USFIA) in July, a record 43 percent of surveyed leading US fashion companies reported sourcing less than 10 percent of their apparel products from China in 2024, compared to only 18 percent in 2018. Likewise, nearly 60 percent of respondents no longer use China as their top apparel supplier in 2024, much higher than the 25-30 percent range before the pandemic. Additionally, nearly 80 percent of respondents plan to further reduce their apparel sourcing from China over the next two years through 2026, citing perceived high sourcing risks as the primary concern.
Secondly, China has been diversifying its clothing exports beyond traditional Western markets in response to the “de-risking” movement. For example, the US, EU, UK, and Canada combined accounted for 43-45 percent of China’s clothing exports in 2023, lower than over 50 percent in the past. In comparison, these four Western markets typically accounted for 70 to 90 percent of an Asian country’s clothing exports. Meanwhile, since 2021, Asian economies, especially members of the Regional Comprehensive Economic Partnership (RCEP) and Africa, have become more important export markets for China. Nevertheless, since RCEP members and those in Africa primarily consist of developing economies with ambitions to expand their own clothing production and exports, the long-term growth prospects for their demand for “Made in China” clothing remain uncertain.
Thirdly, China’s weakened economy could lead to an increased supply of low-cost Chinese clothing in the global market.
Despite being known as the world’s largest clothing exporter, between 2013 and 2022 (the latest available data), over 70%–80% of clothing produced in China was consumed domestically,with only about 20%–30% being exported. However, as China’s economic growth has slowed and consumer spending on clothing has stalled, more clothing made in China could enter the international market and intensify the price competition. Notably, between June 2023 and June 2024, the average unit price of US apparel imports from China decreased unusually by 7.6 percent, signaling that an increased supply of Chinese clothing began to suppress market prices. Likewise, it doesn’t seem reasonable that the unit price of U.S. apparel imports from China was 40% lower than that of imports from Bangladesh in the first half of 2024. Thus, the growing influx of cheap Chinese products raises the risk of market disruptions, potentially leading to additional trade tensions and restrictive measures against Chinese products.
Fourthly, there is an early sign that Asian countries have become more cautious about using Chinese yarns and fabrics. China remained a key supplier of textile raw materials to leading apparel-exporting countries in Asia. However, Asian countries appeared to be sourcing fewer yarns and fabrics from China in 2023, possibly due to the enforcement of anti-forced labor laws, such as the Uyghur Forced Labor Prevention Act (UFLPA), and the perceived risks associated with sourcing Chinese cotton. Instead, more Asian countries’ yarns and fabrics now came from regional suppliers other than China.
The latest US apparel import data raises several puzzles that deserve to be investigated further.
Question 1: Why did imports suddenly surge, and is this surge sustainable?
Unexpectedly, US apparel imports experienced a significant surge in February 2024. This surge was marked by a 12.9% increase in quantity and a 2.9% increase in value compared to the previous year. Seasonally adjusted US apparel imports in February 2024 were also nearly 10% higher than in January 2024. The import surge was particularly surprising given that the value of US clothing sales in February 2024 was only 1.3% higher than a year ago and even 0.5% lower than in January 2024 (seasonally adjusted).
Therefore, it will be important to watch whether the US apparel trade has indeed reached a turning point and will continue growing in the coming months and throughout the year.
Question 2: Could the volume of US apparel imports in 2023 have been underreported?
With over 98% of clothing sold in the US retail market being imported today, there exists a strong correlation between US apparel retail sales (NAICS code 4481) and the volume of apparel imports. Between 2015 and 2022, the US clothing sales to clothing import ratio remained consistently around 3.0-3.2 (seasonally adjusted). In other words, the value of retail sales was approximately three times the value of apparel imports. However, in 2023, this ratio increased to 4.0-4.5.
One suspicion is that as more apparel imports came into the US through the de minimis, the official US apparel import data in 2023 was somewhat underreported. Notably, according to Euromonitor, about 40% of US apparel retail sales were achieved through e-commerce in 2023, a substantial increase from 9.4% in 2010. Likewise, with US customs tightening controls on “small package shipments” and enhancing UFLPA enforcement, more imports likely began entering through the standard procedure in recent months, which explains why the US apparel sales to import rato fell back to 3.8 in February 2024.
On the other hand, some say the lowered US apparel import volume in 2023 was due to retailers’ efforts to control inventory levels. Data shows that US clothing stores’ stock-to-sales ratio in the last quarter of 2023 averaged 2.34, slightly lower than 2.43 from 2015 to 2019, but was higher than 2.19 back in 2021. In other words, while there was some effort by retailers to control inventory (as seen by the ratio being lower than pre-pandemic levels), it wasn’t a significant enough change to have a large impact on import demand. Also, considering that apparel is a seasonal product, it doesn’t seem too likely that retailers would risk losing sales opportunities during the most critical selling season of the year (i.e., 4th quarter) by promoting outdated items instead of stocking new ones on the shelf.
Question 3: Why did Asian countries export more apparel to Mexico?
As a developing country, Mexico is not traditionally a leading apparel import market due to consumers’ limited purchasing power and the sufficient local apparel supply. Take China, Vietnam, Bangladesh, and Cambodia, the four top Asian apparel exporting countries (Asia4), for instance. Between 2018 and 2020, Mexico typically accounted for 0.4%-0.7% of Asia4’s total apparel exports. However, since 2022, Asia4 has almost doubled its apparel exports to Mexico (i.e., increased to 1.5%-2.0%). Moreover, during the same period, the percentage of Asia4’s apparel exports to the United States declined from 27% to below 20%, especially in the last quarter of 2023.
What’s behind the increase in Asian countries’ apparel exports to Mexico needs to be investigated further. As noted earlier, Mexico itself is a leading apparel-producing country. Also, according to Euromonitor, the clothing market in Mexico stayed relatively stable at around 7.6%-7.9% of the size of the US from 2017 to 2023 (in quantity). In other words, Mexico’s increased import demand for Asian clothing doesn’t make much sense.
Others suspect some Asian apparel exports to Mexico eventually entered the US market either by taking advantage of the de minimis rule or the US-Mexico-Canda (USMCA) trade agreement. However, the exact size of this particular trade flow calls for further investigation.
First, affected by the macro economy, US apparel import volume in 2023 suffered the most significant decline since the pandemic. Specifically, US apparel imports decreased by 22% in quantity and value in 2023 compared to 2022, with none of the top ten suppliers experiencing positive growth.
Nevertheless, after several months of straight decline, US apparel imports finally bounced back in December 2023. Thanks to the holiday season and a gradual improvement of the US economy, seasonally adjusted US apparel imports in December 2023 were about 4.5% higher in quantity and 4.2% higher in value than the previous month. Highly consistent with trends, the US Consumer Confidence Index (CCI) increased from 67.2 in November to 76.4 in December (January 2019=100), suggesting US households turned more confident about their financial outlook and willing to spend. That being said, the latest January 2024 International Monetary Fund (IMF) forecasts still predicted the US GDP growth would slow down from 2.5% in 2023 to 2.1% in 2024. Thus, whether the US apparel import volume could continue to maintain growth after the holiday season remains a big question mark.
Second, while the pace of sourcing cost increases has slowed, the costs and financial pressure facing US fashion companies are far from over. Specifically, as of December 2023, the price index of US apparel imports stood at 106 (January 2019=100), almost no change from January 2023. However, two emerging trends are worth watching. One is the declining US apparel retail price index since August 2023, which means US fashion companies may have to sacrifice their profits to attract consumers to the store. The second trend is the surging shipping costs as a result of the recent Red Sea shipping crisis, which were not reflected in the December price data. According to J.P. Morgan, during the week of January 25, 2024, the container shipping rates from China to the US West Coast and East Coast saw a significant spike of around 140% and 120% from November 2023, respectively. Even worse, there is no sign that the Red Sea crisis will soon be solved. Therefore, 2024 could pose another year of financial challenges for many US fashion companies.
Third, diversification remained a pivotal trend in US fashion companies’ sourcing strategy in 2023. For example, the Herfindahl–Hirschman index (HHI), a commonly used measurement of market concentration, went down from 0.105 in 2022 to 0.101 in 2022, suggesting that US apparel imports came from even more diverse sources.
Notably, measured in value, only 71.6% of US apparel imports came from Asia in 2023, the lowest in five years. Highly consistent with the US Fashion Industry Association’s Benchmarking Survey results, OTEXA’s data reflected companies’ intention to diversify their sourcing away from Asia due to increasing geopolitical concerns, particularly the rising US-China strategic competition.
However, it should be noted that Asia’s reduced market share did not benefit “near-shoring” from the Western hemisphere much. For example, in 2023, approximately 14.6% of US apparel imports originated from USMCA and CAFTA-DR members, nearly the same as the 14.3% recorded in 2022. Instead, US apparel imports outside Asia and the Western Hemisphere jumped to 11.4% in 2023 from 9.8% a year ago. Some emerging EU and African suppliers, such as Turkey, Romania, Morocco, and Tunisia, performed relatively well in the US market in 2023, although their market shares remained small. We could highly expect the sourcing diversification strategy to continue in 2024 as many companies regard the strategy as the most effective to mitigate various market uncertainties and sourcing risks.
Fourth, US fashion companies continued reducing their China exposure as much as possible, but China will remain a key player in the game. On the one hand, about 20.0% of US apparel imports in value and 25.9% in quantity came from China in 2023, both hit a new low in the past decade. Recent studies also show that it became increasingly common for China to no longer be the largest source of apparel imports for many US fashion companies.
However, China remains highly competitive in terms of the variety of products it offers. For example, the export product diversification index, calculated based on trade data at the 6-digit HTS code level (Chapters 61 and 62), shows that few other countries can match China’s product variety. Likewise, product level data collected from industry sources indicates that China offered far more clothing styles (measured in Stock Keeping Units, SKUs) than its competitors in 2023. According to the results, rather than identifying 1-2 specific “next China,” US fashion companies appeared to leverage “category killers”—for example, utilizing Vietnam as a sourcing base for outerwear, underwear, and swimwear; India for dresses, and Bangladesh for large-volume basic knitwear items.
Related to this, another recent study found that the top five largest Asian suppliers next to China, including Vietnam, Bangladesh, Indonesia, India, and Cambodia, collectively can offer diverse product categories almost comparable to those from China in the US market.
Fifth, trade data reveals early signs that US fashion companies are gradually reducing sourcing cotton apparel products from Asia because of the implementation of the Uyghur Forced Labor Prevention Act (UFLPA). Notably, when concerns about cotton made by Xinjiang forced labor initially emerged in 2018, US fashion companies quickly shifted sourcing orders for cotton apparel (OTEXA code 31) from China to other Asian countries. However, UFLPA’s enforcement increasingly targets imports from Asian countries other than China due to the highly integrated regional textile and apparel supply chain and Asian countries’ heavy reliance on textile inputs from China. Consequently, Asia (excluding China) accounted for a declining share in the total imports of US cotton apparel in 2023.
Meanwhile, affected by UFLPA’s enforcement, only 11.8% of US cotton apparel imports came from China in 2023, marking a further decline from 13% in 2022 and reaching a new low for the past decade. China also deliberately decreased the percentage of cotton apparel in its total apparel exports to the US market, dropping from nearly 40% in 2017 to only 25% in 2023. In comparison, cotton apparel consistently represented about 45% of total US apparel imports during the same period.
Additionally, while there was no substantial increase in the volume of US apparel imports from CAFTA-DR members, as a silver lining, the utilization of the trade agreement improved. In 2023, about 19.2% of US apparel imports claimed duty-free benefits under US free trade agreements and trade preference programs, a notable increase from 17.7% in 2022. Most such imports came under CAFTA-DR (45.4%) and USMCA (19.7%).
Meanwhile, in the first 12 months of 2023 (latest OTEXA data), about 70.2% of US apparel imports came from CAFTA-DR members claimed the duty-free benefit, up from 66.6% the same period a year ago. Particularly, 65.4% of US apparel imports under CAFTA-DR complied with the yarn-forward rules of origin in 2023, a notable increase from 61.3% in 2022. Another 2.6% of imports utilized the agreement’s short supply mechanism, which also went up from 2.3% in 2022. The results could reflect an ever more integrated regional textile and apparel supply chain among CAFTA-DR members due to increasing investments made in the region in recent years. However, there is still much that needs to be done to effectively increase the volume of US apparel imports from the region.
First, while US apparel imports gradually recovered, the import demand remained weak overall. For example, US apparel imports in July 2023 increased by 0.9% in value and 2% in quantity from June (seasonally adjusted). However, the trade volume still experienced a decrease of approximately 17-18% compared to the previous year. Meanwhile, the US consumer confidence index fell again in August 2023, suggesting the economic uncertainties are far from over. Notably, so far in 2023 (January to July), US apparel imports decreased by 22.3% in value and 28% in quantity from the previous year, the worst performance since the pandemic.
As a silver lining, the price of US apparel imports has stabilized, although inflation remains an issue for the US economy.
Secondly, because of the seasonal pattern, Asian countries were able to capture relatively higher market shares since June. For example, measured in value, China, ASEAN, and Bangladesh accounted for over 64% of total US apparel imports in July 2023, a notable increase from 61% in June and 58% in May 2023.
Nevertheless, US fashion companies continue diversifying their sourcing base to mitigate various supply chain risks and rising geopolitical tensions. For example, the HHI Index for US apparel imports dropped to 0.097 in the first seven months of 2023, which is lower than the 0.106 recorded in the same period the previous year (January to July 2022), indicating a greater diversity in the sources of imports.
Third, despite an apparent rebound in exports to the US, China continued to experience a further decline in its market share. For instance, in July 2023, China’s market share was more than 3 percentage points lower in value (27.2% in July 2022 vs. 24.1% in July 2023) and 2.5 percentage points lower in quantity (43.1% in July 2022 vs. 40.6% in July 2023). This marked the worst performance since April 2023. In other words, consistent with recent industry surveys, US fashion companies continue to reduce their China exposure given the adverse business environment.
Fourth, the latest data suggests that US apparel imports from CAFTA-DR members remain stagnant, and some critical problems, such as the underutilization of the agreement, even worsened. For example, about 9.5% of US apparel imports in value and 8.5% in quantity came from CAFTA-DR members in July 2023, lower than 10.2% and 9.0% in the previous year (i.e., July 2022). In absolute terms, US apparel imports from CAFTA-DR in 2023 were about 20% lower than in 2022.
Additionally, CAFTA-DR’s utilization rate (i.e., the value of imports claiming the duty-free benefits under CAFTA-DR divided by the total value of imports from CAFTA-DR) fell from 70.2% in 2022 (Jan to July) to a new low of 69.2% in 2023 (Jan to July). Likewise, the value of imports utilizing CAFTA-DR’s short supply decreased by more than 20%. Thus, how to leverage CAFTA-DR to meaningfully encourage more US apparel imports from the region, particularly in light of US fashion companies’ eagerness to reduce their exposure to China, calls for sustained efforts and probably new strategies.
This article comprehensively reviewed the world textiles and clothing trade patterns in 2022 based on the newly released World Trade Organization Statistical Review 2023 and data from the United Nations (UNComtrade). Affected by the slowing world economy and fashion companies’ evolving sourcing strategies in response to the rising geopolitical tensions, mainly linked to China, the world’s textiles and clothing trade in 2022 displayed several notable patterns different from the past.
Pattern #1: The expansion of world clothing exports witnessed a notable deceleration in 2022, primarily attributed to the economic downturn. Meanwhile, the world’s textile exports decreased from the previous year, affected by the reduced demand for textile raw materials used to produce personal protective equipment (PPE) as the pandemic waned.
The world’sclothing exports totaled $576 billion in 2022, up 5 percent year over year, much slower than the remarkable 20 percent growth in 2021. The slowed economic growth plus the unprecedented high inflation in major apparel import markets, particularly the United States and Western European countries, adversely affected consumers’ available budget for discretionary expenditures, including clothing purchases.
The world’s textile exports fell by 4.2 percent in 2022, totaling $339 billion, lagging behind most industrial sectors. Such a pattern was understandable as the demand for PPE and related textile raw materials substantially decreased with the pandemic nearing its end.
Pattern #2: China continued to lose market share in clothing exports, which benefited other leading apparel exporters in Asia. Notably, for the first time, Bangladesh surpassed Vietnam and ranked as the world’s second-largest apparel exporter in 2022.
In value, China remained the world’s largest apparel exporter in 2022. However, China’s clothing exports experienced a growth of 3.6 percent, below the global average of 5.0 percent, positioning China at the bottom of the top ten exporters.
China’s global market share in clothing exports dropped to 31.7 percent in 2022, marking its lowest point since the pandemic and a significant decrease from the approximate 38 percent recorded from 2015 to 2018. In fact, China lost market share in almost all major clothing import markets, including the US, the EU, Canada, and Japan. The concerns about the risks of forced labor linked to sourcing from China and the deteriorating US-China relations were among the primary factors driving fashion companies’ eagerness to reduce their ‘China exposure” further.
China has been diversifying its clothing exports beyond the traditional Western markets in response to the challenging business environment. For example, from 2021 to 2022, Asian countries, especially members of the Regional Comprehensive Economic Partnership (RCEP), became relatively more important clothing export markets for China. Nevertheless, since RCEP members primarily consist of developing economies with ambitions to enhance their own clothing production, the long-term growth prospects for their import demand of ‘Made in China’ clothing remain uncertain.
Bangladesh achieved a new record high in its market share of world clothing exports, reaching 7.9 percent in 2022, which exceeded Vietnam’s 6.1 percent. Many fashion companies regard Bangladesh as a promising clothing-sourcing destination with growth potential because of its capability to make cotton garments as China’s alternatives, competitive price, and reduced social compliance risks.
Fashion companies’ efforts to “de-risking from China” also resulted in the robust growth of clothing exports from other large-scale Asian clothing producers in 2022, including Vietnam (up 13 percent), Cambodia (up 12 percent), and India (up 10 percent). In other words, despite the concerns about China, fashion companies still treat Asia as their primary sourcing destination.
Pattern #3: Developed countries stay critical textile exporters, and middle-income developing countries gradually build new textile production and export capability.
The European Union members and the United States stayed critical textile exporters, accounting for 25.1 percent of the world’s textile exports in 2022, up from 24.5 percent in 2021 and 23.2 percent in 2020. Thanks to the increasing demand from apparel producers in the Western Hemisphere, U.S. textile exports increased by 5 percent in 2022, the highest among the world’s top ten.
As a persistent long-term trend, middle-income developing countries have consistently been strengthening their textile production and export capability. For example, China, Vietnam, Turkey, and India’s market shares in the world’s textile exports have steadily risen. They collectively accounted for 56.8 percent of the world’s clothing exports in 2022, a notable increase from only 40 percent in 2010. Also, over time, these middle-income developing countries have achieved a more balanced textiles-to-clothing export ratio.
Pattern #4: Regional textile and apparel trade patterns strengthened further with the growing popularity of near-shoring, particularly in the Western Hemisphere. However, an early indication has emerged that Asian countries are diversifying their sources of textile raw materials away from China to mitigate growing risks.
The regional textile and apparel supply chains were in good shape in Asia and Europe. For example, nearly 80 percent of Asian countries’ textile input and apparel imports came from within the region in 2022. Likewise, approximately half of EU countries’ textile imports were intra-region trade in 2022, and one-third were for apparel.
The Western Hemisphere (WH) textile and apparel supply chain became more integrated in 2022 thanks to the booming near-shoring trends. For example, 20.8 percent of WH countries’ textile imports came from within the region in 2022, up from 20.1 percent in the previous year. Likewise, about 15.1 percent of WH countries’ apparel imports came from within the region in 2022, higher than 14.7 percent in 2021 and 13.9 percent in 2022.
Compared with Asia and the EU, SSA clothing producers used much fewer locally-made textiles (i.e., stagnant at around 11% from 2011 to 2022), reflecting the region’s lack of textile manufacturing capability. A more comprehensive examination of strategies for bolstering the textile manufacturing sector in Sub-Saharan Africa, particularly in light of the recently enacted African Continental Free Trade Area (AfCFTA) agreement, might be warranted.
Additionally, data suggests that Asian countries began diversifying their textile imports away from China to mitigate supply chain risks. For example, with the official implementation of anti-forced labor legislation in the US and other primary apparel import markets directly targeting cotton made in China’s Xinjiang region, Asian countries significantly reduced their cotton fabric imports (SITC code 652) from China in 2022. Instead, Asian countries other than China accounted for 46.3 percent of the region’s textile supply in 2022, up from around 42-43 percent between 2019 and 2021.
It is critical to watch how willing, to what extent, and how quickly Asian countries can effectively reduce their dependency on textile supplies from China. The result is also an important reminder that Western fashion companies’ de-risking from China could exert significant and broad impacts across the entire supply chain beyond finished goods.
The latest OTEXA trade data suggests several US apparel import patterns:
First, US apparel imports indicated a slow improvement in April 2023 but remained weak this year. For example, measured in quantity, US apparel imports fell by 33.9% in April 2023 from a year ago, but it was less significant than in March (i.e., down 40.2% YoY*). Likewise, measured in value, US apparel imports fell by 29.3% YoY in April 2023, which improved from a 32.7% YoY decline in March 2023. (*YoY: Year-over-year)
Overall, the shrinking US apparel import volume reflected the headwinds in the US economy and consumers’ hesitancy to purchase clothing amid financial uncertainties and high inflation. Recent economic indicators also present a mixed picture of the US economy’s growth trajectory. For example, while the US consumer confidence index slightly went up from 68.0 in March to 69.6 in April 2023 (January 2019=100), the advanced clothing store sales index in April fell to 115.6 (Jan 2019=100), the lowest so far in 2023 (e.g., was 120.6 in January 2023). However, since summer is traditionally a peak season for clothing sales, followed by events like back-to-school shopping, there remains hope that US apparel imports may experience a slight recovery at some point in the second half of the year.
Second, trade data suggested that US apparel imports came from more diverse sources. For example, the Herfindahl–Hirschman index (HHI) fell below 0.1 in the first four months of 2023. Likewise, the market shares of the five largest suppliers (CS5) fell below 60% for the first time since 2018. The result suggested that leveraging sourcing diversification is a prevalent strategy among US fashion companies to mitigate supply chain risks and address market uncertainties.
Third, US fashion companies are serious and eager to further reduce their “China exposure.” Although China remained the top apparel supplier to the US, its market share fell to a new low of 17.9% in value and 30.6% in quantity in the first four months of 2023. Notably, for the first time in decades, less than 10% of US cotton apparel imports came from China in March/April 2023, revealing the significant impact of the Uyghur Forced Labor Prevention Act (UFLPA) on US fashion companies’ China sourcing strategies.
Related, US fashion companies appear to be increasingly cautious about sourcing apparel from Vietnam as its supply chain is too exposed to China, raising concerns about forced labor risks. In value, Vietnam accounted for 17.3% of US apparel imports in the first four months of 2023, down from 18.6% a year ago. Notably, almost the same amount of Vietnam’s textile and apparel products were subject to the CBP’s UFLPA investigation as China in FY2023.
Fourth, large-scale Asian countries benefited the most as US fashion companies looking for China’s alternatives. Specifically, measured in value, about 70.6% of US apparel imports came from Asia in the first four months of 2023, down from 74.9% in 2022. However, the five largest apparel exporting countries in Asia other than China (i.e., Vietnam, Bangladesh, Indonesia, India, and Cambodia) accounted for 44.7% of US apparel imports in the first four months of 2023, a new high since 2018 (i.e., was 35.3%). These countries are among the most popular “alternatives to China” because of their balanced performance regarding production capacity, cost, flexibility, and compliance risks.
Fifth, US fashion companies are also actively exploring new near-shoring opportunities from the Western Hemisphere. For example, about 17.3% of US apparel imports came from Western Hemisphere countries in the first four months of 2023, up from 15.6% in 2023. That being said, measured in quantity, US apparel imports from Mexico and CAFTA-DR members fell by 13.0% and 21.2% in the first four months of 2023 from a year ago due to the struggling US economy. It will be interesting to see whether CAFTA-DR and Mexico can keep or enhance their market shares when the US import demand recovers.
Discussion questions (proposed by students in FASH455, spring 2023)
Based on the videos, does the flying geese concept still work today? Why?
Do you think Western fashion brands and retailers’ increasing emphasis on sustainability and social responsibility in apparel sourcing reduces Asian suppliers’ competitive disadvantage? Why or why not?
With Asian countries increasingly leveraging their labor advantages alongside advanced technologies, is the prospect of expanding nearshoring even less likely? What is your assessment?
What is your vision for the recycled clothing supply chain? Why or why not do you think Asian countries will continue to dominate?
On April 17, 2023, the US International Trade Commission (USITC) released a new report analyzing the trade and economic impact of the African Growth Opportunity Act (AGOA). The report fulfills the investigation request by the US House of Representatives Committee on Ways and Means in January 2022.
The full report is HERE. Below are the key findings regarding the apparel sector:
The African Growth and Opportunity Act (AGOA) matters significantly to Sub-Saharan African countries (SSA)’s apparel exports to the United States
AGOA has been the primary competitive advantage for SSA’s apparel exports to the United States. For example, US apparel imports from AGOA beneficiaries have risen from $953 million in 2001 to $1.4 billion in 2021 (note: up to $1.76 billion in 2022). More than 96.4% of these imports claimed AGOA’s duty-free benefits, including 98.8% utilized the “third-country fabric” provision.
While twenty countries were eligible for AGOA’s apparel provision, over 90% of US apparel imports from AGOA members in 2021 originated in five SSA countries: Kenya (31.5%), Madagascar (19.9%), Lesotho (20.6%), Ethiopia (18.3%), and Mauritius (5.1%).
AGOA benefits appear essential for SSA countries to maintain their apparel exports to the United States. USITC noted that in every case when a country lost AGOA eligibility between 2000 and 2021, there was a noticeable decrease in US apparel imports from that country, such as Rwanda and Madagascar. (note: according to OTEXA’s latest trade data, US apparel imports from Ethiopia, which lost its AGOA eligibility in 2022, dropped by 42% in the first two months of 2023 from a year ago, far worse than a 5.8% decrease of AGOA members as a whole.)
SSA garment manufacturers often find supplying the US apparel market a better fit than Europe, primarily because US brands tend to place orders for higher volume bulk basics, which allows workers to focus on a narrower set of skills.
The impact of AGOA on SSA’s apparel production and exports varied at the country level
Some SSA countries (e.g., Kenya and Lesotho) already had well-established apparel industries when AGOA was implemented in 2000. In contrast, other SSA countries (e.g., Madagascar, Ethiopia, Tanzania, and Ghana) received substantial investments from foreign-owned firms after AGOA was enacted, which helped jumpstart their apparel sectors.
USITC also identified two “unsuccessful” AGOA cases. For example, Mauritius was the largest AGOA beneficiary apparel supplier to the United States in 2000 but has since fallen to the fifth-largest in 2021, largely due to increased labor costs. Likewise, South Africa’s apparel export to the US was negatively affected by its disqualification from the “third-country fabric” provision under AGOA.
AGOA has had a limited impact on building an integrated regional textile and apparel supply chain in SSA
Currently, SSA countries primarily participate in the cut-and-sew operations of apparel based on imported textile raw materials from outside the region (mostly from Asia).
The USITC identified several challenges in building the local textile industry in SSA. For example, building a textile mill typically requires much higher investments (e.g., $200–300 million) than a garment factory (i.e., $25 million). Also, most SSA manufacturers cannot make the various types of yarns and fabrics in demand from U.S. buyers.
The dilemma is not new: Access to textile inputs from sources outside SSA is essential for garment manufacturers in SSA to meet the specifications of US buyers. However, relying on imported textile inputs reduces the incentives for investing in new textile production capabilities in SSA.
The USITC report found Mauritius an exception as it has developed a relatively competitive capability in producing cotton fabrics, which are supplied to garment factories in Madagascar. There is also some collaboration between cotton producers in Tanzania and Uganda and Kenya’s textile manufacturers.
US fashion companies generally see SSA as a promising emerging sourcing destination
Apparel producers in SSA are less established in global apparel value chains than manufacturers in other parts of the world. Therefore, it is not uncommon that fashion brands and retailers “work more directly with SSA apparel manufacturers to ensure product quality, particularly for new or expanding product lines.”
Most SSA garment factories only have cut, make, and trim (CMT) capability and rely on imported textile materials arranged by fashion brands and retailers.
USITC found that US companies increasingly import man-made fiber (MMF) apparel from AGOA members to benefit from greater import duty savings. (note: US tariff rates for MMF apparel were typically higher than those made with natural fibers like cotton. On the other hand, however, it’s worth noting that SSA countries generally have more competitive advantages in producing cotton apparel products than in producing MMF apparel).
SSA countries also have advantages over their Asia competitors. For example, “a shipment takes about 15–18 days to travel from the port in Lomé to the East Coast of the United States. From China or Bangladesh, lead times range from 40–50 days.”
Many fashion brands “have expressed interest in sourcing from greenfield factories with fewer legacy challenges posed by compliance and environmental impacts.”
US fashion companies’ sourcing diversification strategy to avoid risk exposure also contributed to the expansion of their apparel imports from AGOA members.
Uncertainty of AGOA renewals hurt US apparel imports from SSA
Apparel companies typically make sourcing decisions 12–18 months in advance. This practice underscores the importance of renewing AGOA early rather than granting extensions only within two to nine months of expiration, as in the past.
The USITC report mentioned, “Without the assurance of the “third country fabric” provision, many US apparel companies sourced from AGOA beneficiaries reported holding back orders from the region.”
More can be done to leverage SSA’s cotton production better
Cotton growing is widespread across about thirty SSA countries. SSA accounts for about 7 percent of the world’s cotton production, the fifth-largest globally.
However, most SSA cotton is sold to international buyers and exported to Asian mills that process it into yarns and fabrics. In contrast, the consumption of domestic cotton in SSA is limited.
The SSA cotton industry produces high-quality, “sustainable” cotton that can be used in several high-value end products sold globally. However, because of a lack of mechanization, SSA cotton production struggles to increase supply to meet demand.
Also, cotton-growing regions in SSA tend to be poorer and less politically stable than other parts of the region.
Discussion questions:
Based on the blog post and class discussions, how competitive or attractive are AGOA members as apparel-sourcing destinations for US fashion companies, especially compared with suppliers from Asia and the Western Hemisphere?
Based on the blog post, what improvement can be made to make AGOA or any problems that need to be addressed?
Any other thoughts related to the patterns of apparel trade and sourcing based on the blog post?
USITC adopted two methods to estimate Section 301 tariffs’ economic impacts:
Econometric model estimates using monthly trade data (10-digit HS code) from January 2017 to December 2021.
A set of partial equilibrium models that linked section 301 tariffs to domestic prices and production at the four-digit NAICS code level. USITC used data from 2018 to 2021 as the base year.
USITC only considered Section 301 tariffs’ direct impacts, i.e., “how tariffs impacted prices, production, and trade for products subject to section 301 tariffs and domestic sectors that compete directly with those imports.”
Regarding the overall impact of Section 301 actions, USITC found that the tariffs imposed on Chinese goods resulted in a price rise paid by US importers, but the exporter prices received by Chinese firms were mostly unchanged. As a result, “imports from China decreased in quantity, leading to a substantial decline in their import value. These changes, in turn, caused an increase in production and prices in US domestic industries that were competing with Chinese imports.”
USITC also evaluated the specific impacts of Section 301 tariffs on the Cut and Sew apparel (NAICS 3152) sector. According to USITC:
“nontariff-inclusive value” refers to the change in the value of imports from China excluding the value of the section 301 duties themselves, which provide an indication of the change in import quantities because export prices are mostly unchanged.
First, Section 301 tariffs hurt US apparel imports from China. USITC estimated that US woven apparel (NAICS 3152) imports from China decreased by 14.7% in 2019 but fell nearly 40% in 2020 and 2021 due to Section 301 tariffs. However, USITC didn’t explain why imports from China suddenly worsened, nor if other factors, such as the Uyghur Forced Labor Prevention Act (UFLPA), played a role.
Second, Section 301 tariffs mostly replaced US woven apparel (NAICS3152) imports from China with other sources. However, the direct benefits of Section 301 tariffs to US domestic cut and sew manufacturing seemed limited. Specifically, USITC estimated that US woven apparel imports from sources other than China increased by 7.1% in 2019, 24.8% in 2020, and 25.2% in 2021 due to Section 301 tariffs. In comparison, Section 301 tariffs resulted in modest growth of US domestic woven apparel (NAICS3152) production (up to 6.3%) over the same period.
Actual trade and production data further showed that US woven apparel (NAICS 3152) imports from sources other than China increased from $55.3 billion in 2018 to $61.2 billion in 2021 (or up 10.7%). Over the same period, US domestic woven apparel (NAICS 3152) sales & value of shipments declined from $7.49 billion to $7.38 billion (or down 1.4%) (Data source: Census). In other words, no clear evidence suggests that Section 301 tariffs boosted US domestic woven apparel production.
Third, Section 301 tariffs made US woven apparel (NAICS 3152) imports from EVERYWHERE more expensive. On the one hand, USITC found that the price of US woven apparel (NAICS 3152) imports from China increased by 4.4% in 2019, 14.7% in 2020, and 14.5% in 2021 due to the Section 301 tariffs. However, similar to the case of trade volume, USITC didn’t explain why Section 301 tariffs’ price impact suddenly became more significant in 2020 and 2021. (Note: In fact, the Tranche 4A tariffs were 15% since September 1, 2019, but were reduced to 7.5% effective February 14, 2020, because of the US-China Phase One deal.)
Meanwhile, due to limited production capacity outside of China, the Section 301 tariffs caused an increase in the cost of US woven apparel imports from all other countries. Specifically, USITC found that the price of US woven apparel (NACIS 3152) imports from sources other than China increased by 3.2% from 2018 to 2021. (Note: given the hiking sourcing costs in 2022, the price increase could be more significant should USITC include updated 2022 trade data in the estimation.)
Additionally, USITC acknowledged that its estimation may “likely captures the most significant impacts of these tariffs in the short run.” However, some effects of section 301 tariffs would likely be delayed. For example, USITC said, “if importers and domestic producers anticipated the tariffs remaining in place long enough,” they may consider more costly changes, such as adjusting their supply chains and investing in domestic production.
Discussion questions:
Based on USITC’s assessment, should President Biden keep or remove the Section 301 tariffs on imports from China? Why or why not?
Regarding the impact of Section 301, any questions remain unanswered or can be studied further?
Any findings in the USITC report surprised you and why?
Trend 1: US fashion companies continue to diversify their sourcing base in 2022
Numerous studies suggest that US fashion companies leverage sourcing diversification and sourcing from countries with large-scale production capacity in response to the shifting business environment. For example, according to the 2022 fashion industry benchmarking study from the US Fashion Industry Association (USFIA), more than half of surveyed US fashion brands and retailers (53%) reported sourcing apparel from over ten countries in 2022, compared with only 37% in 2021. Nearly 40% of respondents plan to source from even more countries and work with more suppliers over the next two years, up from only 17% in 2021.
Trade data confirms the trend. For example, the Herfindahl–Hirschman index (HHI), a commonly-used measurement of market concentration, went down from 0.110 in 2021 to 0.105 in 2022, suggesting that US apparel imports came from even more diverse sources.
Trend 2: Asia as a whole will remain the dominant source of imports
Measured in value, about 73.5% of US apparel imports came from Asia in 2022, up from 72.8% in 2021. Likewise, the CR5 index, measuring the total market shares of the top five suppliers—all Asia-based, i.e., China, Vietnam, Bangladesh, Indonesia, and India, went up from 60.6% in 2021 to 61.1% in 2022. Notably, the CR5 index without China (i.e., the total market shares of Vietnam, Bangladesh, Indonesia, India, and Cambodia) enjoyed even faster growth, from 40.7% in 2021 to 43.7% in 2022.
Additionally, facing growing market uncertainties and weakened consumer demand amid high inflation pressure, US fashion companies may continue to prioritize costs and flexibility in their vendor selection. Studies consistently show that Asia countries still enjoy notable advantages in both areas thanks to their highly integrated regional supply chain, production scale, and efficiency. Thus, US fashion companies are unlikely to reduce their exposure to Asia in the short to medium term despite some worries about the rising geopolitical risks.
Trend 3: US fashion companies’ China sourcing strategy continues to evolve
Several factors affected US apparel sourcing from China negatively in 2022:
One was China’s stringent zero-COVID policy, which led to severe supply chain disruptions, particularly during the fall. As a result, China’s market shares from September to November 2022 declined by 7-9 percentage points compared to the previous year over the same period.
The second factor was the implementation of the Uyghur Forced Labor Prevention Act (UFLPA) in June 2022, which discouraged US fashion companies from sourcing cotton products from China. For example, only about 10% of US cotton apparel came from China in the fourth quarter of 2022, down from 17% at the beginning of the year and much lower than nearly 27% back in 2018.
The third contributing factor was the US-China trade tensions, including the continuation of Section 301 punitive tariffs. Industry sources indicate that US fashion companies increasingly source from China for relatively higher-value-added items targeting the premium or luxury market segments to offset the additional sourcing costs.
Further, three trends are worth watching regarding China’s future as an apparel sourcing base for US fashion companies:
One is the emergence of the “Made in China for China” strategy, particularly for those companies that view China as a lucrative sales market. Recent studies show that many US fashion companies aim to tailor their product offerings further to meet Chinese consumers’ needs and preferences.
Second is Chinese textile and apparel companies’ growing efforts to invest and build factories overseas. As a result, more and more clothing labeled “Made in Bangladesh” and “Made in Vietnam” could be produced by factories owned by Chinese investors.
Third, China could accelerate its transition from exporting apparel to providing more textile raw materials to other apparel-exporting countries in Asia. Notably, over the past decade, most Asian apparel-exporting countries have become increasingly dependent on China’s textile raw material supply, from yarns and fabrics to various accessories. Moreover, recent regional trade agreements, particularly the Regional Comprehensive Economic Partnership (RCEP), provide new opportunities for supply chain integration in Asia.
Trend 4: US fashion companies demonstrate a new interest in expanding sourcing from the Western Hemisphere, but key bottlenecks need to be solved
Trade data suggests a mixed picture of near-shoring in 2022. For example, members of the Dominican Republic-Central America Free Trade Agreement (CAFTA-DR) and US-Mexico-Canada Trade Agreement (USMCA) accounted for a declining share of US apparel imports in 2022, measured in quantity and value. While CAFTA-DR and USMCA members showed an increase in their market share of US apparel imports in the fourth quarter of 2022, reaching 10.7% and 3.1%, respectively, this growth was not accompanied by an increase in trade volume. Instead, US apparel imports from these countries decreased by 11% and 15%, respectively, compared to the previous year. CAFTA-DR and USMCA members’ gain in market share was mainly due to a sharper decline in US apparel imports from the rest of the world (i.e., decreased by over 25% in the fourth quarter of 2022).
Trade data also suggests two other bottlenecks preventing more US apparel sourcing from CAFTA-DR and USMCA members. One is the lack of product diversity. For example, the product diversification index consistently shows that US apparel imports from CAFTA-DR members and Mexico concentrated on only a limited category of products, and the problem worsened in 2022. The result explained why US fashion companies often couldn’t move souring orders from Asia to CAFTA-DR and USMCA members.
Another problem is the underutilization of the trade agreement. For example, CAFTA-DR’s utilization rate for US apparel imports consistently went down from its peak of 87% in 2011 to only 74% in 2021. The utilization rate fell to 66.6% in 2022, the lowest since CAFTA-DR fully came into force in 2007. This means that as much as one-third of US apparel imports from CAFTA-DR did NOT claim the agreement’s preferential duty benefits. Thus, regarding how to practically grow US fashion companies’ near-shoring, we could expect more public discussions and debates in the new year.
This article provided a comprehensive review of the world textiles and clothing trade patterns in 2021 based on the newly released data from the World Trade Statistical Review 2022 and the United Nations (UNComtrade). Affected by the ongoing pandemic and companies’ evolving production and sourcing strategies in response to the shifting business environment, the world textiles and clothing trade patterns in 2021 included both continuities and new trends. Specifically:
Pattern #1: As the world economy recovered from COVID, the world clothing export boomed in 2021, while the world textile exports grew much slower due to a high trade volume the year before. Specifically, thanks to consumers’ strong demand, world clothing exports in 2021 fully bounced back to the pre-COVID level and exceeded $548.8bn, a substantial increase of 21.9% from 2020. The apparel sector is not alone. With economic activities mostly resumed, the world merchandise trade in 2021 also jumped 26.5% from a year ago, the fastest growth in decades.
In comparison, the value of world textiles exports grew slower at 7.8% in 2021 (i.e., reached $354.2bn), lagging behind most sectors. However, such a pattern was understandable as the textile trade maintained a high level in 2020, driven by high demand for personal protective equipment (PPE) during the pandemic.
Nevertheless, the world textiles and clothing trade could face strong headwinds down the road due to a slowing world economy and consumers’ weakened demand. Notably, amid hiking inflation, high energy costs, and retrenchment of global supply chains, leading international economic agencies, from the World Bank to the International Monetary Fund (IMF), unanimously predict a slowing economy worldwide. Likewise, the World Trade Organization (WTO) forecasts that the growth of world merchandise trade will be cut to 3.5% in 2022 and down further to only 1% in 2023. As a result, the world textiles and clothing trade will likely struggle with stagnant growth or a modest decline over the next two years.
Pattern #2: COVID did NOT fundamentally shift the competitive landscape of textile exports but affected the export product structure. Meanwhile, some long-term structural changes in world textile exports continued in 2021.
Specifically, China, the European Union (EU), and India remained the world’s three largest textile exporters in 2021, a pattern that has stayed stable for over a decade. Together, these top three accounted for 68% of the world’s textile exports in 2021, similar to 66.9% before the pandemic (2018-2019). Other textile exporters that made it to the top ten list in 2021 were also the same as a year ago and before the pandemic (2018-2019).
Meanwhile, the growth rate of the top ten textile exporters varied significantly in 2021, ranging from -5.5% (China) to 47.8% (India). The demand shift from PPE to apparel-related yarns and fabrics was a critical contributing factor behind the phenomenon. For example, China’s PPE-related textile exports decreased by more than $33bn (or down 43%) in 2021. In contrast, the world knit fabric exports (SITC code 655) surged by more than 30% in 2021, led by India (up 74%) and Pakistan (up 72%). Nevertheless, as consumers’ lifestyles almost reached a “new normal,” we could expect the textile export product structure to stabilize soon.
On the other hand, as a trend already emerged before the pandemic, middle-income developing countries continued to play a more significant role in textile exports, whereas developed countries lost market shares. For example, the United States, Germany, and Italy led the world’s textile exports in the 2000s, accounting for more than 20% of the market shares. However, these three countries’ shares fell to 12.8% in 2019 and hit a new low of 11.3% in 2021. In comparison, middle-income developing countries like China, Vietnam, Turkey, and India have entered the development stage of expanding textile manufacturing. As a result, their market share in the world’s textile exports rose steadily. These countries also achieved a more balanced textiles/clothing export ratio over the years, meaning more textile raw materials like yarns and fabrics can be locally produced instead of relying on imports. For example, Vietnam, known for its competitive clothing products, achieved a new high of $11.5bn in textile exports in 2021 and ranked sixth globally. Vietnam’s textiles/clothing ratio also doubled from 0.15 in 2005 to 0.37 in 2021. It is not unlikely that Vietnam’s textile exports may surpass the United States over the next few years.
Pattern #3: Countries with large-scale production capacity stood out in world clothing exports in 2021. Meanwhile, clothing exporters compete to become China’s alternatives, but there seems to be no clear winner yet.
Consumers’ surging demand and COVID-related supply chain disruptions significantly impacted the world’s clothing export patterns in 2021. As fashion brands and retailers were eager to find sourcing capacity, countries with large-scale production capacity and relatively stable supply enjoyed the fastest growth in clothing exports. For example, except for Vietnam, which suffered several months of COVID lockdowns, all other top five clothing exporters enjoyed a more than 20% growth of their exports in 2021, such as China (up 24%), Bangladesh (up 30%), Turkey (up 22%), and India (up 24%).
As another critical trend, many international fashion brands and retailers have been trying to reduce their apparel sourcing from China, driven by various economic and non-economic factors, from cost considerations and trade tensions to geopolitics. Notably, despite its strong performance in 2021, China accounted for only 23.1% of US apparel imports in 2022 (January to September), much lower than 36.2% in 2015. Likewise, China’s market shares in the EU, Japanese, and Canadian clothing import markets also fell over the same period, suggesting this was a worldwide phenomenon.
With reduced apparel sourcing from China, fashion companies have actively sought alternative sourcing destinations, but the latest trade data suggests no clear winner yet. For example, Vietnam and Bangladesh, the two most popular candidates for “Next China,” accounted for 6.5% and 5.7% shares in the world’s clothing export in 2021, still far behind China (32.1%). Interestingly, from 2015 to 2021, the world’s top four largest clothing exporters next to China (i.e., Bangladesh, Vietnam, Turkey, and India) did not substantially gain new market shares. Instead, China’s lost market was filled by “the rest of the world.”
Additionally, recent studies show that many fashion companies have switched back to the sourcing diversification strategy in 2022 as managing risks and improving sourcing flexibility become more urgent priorities. In other words, the world’s clothing export market could turn more “crowded” and competitive in the coming years.
Pattern #4: Regional supply chains remain critical features of the world textiles and clothing trade. Several factors support and shape the regional textiles and clothing trade patterns. First, as clothing production often needs to be close to where textile materials are available, many developing clothing-producing countries rely heavily on imported textile materials, primarily from more advanced economies in the same region. Second, through lowered trade barriers, regional free trade agreements also financially encouraged garment producers, particularly in Asia, the EU, and Western Hemisphere (WH), to use locally or regionally made textile materials. Further, fashion companies’ interest in “near-shoring” supported the regional supply chain, and related textiles and clothing trade flows between neighboring countries.
The latest trade data indicated that Asia’s regional textiles and clothing trade patterns strengthened further despite supply chain chaos during the pandemic. Specifically, in 2021, as many as 82% of Asian countries’ textile imports came from within Asia, up from 80% in 2015. China, in particular, has played a more prominent role as a leading textile supplier for other Asian clothing-exporting countries. For example, more than 60% of Vietnam’s textile imports came from China in 2021, a substantial increase from 23% in 2005. The same pattern applied to Pakistan, Cambodia, Bangladesh, and the Association of Southeast Asian Nations (ASEAN) members.
In January 2022, the Regional Comprehensive Economic Partnership (RCEP), a mega free trade agreement involving all major economies in Asia, entered into force. The tariff cut and very liberal rules of origin of the agreement will hopefully drive Asia’s booming regional textiles and clothing trade and further deepen its regional economic integration.
Besides Asia, the regional textiles and clothing trade pattern in the EU (or the so-called Intra-EU trade) was also in good shape. In 2021, 50.8% of EU countries’ textile imports and 37% of clothing imports came from other EU members. This pattern has changed little over the past decade, thanks to many EU countries’ commitment to maintaining local textiles and clothing production rather than outsourcing.
In comparison, the Western Hemisphere (WH) textile and apparel supply chain (e.g., clothing made in Mexico or Central America using US or regionally made textiles) seemed to struggle in recent years. As of 2021, only 20% of WH countries’ textile imports came from within WH, down from 26% in 2015. Likewise, WH countries (mainly the US and Canada) just imported 14.6% of clothing from WH in 2021, down from 15.3% in 2015 and much lower than their EU counterparts (37% in 2021). It will be interesting to see whether US and Canadian fashion companies’ expressed interest in expanding near-shoring may reverse the course.
Furthermore, the regional textiles and clothing trade patterns in Sub-Saharan Africa (SSA) are also worth watching. Compared with Asia and the EU, SSA clothing producers used much fewer locally-made textiles (i.e., stagnant at around 11% only from 2011 to 2021), reflecting the region’s lack of textile manufacturing capability. Most trade programs with SSA countries, such as the US-led African Growth and Opportunity Act (AGOA) and EU’s Everything But Arms (EBA) program, adopt liberal rules of origin for clothing products, allowing third-party textile input to be used. It can be studied whether such liberal rules of origin somehow disincentivize building SSA’s own textile manufacturing sector or are still essential given the reality of SSA’s limited textile production capacity.
The EU region as a whole remains one of the world’s leading producers of textile and apparel (T&A). The EU’s T&A production value totaled EUR135.6 bn in 2019, down around 6% from a year ago (Note: Statistical Classification of Economic Activities or NACE, sectors C13, and C14). The EU’s T&A output value was divided almost equally between textile manufacturing (EUR69.4bn) and apparel manufacturing (EUR66.2bn).
Regarding textile production, Southern and Western EU, where most developed EU members are located, such as Germany, France, and Italy, accounted for nearly 60% of EU’s textile manufacturing in 2020. Further, of EU countries’ total textile output, the share of non-woven and other technical textile products (NACE sectors C1395 and C1396) has increased from 20.2% in 2011 to 23.2% in 2019, which reflects the ongoing structural change of the sector.
Apparel manufacturing in the EU includes two primary segments: one is the medium-priced products for consumption in the mass market, which are produced primarily by developing countries in Eastern and Southern Europe, such as Poland, Hungary, and Romania, where cheap labor is relatively abundant. The other category is the high-end luxury apparel produced by developed Western EU countries, such as Italy, UK, France, and Germany.
It is also interesting to note that in Western EU countries, labor only accounted for 20.3% of the total apparel production cost in 2019, which was substantially lower than 30.1% back in 2006. This change suggests that apparel manufacturing is becoming capital and technology-intensive in some developed Western EU countries—as companies are actively adopting automation technology in garment production.
Because of their relatively high GDP per capita and the size of the population, Germany, Italy, the UK, France, and Spain accounted for nearly 60% of total apparel retail sales in the EU in 2021. Such a market structure has stayed stable over the past decade. Also, reflecting local consumers’ preference, EU apparel brands overall outperform non-EU brands in the EU retail market.
Intra-region trade is an essential feature of the EU’s textile and apparel industry. Despite the increasing pressure from cost-competitive Asian suppliers, statistics from UNComtrade show that of the EU region’s total textile imports in 2019, as much as 53.8% were in the category of intra-region trade. However, it could result from increased PPE imports from Asia, EU countries’ Intra-region trade% for textiles dropped to 40% in 2020.
Meanwhile, about one-third of EU countries’ apparel imports came from other EU members during 2019-2020. In comparison, close to 98% of apparel consumed in the United States was imported over the same period, of which more than 75% came from Asia (Eurostat, 2022; UNComtrade, 2022).
Regarding EU countries’ textile and apparel trade with non-EU members (i.e., extra-region trade), the United States remained one of the EU’s top export markets and a vital textile supplier (mainly for technical and industrial textiles). Meanwhile, Asian countries, led by China, and Bangladesh, served as the dominant apparel sourcing base outside the EU region for EU fashion brands and retailers. Turkey was another important apparel sourcing base for EU fashion companies. There is no sign that COVID-19 has shifted the trade pattern.
Additionally, Vietnam was EU’s sixth-largest extra-region apparel supplier in 2020 (after China, Bangladesh, Turkey, India, and Cambodia), accounting for 4% in value. The EU-Vietnam Free Trade Agreement which took effect in August 2020, could encourage more EU apparel sourcing from the country in the long run.
According to the European Apparel and Textile Federation (Euratex), the EU textile and apparel industry continued to recover from COVID-19. For example, the value of textile and apparel output has already reached its pre-pandemic level by the end of 2022. However, Euratex warns that the EU textile and apparel industry still faces significant challenges from a slowed economy, hiking energy costs as a result of the Russia-Ukraine war, and high inflation.
First, US apparel imports enjoyed a decent growth but started to face softening demand.
Thanks to consumers’ spending, in the first half of 2022, US apparel imports went up 40% in value and 24% in quantity from a year ago.
However, due to US consumers’ weakening demand amid the economic downturn, the speed of import expansion is slowing down quickly. As an alert, the US consumer confidence index (CCI) fell to 54.8 in June 2022 (January 2019=100), the lowest since the pandemic. This result suggests that US consumers were increasingly worried about their household’s financial outlook and would hold back their discretionary clothing spending.
The month-over-month growth of US apparel imports dropped to only 2.6% in value and nearly zero in quantity in June 2022 from over 10% at the beginning of the year.
As the trajectory of the US economy remains highly uncertain in the medium term, we could expect many US fashion companies to turn more conservative about placing new sourcing orders in the second half of 2022 to control inventory and avoid overstock.
Second, fashion companies struggled with hiking apparel sourcing costs driven by multiple factors.
The price index of US apparel imports reached 103.9 in June 2022 (January 2019=100), a 3.1% increase from a year ago and the highest since 2019. USITC data further shows that, of the over 200 types of apparel items (HS Chapters 61 and 62) at the six-digit code level, nearly 70% had a price increase in the first half of 2022 from a year ago, including almost 40% experiencing a price increase exceeding 10 percent.
According to the 2022 Fashion Industry Benchmarking Study recently released by the US Fashion Industry Association (USFIA), 100 percent of respondents expect their sourcing costs to increase in 2022, including nearly 40 percent expecting a substantial cost increase from a year ago. Further, respondents say that almost everything has become more expensive this year, from textile raw materials, shipping, and labor to the costs associated with compliance with trade regulations.
To make the situation even worse, the more expensive “cost of goods” resulted in heavier burdens of ad valorem import duties for US fashion companies. USITC data shows that in the first five months of 2022, US companies paid $6,117 million in tariffs for apparel imports (HS Chapters 61 and 62), a significant increase of 42.9% from a year ago. Of these import duties paid by US companies, about 30% (or $1,804 million) resulted from the controversial US Section 301 action against Chinese imports. Because of the Section 301 tariff action, the average applied US tariff rate for apparel imports also increased from 17.2% in 2018 to 18.7% in the first half of 2022.
Even though the US retail price index for clothing reached 102.7 in June 2022 (January 2019=100), the price increase was behind the import cost surge over the same period. In other words, given the intense market competition and weaker demand, US fashion companies couldn’t pass the sourcing cost increase to consumers entirely.
Third, US fashion companies continued to diversify their sourcing base in 2022, which benefited large-scale suppliers in Asia.
The Herfindahl–Hirschman index (HHI), a commonly-used measurement of market concentration, went down from 0.11 in 2021 to 0.10 in the first half of 2022, suggesting that US apparel imports came from even more diverse sources. Similarly, the CS3 index, measuring the total market shares of the top three suppliers (i.e., China, Vietnam, and Bangladesh), fell below 50% in the first half of 2022, the lowest since 2018.
The Asia region remains the dominant source of apparel for US fashion companies: about 74.4% of US apparel imports came from Asian countries in the first half of 2022 (by value), which has stayed stable for over a decade.
One critical factor behind the apparent “contradictory” phenomenon is US fashion companies’ intention to reduce their “China exposure” further. Notably, considering all primary sourcing factors, from cost, speed to market, production flexibility, agility, and compliance risks, relatively large-scale Asian suppliers are the most likely alternatives to “Made in China.” Thus, the CR5 index excluding China (i.e., the market shares of Vietnam, Bangladesh, Indonesia, India, and Cambodia) increased from 40.7% in 2021 to 45.5% in the first half of 2022.
Fourth, US fashion companies’ evolving China sourcing strategy is far more subtle and complicated than simply “moving out of China.”
US fashion companies doubled their efforts to reduce sourcing from China in 2022, particularly in response to the newly implemented Uyghur Forced Labor Prevention Act (UFLPA) and the growing geopolitical risks. For example, measured in value, only 13.2% of US cotton apparel imports (OTEXA code 31) came from China in the first half of 2022, which fell from 14.4% a year ago and much lower than nearly 30% back in 2017.
Industry sources indicate that US fashion companies are “upgrading” what they source from China, possibly to offset the Section 301 punitive tariffs. The structural change includes importing less basic apparel items (e.g., tops and bottoms) and more sophisticated and higher-valued categories (e.g., dresses). Also, US fashion companies increasingly source from China for apparel items sold in the high-end market. For example, measured by the number of Stock Keeping Units (SKU), about 94% of apparel labeled “Made in China” sold in the US retail market targeted the value segment in 2018. However, of those apparel “Made in China” newly launched to the US retail market between January and July 2022, less than 2% were in the value segment. Instead, items targeting the higher-priced premium and mass market segments surged from 5% to 64%. Another 33% of “Made in China” were luxury apparel items. In other words, US fashion companies no longer see China as a sourcing base for cheap low-end products. Their sourcing decisions regarding China would give more consideration to non-price factors.
Fifth,US apparel imports from the free trade agreements and trade preference programs partners stayed relatively stable in 2022 but lacked growth.
Despite the growing enthusiasm among US fashion companies for expanding near sourcing from the Western Hemisphere, the trade volume stayed stagnant. For example, in the first half of 2022, members of the Dominican Republic-Central America Free Trade Agreement (CAFTA-DR) accounted for 8.8% of US apparel imports in quantity and 9.9% in value, lower than a year ago (i.e., 9.9% in quantity and 11.1% in value). Likewise, Mexico also reported lower market shares in the US apparel import market in 2022. The results remind us that encouraging more US apparel sourcing from free trade agreements and preference program partners should go beyond offering preferential duty treatment.
Product diversification is a critical area that needs improvement, particularly regarding Western Hemisphere sourcing. For example, results show that US apparel sourcing from CAFTA-DR and Mexico generally concentrated on basic items such as tops and bottoms. In comparison, Asian countries, such as China, Vietnam, and Bangladesh, could offer much more diverse categories of products. This explains why US fashion companies treat large-scale Asian countries as their preferred alternatives to “Made in China” rather than moving sourcing orders to CAFTA-DR or Mexico.
Even though the ultimate goal is to expand US apparel sourcing from the Western Hemisphere, we need to make more efforts to practically and creatively solve the bottleneck of textile raw material supply facing garment producers in the region.
U.S. fashion companies report significant challenges coming from the macro-economy in 2022, particularly inflation and rising cost pressures. However, most respondents still feel optimistic about the next five years.
Respondents rated “increasing production or sourcing costs” and “inflation and outlook of the U.S. economy” as their 1st and 3rd top business challenges in 2022.
As a new record, 100 percent of respondents expect their sourcing costs to increase in 2022, including nearly 40 percent expecting a substantial cost increase from a year ago. Further, almost everything has become more expensive this year, from textile raw materials, shipping, and labor to the costs associated with compliance with trade regulations.
Over 90 percent of respondents expect their sourcing value or volume to grow in 2022, but more modest than last year.
Despite the short-term challenges, most respondents (77 percent) feel optimistic or somewhat optimistic about the next five years. Reflecting companies’ confidence in their businesses, nearly ALL respondents (97 percent) plan to increase hiring over the next five years.
U.S. fashion companies adopt a more diverse sourcing base in response to supply chain disruptions and the need to mitigate growing sourcing risks.
Asia remains the dominant sourcing base for U.S. fashion companies—eight of the top ten most utilized sourcing destinations are Asia-based, led by China, Vietnam, Bangladesh, and India.
More than half of respondents (53 percent) report sourcing apparel from over ten countries in 2022, compared with only 37 percent in 2021.
Reducing “China exposure” is one crucial driver of U.S. fashion companies’ sourcing diversification strategy. One-third of respondents report sourcing less than 10% of their apparel products from China this year. In addition, a new record of 50 percent of respondents sources MORE from Vietnam than China in 2022.
Nearly 40 percent of respondents plan to “source from more countries and work with more suppliers” over the next two years, up from only 17 percent last year.
Managing the risk of forced labor in the supply chain is a top priority for U.S. fashion companies in 2022, especially with the new implementation of the Uyghur Forced Labor Prevention Act (UFLPA).
Over 95 percent of respondents expect UFLPA’s implementation to affect their company’s sourcing. Notably, more than 85 percent of respondents plan to cut their cotton-apparel imports from China, and another 45 percent to further reduce non-cotton apparel imports from the country.
Most respondents (over 92 percent) do NOT plan to reduce apparel sourcing from Asian countries other than China. However, nearly 60 percent of respondents also would “explore new sourcing destinations outside Asia” in response to UFLPA.
Mapping and understanding the supply chain is a critical strategy adopted by U.S. fashion companies to address the forced labor risks in the supply chain. Almost all respondents currently track Tier 1 and 2 suppliers. With the help of new traceability technologies, 53 percent of respondents have started tracking Tier 3 suppliers this year (i.e., those manufacturing yarn, threads, and trimmings), a substantial increase from 25-36 percent in the past.
There is considerable new excitement about increasing apparel sourcing from members of the Dominican Republic-Central America Free Trade Agreement (CAFTA-DR). Respondents also call for more textile raw sourcing flexibility to encourage apparel sourcing from the CAFTA-DR region.
CAFTA-DR plays a more significant role as a sourcing base. About 20 percent of respondents place more than 10% of their sourcing orders from the region, doubling from 2021.
Over the next two years, more than 60 percent of respondents plan to increase apparel sourcing from CAFTA-DR members as part of their sourcing diversification strategy.
CAFTA-DR is critical in promoting U.S. apparel sourcing from the region. Around 80 percent of respondents took advantage of the agreement’s duty-free benefits when sourcing apparel from the region this year, up from 50—60 percent in the past.
Respondents say the exceptions to the “yarn-forward” rules of origin, such as the “short supply” and “cumulation” mechanisms, provide essential flexibility that encourages more apparel sourcing from CAFTA-DR members.
Respondents say improving textile raw material supply is critical to encouraging more U.S. apparel sourcing from CAFTA-DR members. Particularly, “allowing more flexibility in souring fabrics from outside CAFTA-DR” and “improving yarn production capacity and variety within CAFTA-DR” are the top two priorities.
U.S. fashion companies strongly support another ten-year renewal of the African Growth and Opportunity Act (AGOA). Meanwhile, Ethiopia’s loss of AGOA eligibility discourages U.S. apparel sourcing from the ENTIRE AGOA region.
As much as 75 percent of respondents say another ten-year AGOA renewal will encourage more apparel sourcing from the region and making investment commitments.
However, despite the tariff benefits and the liberal rules of origin, respondents express explicit concerns about the region’s lack of competitiveness in speed to market, political instability, and having an integrated regional supply chain.
Ethiopia’s loss of AGOA benefits had a notable negative impact on sourcing from the country AND the entire AGOA region. Notably, no respondent plans to move sourcing orders from Ethiopia to other AGOA beneficiaries.
The latest trade data shows that in the first four months of 2022, US apparel imports increased by 40.6% in value and 25.9% in quantity from a year ago. However, the seemingly robust import expansion is shadowed by the rising market uncertainties.
Uncertainty 1: US economy. As the US economic growth slows down, consumers have turned more cautious about discretionary spending on clothing to prioritize other necessities. Notably, in the first quarter of 2022, clothing accounted for only 3.9% of US consumers’ total expenditure, down from 4.3% in 2019 before the pandemic. Likewise, according to the Conference Board, US consumers’ confidence index (CCI) dropped to 106.4 (1985=100) in May 2022 from 113.8 in January 2022, confirming consumers’ increasing anxiety about their household’s financial outlook.
Removing the seasonal factor, US apparel imports in April 2022 went up 2.8% in quantity and 3.0% in value from March 2022, much lower than 9.3% and 11.9% a month ago (i.e., March 2022 vs. February 2022). The notable slowed import growth reflects the negative impact of inflation on US consumers’ clothing spending. According to the Census, the value of US clothing store sales marginally went up by 0.8% in April 2022 from a month ago, also the lowest so far in 2022.
Apparel import price index
Uncertainty 2: Worldwide inflation. Data from the Bureau of Economic Analysis shows that the price index of US apparel imports reached 103.1 in May 2022 (May 2020=100), up from 100.3 one year ago (i.e., a 2.8% price increase). At the product level (i.e., 6-digit HS Code, HS Chapters 61-62), over 60% of US apparel imports from leading sources such as China, Vietnam, Bangladesh, and CAFTA-DR experienced a price increase in the first quarter of 2022 compared with a year ago. The price surge of nearly 40% of products exceeded 10 percent. As almost everything, from shipping, textile raw materials, and labor to energy, continues to soar, the rising sourcing costs facing US fashion companies are not likely to ease anytime soon.
The deteriorating inflation also heats up the debate on whether to continue the US Section 301 tariff action against imports from China. Since implementing the punitive tariffs, US fashion companies have to pay around $1 billion in extra import duties every year, resulting in the average applied import tariff rate for dutiable apparel items reaching almost 19%. Although some e-commerce businesses took advantage of the so-called “de minimis” rule (i.e., imports valued at $800 or less by one person on a day are not required to pay tariffs), over 99.8% of dutiable US apparel imports still pay duties.
Uncertainty 3: “Made in China.” US apparel imports from China in April 2022 significantly dropped by 26.7% in quantity and 24.6% in value from March 2022 (seasonally adjusted). China’s market shares also fell to a new record low of 26.3% in quantity and 16.8% in value in April 2022. The zero-COVID policy and new lockdown undoubtedly was a critical factor contributing to the decline. Fashion companies’ concerns about the trajectory of the US-China relations and the upcoming implementation of the new Uyghur Forced Labor Prevention Act (UFLPA) are also relevant factors. For example, only 10.5% of US cotton apparel imports came from China in April 2022, a further decline from about 15% at the beginning of the year. Given the expected challenges of meeting the rebuttable presumption requirements in UFLPA and the high compliance costs, it is not unlikely that US fashion companies may continue to reduce their China exposure.
As US fashion companies source less from China, they primarily move their sourcing orders to China’s competitors in Asia. Measured in value, about 74.8% of US apparel imports came from Asia so far in 2022 (January-April), up from 72.8% a year ago. In comparison, there is no clear sign that more sourcing orders have been permanently moved to the Western Hemisphere. For example, in April 2022, CAFTA-DR members accounted for 9.3% of US apparel imports in quantity (was 10.8% in April 2021) and 10.2% in value (was 11.4% in April 2021).
Uncertainty 4: Shipping delays. Data suggests we are not out of the woods yet for shipping delays and supply chain disruptions. For example, as Table 2 shows, the seasonable pattern of US apparel imports in March 2022 is similar to January before the pandemic (2017-2020). In other words, many US fashion companies still face about 1.5-2 months of shipping delays. Additionally, several of China’s major ports were under strict COVID lockdowns starting in late March, including Shanghai, the world’s largest. Thus, the worsened supply chain disruptions could negatively affect the US apparel import volumes in the coming months.
As US fashion companies diversify their sourcing from Asia, near-sourcing from the Western Hemisphere, particularly members of the Dominican Republic-Central America Free Trade Agreement (CAFTA-DR) seems to benefit. According to the latest trade data from the Office of Textiles and Apparel (OTEXA), US apparel companies placed relatively more sourcing orders with suppliers in the Western Hemisphere in 2021. For example, CAFTA-DR members’ market shares increased by 0.31 percentage points in quantity and nearly one percentage point in value compared with a year ago.
However, it is concerning to see the utilization rate of CAFTA-DR for apparel sourcing fall to a new record low of only 73.7% in 2021. This means that as much as 26.3% of US apparel imports from CAFTA-DR members did NOT claim the duty-free benefits.
The lower free trade agreement (FTA) utilization rate became a problem, particularly among CAFTA-DR members with fast export growth to the US market in 2021. For example, whereas US apparel imports from Honduras enjoyed an impressive 45.6% growth in 2021, only 72.6% of these imports claimed the CAFTA-DR duty benefits, down from 82.3% a year ago. We can observe a similar pattern in El Salvador, Nicaragua, and the Dominican Republic.
The phenomenon is far from surprising, however. For years, US fashion companies have expressed concerns about the limited textile supply within CAFTA-DR, especially fabrics and textile accessories. The lack of textile supply plus the restrictive “yarn-forward” rules of origin in the agreement often creates a dilemma for US fashion companies: either source from Asia entirely or source from CAFTA-DR but forgo the duty-saving benefits.
Likewise, because of a lack of sufficient textile supply within the region, US apparel imports from CAFTA-DR members become increasingly concentrated on basic fashion items, typically facing intense competition with many alternative sourcing destinations. For example, measured in value, over 80% of US apparel imports from CAFTA-DR members in 2021 were shirts, trousers, and underwear. However, US companies import the vast majority (70%-88%) from non-CAFTA-DR sources for these product categories.
Understandably, it will be unlikely to substantially expand US apparel sourcing from CAFTA-DR members without solving the textile supply shortage problem facing the region.
First, US apparel imports continue to rebound in November 2021 as companies build the inventory for the holiday season. Thanks to US consumers’ strong demand and the upcoming holidays, the value of US apparel imports went up by 15.7% in November 2021 from a month ago (seasonally adjusted) and increased by as much as 39.7% from 2020. However, before the pandemic, the value of US apparel imports always peaked in October and then gradually slipped in November and December. The unusual surge of imports in November 2021 could be the combined effects of price inflation and the late arrival of goods due to the shipping crisis.
Meanwhile, US apparel imports so far in 2021 have been far more volatile than in the past few years because of uncertainties and disruptions caused by COVID-19 and the shipping crisis. For example, the year-over-year (YoY) growth rate ranged from 131% in May to 17.6% in July, causing fashion companies additional inventory planning and supply chain management challenges. Unfortunately, the new omicron variant could worsen the market uncertainty and volatility.
Second, Asian countries remain the dominant sourcing base for US fashion companies as the production capacity elsewhere is limited. Asian countries’ market shares fell from 74.2% in 2020 to 71.3% in July 2021, primarily because of the COVID lockdowns in Vietnam and Bangladesh. US apparel imports came from Asian countries rebounded to 74.8% and 72.5% in October and November 2021, respectively. This result suggests a lack of alternative sourcing destinations outside Asia, especially for large volume items. Meanwhile, the worsening shipping crisis affecting the route from Asia to North America could explain why Asian suppliers’ market shares in November were somewhat lower than a month ago.
Third, US companies continue to treat China as one of their essential sourcing bases in the current business environment. However, companies are NOT reversing their long-term strategy of reducing “China exposure.” China stays the largest supplier for the US market in November 2021, accounting for 41.5% of total US apparel imports in quantity and 25.8% in value. Due to the seasonal factor, China’s market shares typically peak from June to September and then drop from October until March-April.
Both industry sources and the export product diversification index also consistently show that China supplied the most variety of products to the US market with no near competitors. In comparison, US apparel imports from Bangladesh, Mexico, and CAFTA-DR members concentrate more on specific product categories.
Nevertheless, the HHI index and market concentration ratios (CR3 and CR5) calculated based on the latest data suggest that US fashion companies continue to move their apparel sourcing orders from China to other Asian countries overall. For example, only around 15% of US cotton apparel comes from China, compared with about 27% in 2018. My latest studies also indicate that it has become ever more common to see a fashion company places only around 10% of its total sourcing value or volume from China compared to over 30% in the past. Furthermore, with the growing tensions of the US-China relations and the newly enacted Uyghur Forced Labor Prevention Act, fashion companies could take another look at their China sourcing strategy to avoid potential high-impact disruptions.
Fourth, near sourcing from the Western Hemisphere, especially CAFTA-DR members, continue to gain popularity. Specifically, 17.3% of US apparel imports came from the Western Hemisphere year-to-date (YTD) in 2021 (January-November), higher than 16.1% in 2020. Notably, CAFTA-DR members’ market shares increased to 10.6% in 2021 (January to November) from 9.6% in 2020. The value of US apparel imports from CAFTA-DR also enjoyed a 41.7% growth in 2021 (January—November) from a year ago, one of the highest among all sourcing destinations. The imports from El Salvador (up 42.6%), Honduras (up 47.1%), and Guatemala (36.6%) had grown particularly fast so far in 2021. However, the political instability in some Central American countries could make fashion companies feel hesitant to permanently switch their sourcing orders to the region or make long-term investments.
Additionally, the latest trade data suggests a notable increase in the price of US apparel imports. Notably, the unit price of US apparel imports from almost all leading sources went up by more than 10% from January 2021 to November 2021. As worldwide inflation continues, the rising sourcing cost pressure won’t ease anytime soon.
The Regional Comprehensive Economic Partnership (RCEP)is a free trade agreement between ten member states of the Association of Southeast Asian Nations (ASEAN)* and five other large economies in the Asia-Pacific region (China, Japan, South Korea, New Zealand, and Australia). RCEP was reached on November 15, 2020, after nearly eight years of tough negotiation. (Note: ASEAN members include Brunei, Cambodia, Indonesia, Laos, Malaysia, Myanmar, the Philippines, Singapore, Thailand, and Vietnam. India was an original RCEP member but decided to quit in late 2019 due to concerns about competing with Chinese products, including textiles and apparel.)
So far, RCEP is the world’s largest trading bloc. As of 2019, RCEP members accounted for nearly 26.2% of world GDP, 29.5% of world merchandise exports, and 25.9% of world merchandise imports.
As of November 1, 2021, Lao, Burnei, Cambodia, Singapore and Thailand (ASEAN members), as well as China, Japan, New Zealand and Australia have ratified the agreement. This has met the minimum criteria for RCEP to enter into force (i.e., six members, including at least three ASEAN members and three non-ASEAN members).
Why RCEP matters to the textile and apparel industry?
RCEP matters significantly for the textile and apparel (T&A) sector. According to statistics from the United Nations, in 2019, the fifteen RCEP members altogether exported US$374 billion worth of T&A (or 50% of the world share) and imported US$139 billion (or 20% of the world share).
In particular, RCEP members serve as critical apparel-sourcing bases for many US and EU fashion brands. For example, in 2019, close to 60% of US apparel imports came from RCEP members, up from 45% in 2005. Likewise, in 2019, 32% of EU apparel imports also came from RCEP members, up from 28.1% in 2005.
Notably, RCEP members have been developing and forming a regional textile and apparel supply chain. More economically advanced RCEP members (such as Japan, South Korea, and China) supply textile raw materials to the less economically developed countries in the region within this regional supply chain. Based on relatively lower wages, the less developed countries typically undertake the most labor-intensive processes of apparel manufacturing and then export finished apparel to major consumption markets worldwide.
As a reflection of an ever more integrated regional supply chain, in 2019, as much as 72.8% of RCEP members’ textile imports came from other RCEP members, a substantial increase from only 57.6% in 2005. Nearly 40% of RCEP members’ textile exports also went to other RCEP members in 2019, up from 31.9% in 2005.
What are the key provisions in RCEP related to textiles and apparel?
First, RCEP members have committed to reducing the tariff rates to zero for most textile and apparel traded between RCEP members on day one after the agreement enters into force. That being said, the detailed tariff phaseout schedule for textile and apparel products under RCEP is very complicated. Each RCEP member sets their own tariff phaseout schedule, which can last more than 20 years (for example, 34 years for South Korea and 21 years for Japan.) Also, different from U.S. or EU-based free trade agreements, the RCEP phaseout schedule is country-specific. For example, South Korea sets different tariff phaseout schedules for textile and apparel products from ASEAN, China, Australia, Japan, and New Zealand. Japan’s tariff cut for apparel products is more generous toward ASEAN members and less so for China and South Korea (see the graph above). Companies interested in taking advantage of the duty-free benefits under RCEP need to study the “rules of the game” in detail.
Second, in general, RCEP adopts very liberal rules of origin for apparel products. It only requires that all non-originating materials used in the production of the good have undergone a tariff shift at the 2-digit HS code level (say a change from any chapters from chapters 50-60 to chapter 61). In other words, RCEP members are allowed to source yarns and fabrics from anywhere in the world, and the finished garments will still qualify for duty-free benefits. Most garment factories in RCEP member countries can immediately enjoy the RCEP benefits without adjusting their current supply chains.
What are the potential economic impacts of RCEP on the textile and apparel sector?
On the one hand, the implementation of RCEP is likely to further strengthen the regional textile and apparel supply chain among RCEP members. Particularly, RCEP will likely strengthen Japan, South Korea, and China as the primary textile suppliers for the regional T&A supply chain. Meanwhile, RCEP will also enlarge the role of ASEAN as the leading apparel producer in the region.
On the other hand, as a trading bloc, RCEP could make it even harder for non-RCEP members to get involved in the regional textile and apparel supply chain formed by RCEP members. Because an entire regional textile and apparel supply chain already exists among RCEP members, plus the factor of speed to market, few incentives are out there for RCEP members to partner with suppliers from outside the region in textile and apparel production. The tariff elimination under the RCEP will put textile and apparel producers that are not members of the agreement at a more significant disadvantage in the competition. Not surprisingly, according to a recent study, measured by value, only around 21.5% of RCEP members’ textile imports will come from outside the area after the implementation of the agreement, down from the base-year level of 29.9% in 2015.
Further, the reaching of RCEP could accelerate the negotiation of other trade agreements in the Asia-Pacific region, such as the China-South Korea-Japan Free Trade Agreement. We might also see growing pressures on the Biden administration to join the Comprehensive and Progressive Agreement of the Trans-Pacific Partnership (CPTPP) to strengthen the US economic ties with countries in the Asia-Pacific region. The economic competition between the United States and China in the area could also intensify as the combined effects of RCEP and CPTPP begin to shape new supply chains and test the impacts of the two countries on the regional trade patterns.
First, the shipping crisis and new wave of COVID cases start to affect US apparel imports negatively. While US consumers’ demand for clothing overall remains strong, for the second month in a row, the value of US apparel imports (seasonally adjusted) in July 2021 decreased by 5.5% from a month ago and down 9.7% from May to June. The absolute value of US apparel imports year to date (YTD) in 2021 (January—July) was 25.3% higher than in 2020 and around 87% of the pre-COVID level (benchmark: January-July, 2019). However, the year-over-year growth in July 2021 was only 15.4%, compared with 60.0% in May 2021 and 29.1% in June 2021. Overall, the results remind us that the market environment is far from stable yet as the COVID situation in the US and other parts of the world continues to evolve.
Second, Asian countries lost market shares as some leading apparel supplying countries, including Vietnam and Bangladesh, struggled with new COVID lockdowns. While Asia as a whole remains the single largest apparel sourcing base for US companies, Asian countries’ market shares fell from 74.2% in 2020 to 71.3% in July 2021, the lowest since 2010. The new COVID lockdowns in Vietnam and Bangladesh, the No. 2 and No. 3 top suppliers for the US market, post significant challenges to US fashion companies trying to build inventory for the upcoming holiday season. Notably, US companies source many high-volume products from these two countries, and there is a lack of alternative sourcing destinations in the short run.
Third, US companies continue to treat China as an essential sourcing base during the current challenging time. However, there is no clear sign that companies are reversing their long-term strategy of reducing “China exposure.” China stays the largest supplier for the US market in July 2021, accounting for 41.3% of total US apparel imports in quantity and 26.0% in value. The export product diversification index also suggests that China supplied the most variety of products to the US market. US apparel imports from Bangladesh, Mexico, and CAFTA-DR members are more concentrated on specific product categories. In other words, should China were under lockdowns, the negative impacts on US companies’ inventory management could be even worse.
Nevertheless, the HHI index and market concentration ratios (CR3 and CR5) calculated based on the latest data suggest that US fashion companies continue to move their apparel sourcing orders from China to other Asian countries overall. For example, only 14.7% of US cotton apparel imports came from China in 2021 (January—July), a new record low in the past ten years. Further, as US apparel imports from China typically peak from June to September because of seasonal factors, China’s market shares are likely to drop in the next few months. Additionally, the fundamental concerns about sourcing from China are NOT gone. On the contrary, new US actions against alleged forced labor in Xinjiang are likely in the coming months and affect imports from China beyond cotton products.
Fourth, US apparel sourcing from the Western Hemisphere, especially CAFTA-DR members, gains new momentum. Specifically, 18.1% of US apparel imports came from the Western Hemisphere YTD in 2021 (January-July), higher than 16.1% in 2020 and 17.1% before the pandemic. Notably, CAFTA-DR members’ market shares increased to 11.2% in 2021 (January to July) from 9.6% in 2020. The value of US apparel imports from CAFTA-DR also enjoyed a 58.4% growth in 2021 (January—July) from a year ago, one of the highest among all sourcing destinations. The imports from El Salvador (up 75.2%), Honduras (up 74.6%), Dominican Republic (45.1%), and Guatemala (40.6%) had grown particularly fast so far in 2021.
Meanwhile, US apparel imports from USMCA members stayed stable (i.e., no significant change in market shares). CAFTA-DR and USMCA members currently account for around 60% and 25% of US apparel imports from the Western Hemisphere. They are also the single largest export market for US textile products (about 70%).
Fifth, US apparel imports start to see a notable price increase. While an across-the-board price increase was not a big concern at the beginning of 2021, the increase has become more noticeable since June 2021. For example, of the top 20 US apparel imports (HS chapters 61-62) at the 6-digit HS code level based on import value, the price of thirteen products increased from May to June 2021. The price increase at the country level is even more significant. From May to July 2021, the average unit price of US apparel imports from leading sources all went up substantially, including China (7%), Vietnam (13%), Bangladesh (13.9%), and India (15.6%).
As almost everything is becoming more expensive, from raw material, shipping to labor, the August and September trade data (to be released in October and November) could suggest an even more significant price increase.
According to the latest statistics released by the American Apparel and Footwear Association (AAFA):
In 2020, the US apparel and footwear industry directly employed about 3 million Americans and employed another 2.3 million indirectly.
In 2020, on average, every man, woman, and child in the United States spent $1,067.93 to buy 51.8 pieces of clothes and 5.8 pairs of shoes.
In 2020, US apparel and footwear production accounted for 3.5 percent and 2.3 percent of the US market, respectively.
Due to COVID-19, in 2020, US imports of apparel and footwear sank 16.4 percent and 23.5 percent, respectively. However, imports still supplied 96.5 percent of apparel and 97.7 percent of footwear available in the US market.
In 2020, the average effective tariff rate hit records for both apparel and footwear, reaching 15.5 percent and 13.0 percent, respectively.
According to the World Trade Statistical Review 2021 report released by the World Trade Organization (WTO), the textiles and apparel trade patterns in 2020 include both continuities and new trends affected by the pandemic and companies’ evolving production and sourcing strategies in response to the shifting business environment.
Pattern #1: COVID-19 significantly affected the world textile and apparel trade volumes, resulting in substantial growth of textile exports and a declined demand for apparel.
Driven by increased personal protective equipment (PPE) production, global textile exports grew by 16.1% in 2020, reaching $353bn. In comparison, affected by lockdown measures, worsened economy, and consumers’ tighter budget for discretionary spending, global apparel export decreased by nearly 9% in 2020, totaling $448bn, the worst performance in decades. The apparel sector is not alone. The world merchandise trade in 2020 also suffered an unprecedented 8% drop from a year ago, with COVID-19 to blame.
Notably, as economic activities returned in the second half of 2020, the world clothing export quickly rebounded to around 95% of the pre-covid level by the end of 2020. That being said, the unexpected resurgence of COVID cases in summer 2021, especially the delta variant, caused new market uncertainties. Overall, the world textile and apparel trade recovery process from COVID-19 will differ from our experiences during the 2008 global financial crisis.
Pattern #2: COVID-19 did NOT shift the competitive landscape of the world textile exports; Meanwhile, textile exports from China and Vietnam gained new momentum during the pandemic.
China, the European Union (EU), and India remained the world’s three largest textile exporters in 2020. Together, these top three accounted for 65.8% of the world’s textile exports in 2020, similar to 66.9% before the pandemic (2018-2019).
Notably, China and Vietnam enjoyed a substantial increase in their textile exports in 2020, up 28.9% and 10.7% from a year ago, respectively. The complete textile and apparel supply chain and considerable production capability allow these two countries to switch clothing production to PPE manufacturing quickly. In particular, Vietnamexceeded South Korea and ranked the world’s sixth-largest textile exporter in 2020 ($10 bn of exports), the first time in history.
The United States dropped one place and ranked the world’s fifth-largest textile exporter in 2020 (was 4th from 2015 to 2019), accounting for 3.2% of the shares (was 4.4% in 2019). Production disruptions at the beginning of the pandemic and the shift toward PPE production for domestic consumption were the two primary contributing factors behind the decline in U.S. textile exports. Due to the regional trade patterns, around 67% of U.S. textile exports went to the Western Hemisphere in 2020, including 46% for members of the U.S.-Mexico-Canada Trade Agreement (USMCA) and another 17.2% for members of the Dominican Republic-Central America Free Trade Agreement (CAFTA-DR).
Pattern #3: Fashion companies’ efforts to diversify apparel sourcing from China somehow slowed during the pandemic.
China, the European Union, Vietnam, and Bangladesh unshakably remained the world’s four largest apparel exporters in 2020. Altogether, these top four accounted for 72.2% of the world market shares in 2020, higher than 71.4% in 2019.
Notably, while China steadily accounted for declining shares in the world’s total apparel exports since 2015, its market shares rebounded to 31.6% in 2020 from 30.7% in 2019. We can observe a similar pattern in Canada (up from 36.2% to 41.2%) and the EU (31.2% to 31.3%), two of the world’s leading apparel import markets. Even in the U.S. market, where Chinese goods face adverse impacts of the tariff war, the market shares of “Made in China” only marginally decreased from 30.8% in 2019 to 29.8% in 2020, compared with a more significant drop before the pandemic (i.e., fell from 34.4% 2018 to 30.8% in 2019).
Several factors could explain the resilience of China’s apparel exports: 1) fashion brands and retailers’ particular sourcing criteria match China’s competitiveness during the pandemic (e.g., flexibility, agility, and total landed sourcing cost). 2) China has one of the world’s most complete textile and apparel supply chains, allowing garment factories to access textile raw material and accessories locally. 3) Compared with many other apparel exporting countries, China suffered a shorter COVID lockdown period and resumed apparel production earlier and more quickly. Most Chinese textile and apparel factories started to reopen in April 2020, and they resumed an overall 90%-95% operational capacity rate by July 2020.
Nonetheless, fashion companies are NOT reversing their long-term strategies to reduce “China exposure” for apparel sourcing. On the contrary, non-economic factors, particularly the concerns about forced labor in China’s Xinjiang region, push most western fashion brands and retailers to develop apparel sourcing capacities beyond China. Meanwhile, no single country has yet and will likely become the “Next China” because of capacity limits. Instead, from 2015 to 2020, China’s lost market shares in the world apparel exports (around 7.8 percentage points) were picked up jointly by its competitors in Asia, including ASEAN members (up 4.4 percentage points), Bangladesh (up 1.3 percentage points), and Pakistan (up 0.3 percentage point). Such a trend is most likely to continue in the post-COVID world.
Pattern #4: Developed economies led textile PPE imports during the pandemic, whereas the developing countries imported fewer textiles as their apparel exports dropped.
On the one hand, the value of textile imports by developed economies, including EU members, the United States, Japan, and Canada, surged by more than 30 percent in 2020, driven mainly by their demand for PPE. The result also reveals the significant contribution of international trade in supporting the supply and distribution of textile PPE globally. On the other hand, the developing countries engaged in apparel production and export drove the import demand for textile raw materials like yarns and fabrics. However, most of these developing countries’ textile imports fell in 2020, corresponding to their decreased apparel exports during the pandemic.
Pattern #5: Despite COVID-19, the world apparel import market continues to diversify. The import demand increasingly comes from emerging economies with a booming middle class.
Affected by consumers’ purchasing power (often measured by GDP per capita) and the size of the population, the European Union, the United States, and Japan remained the world’s three largest apparel importers in 2020, a stable pattern that has lasted for decades. While these top three still absorbed 56.2% of the world’s apparel imports in 2020, it was a new record low in the past ten years (was 58.1% in 2019 and 61.5% in 2018), and much lower than 84% back in 2005.
Behind the numbers, it is not the case that consumers in the EU, the United States, and Japan necessarily purchase less clothing over the years. Instead, several emerging economies have become fast-growing apparel-consuming markets with robust import demand. For example, despite COVID-19, China’s apparel imports totaled $9.5bn in 2020, up 6.5% from 2019. From 2010 to 2020, China’s apparel imports enjoyed a nearly 15% annual growth, compared with only 0.56% of the traditional top three. Around 30% of China’s apparel imports today are luxury items made in the EU.

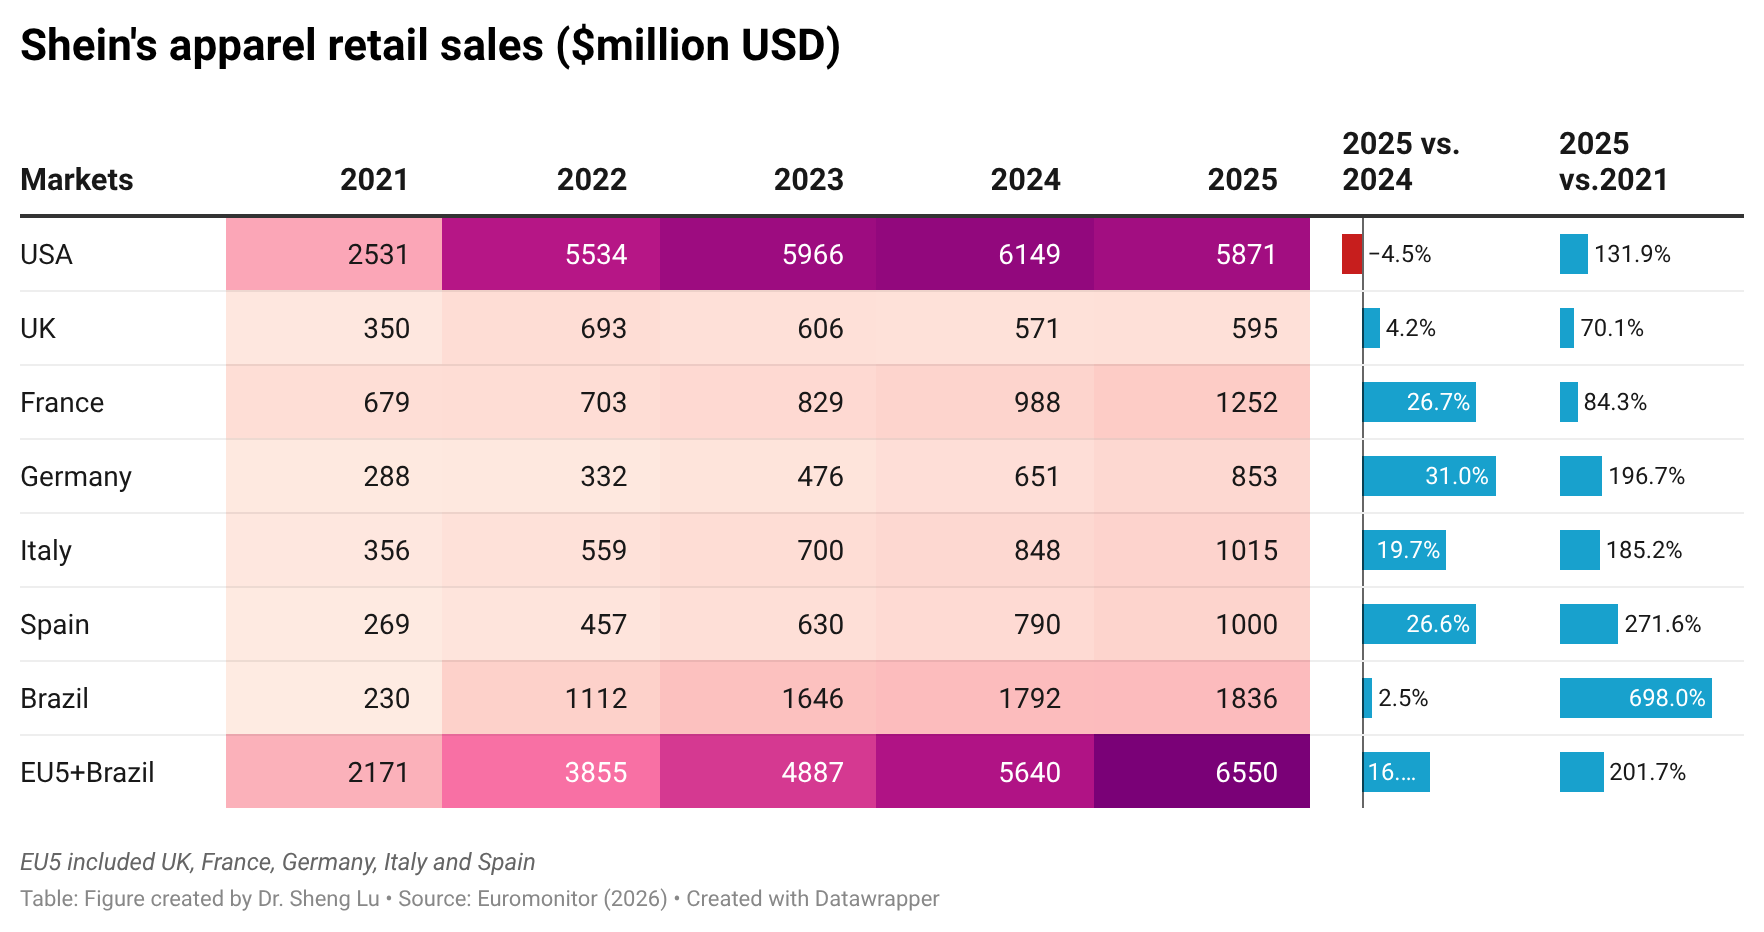
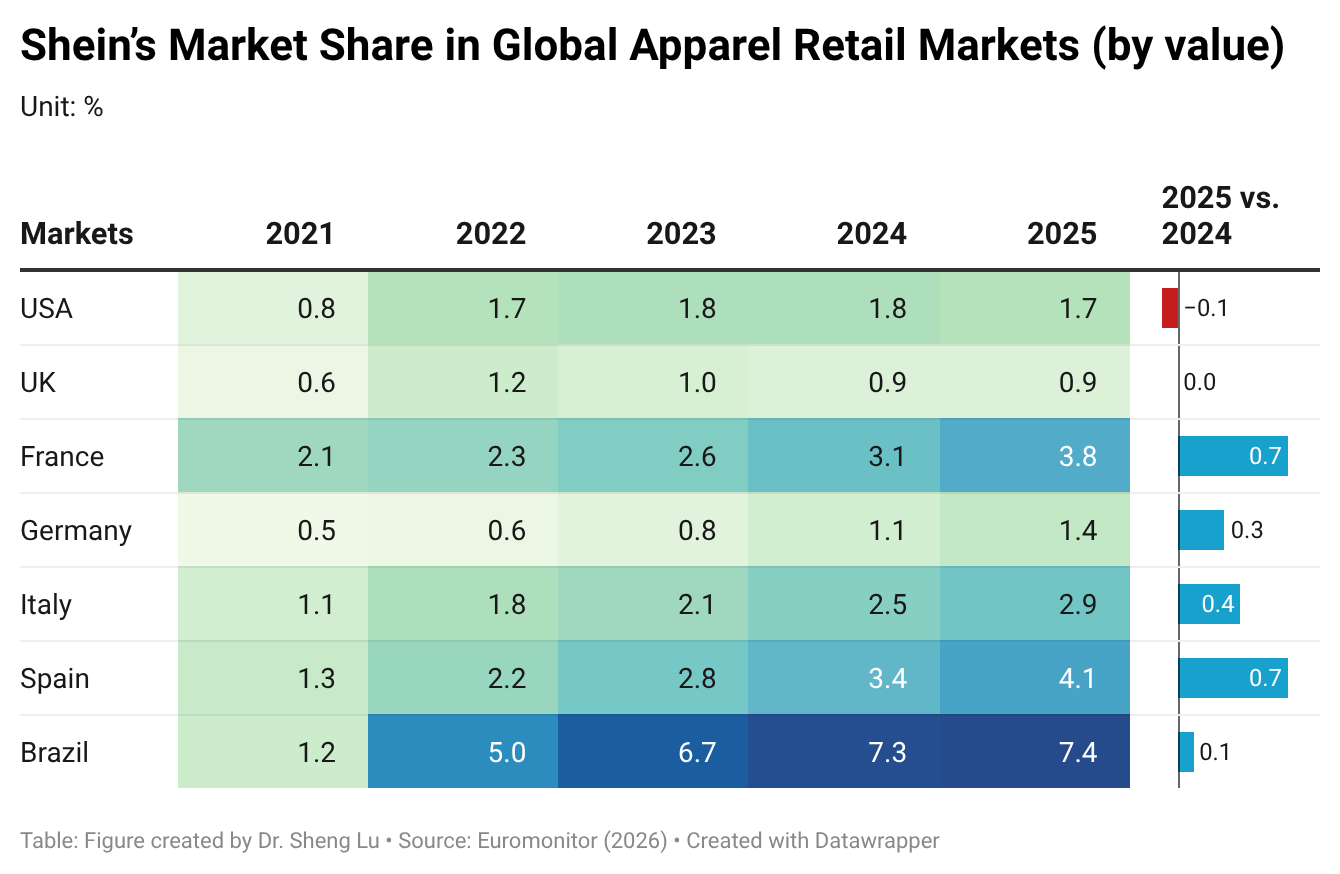
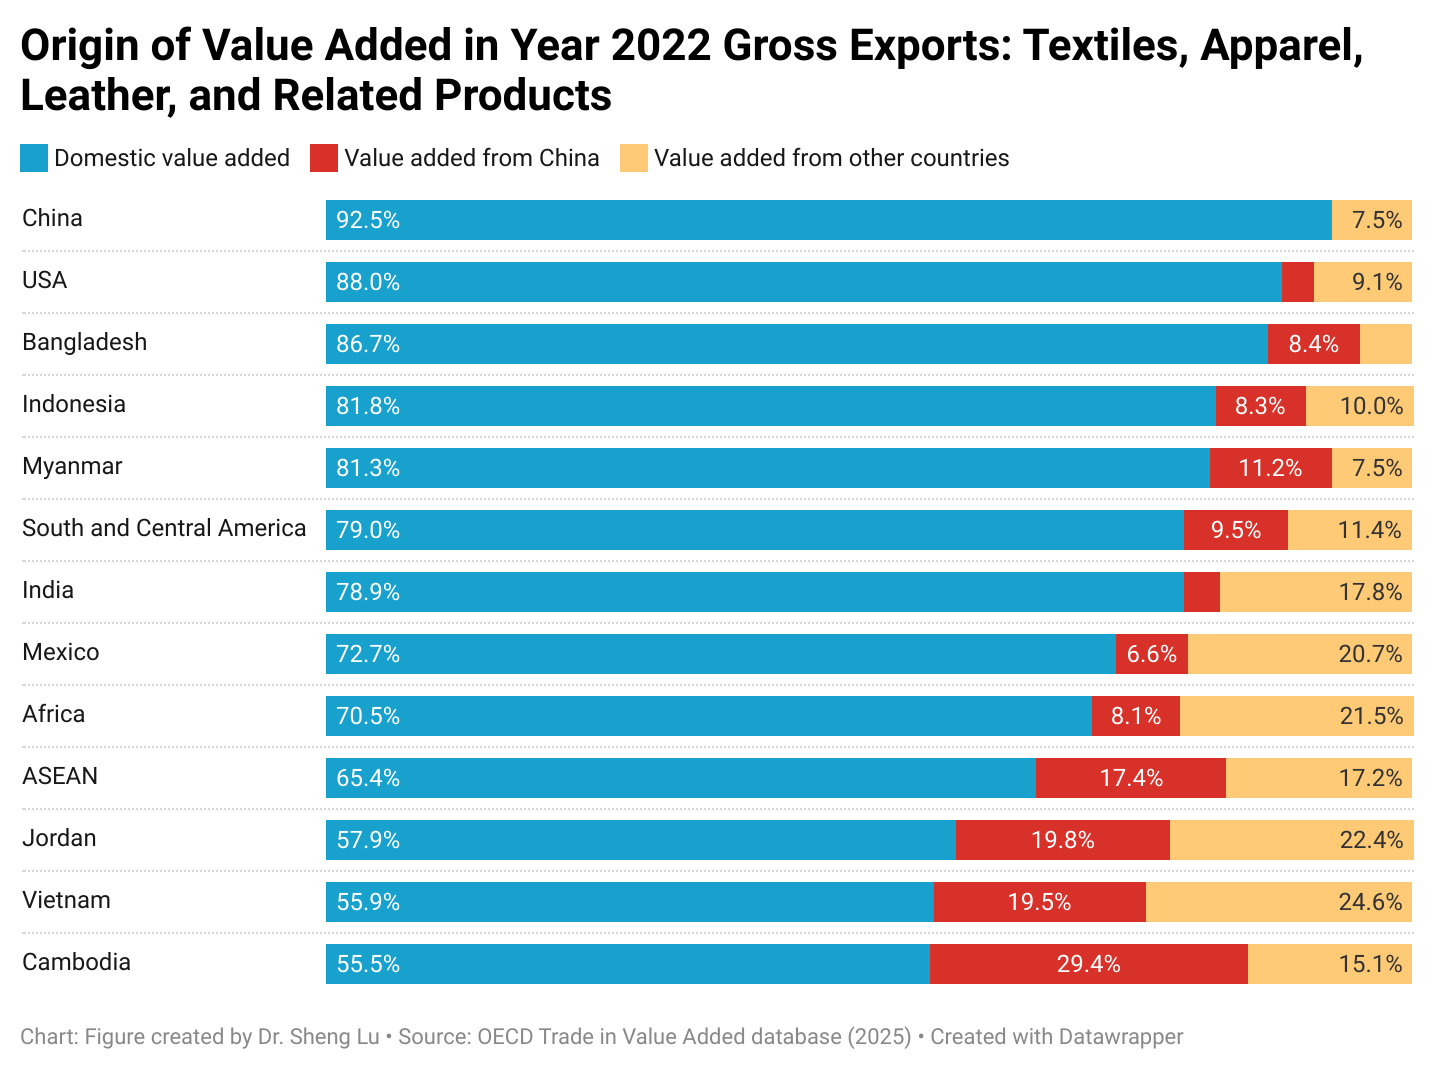
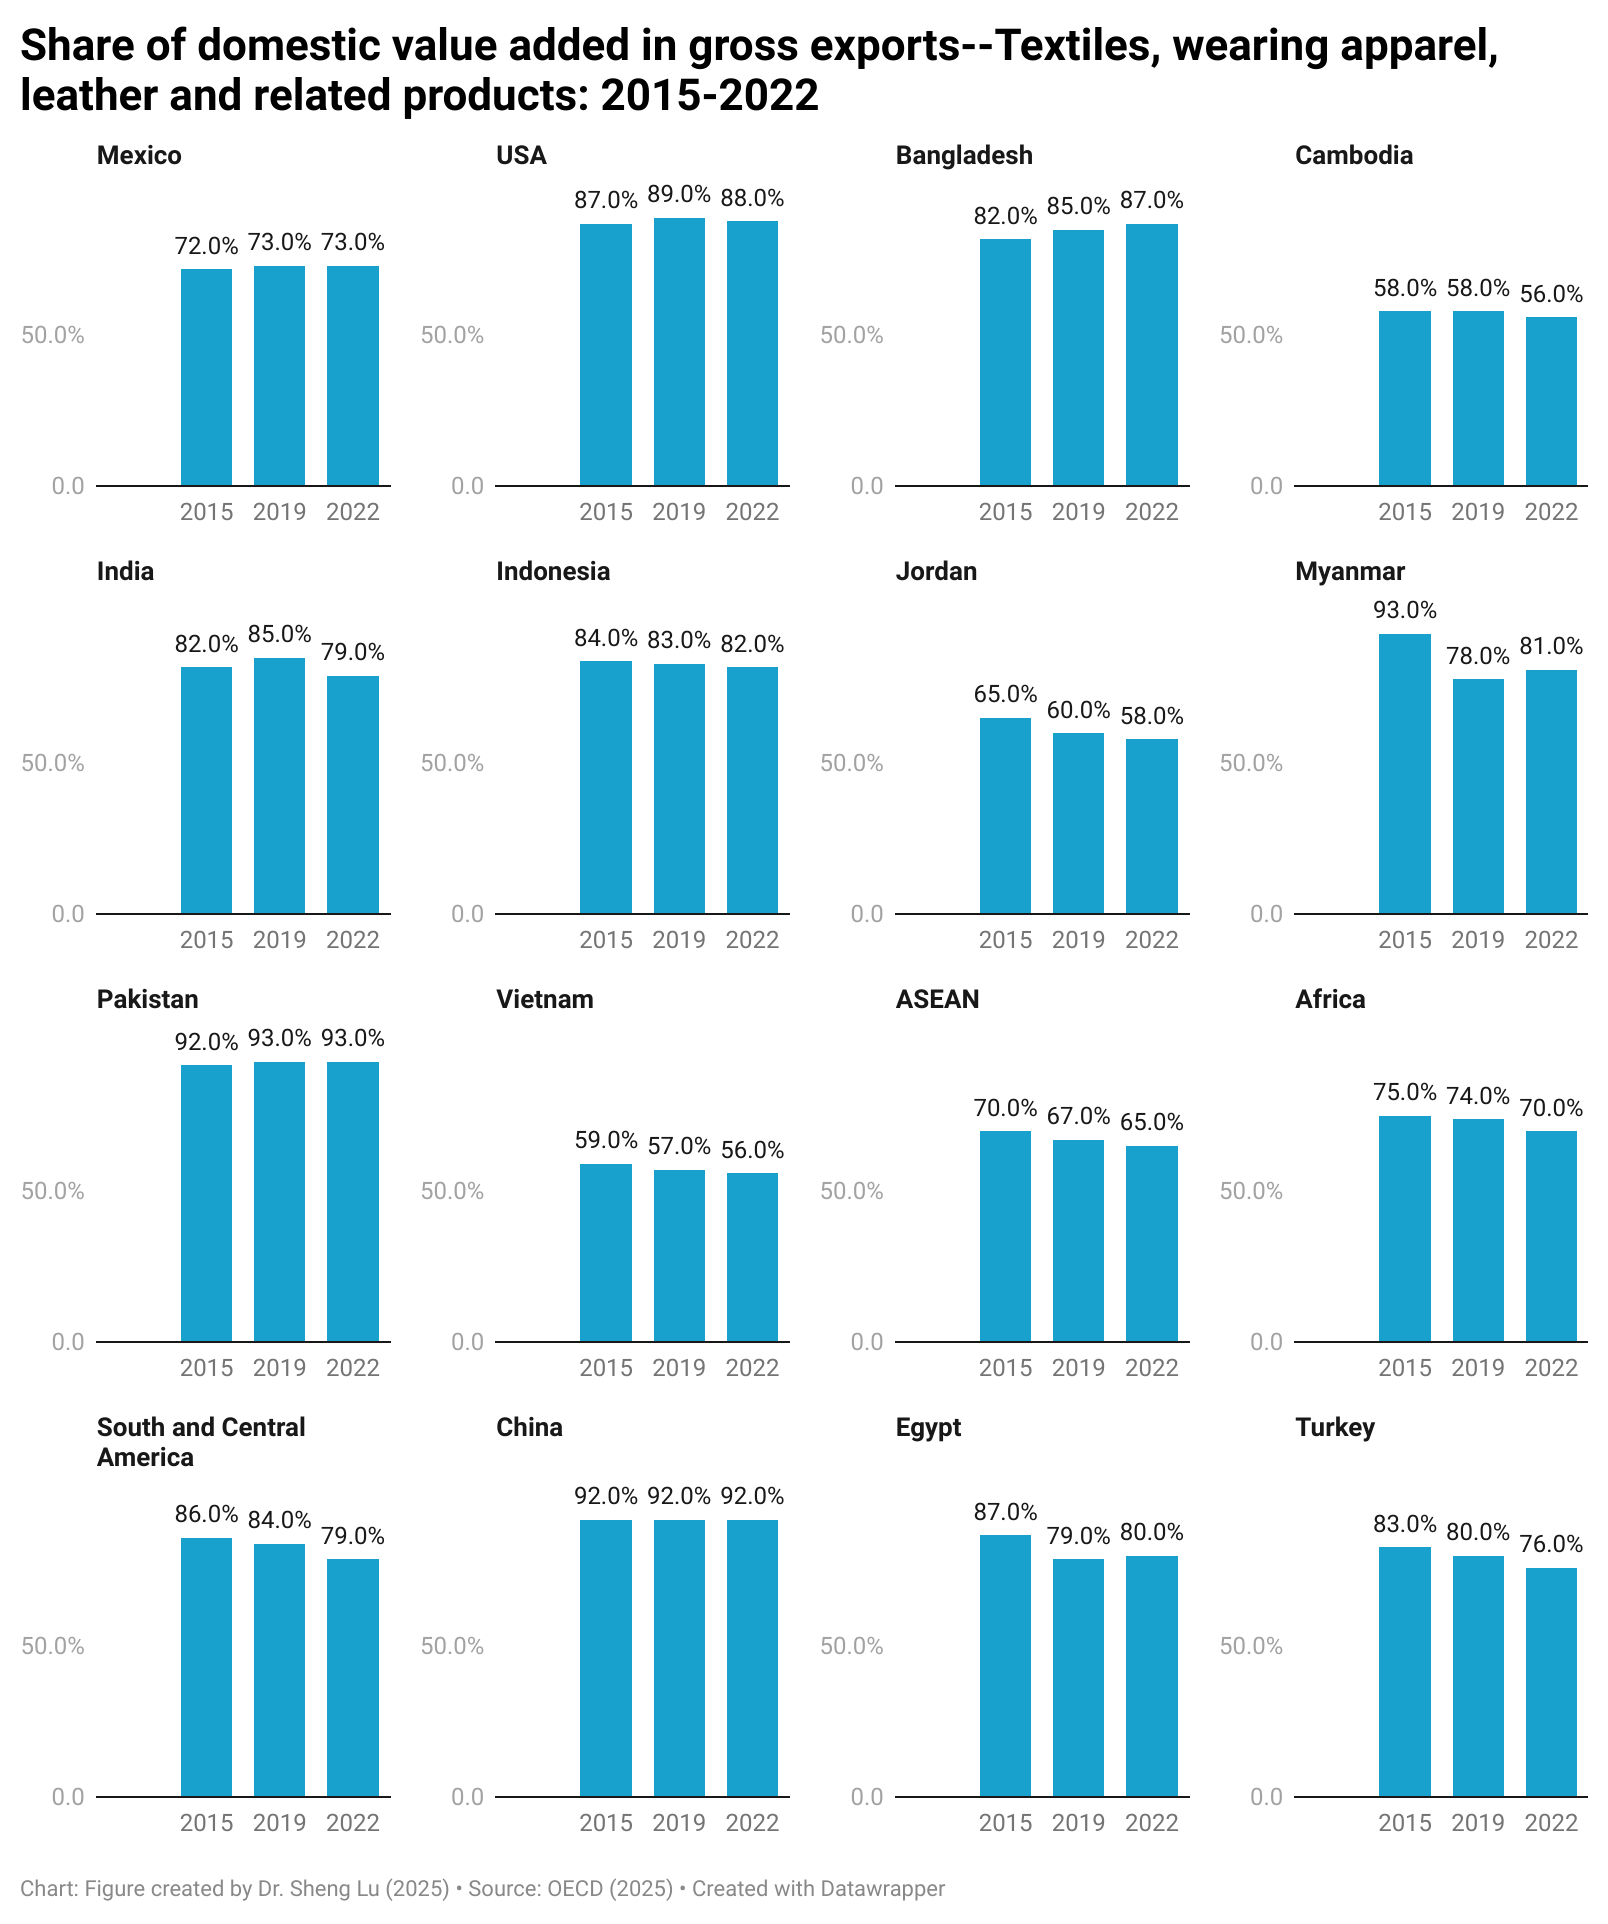
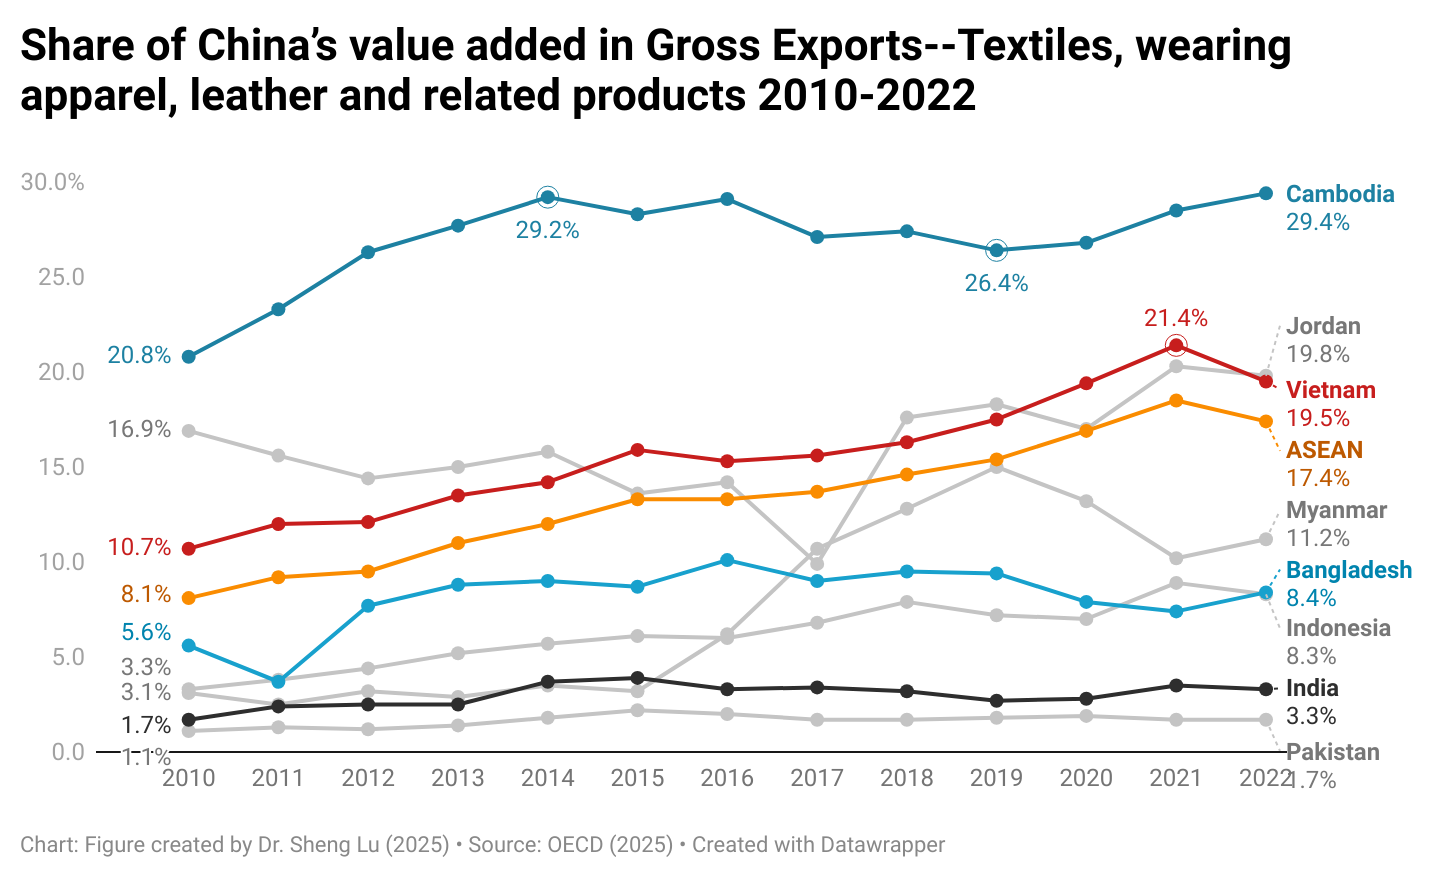
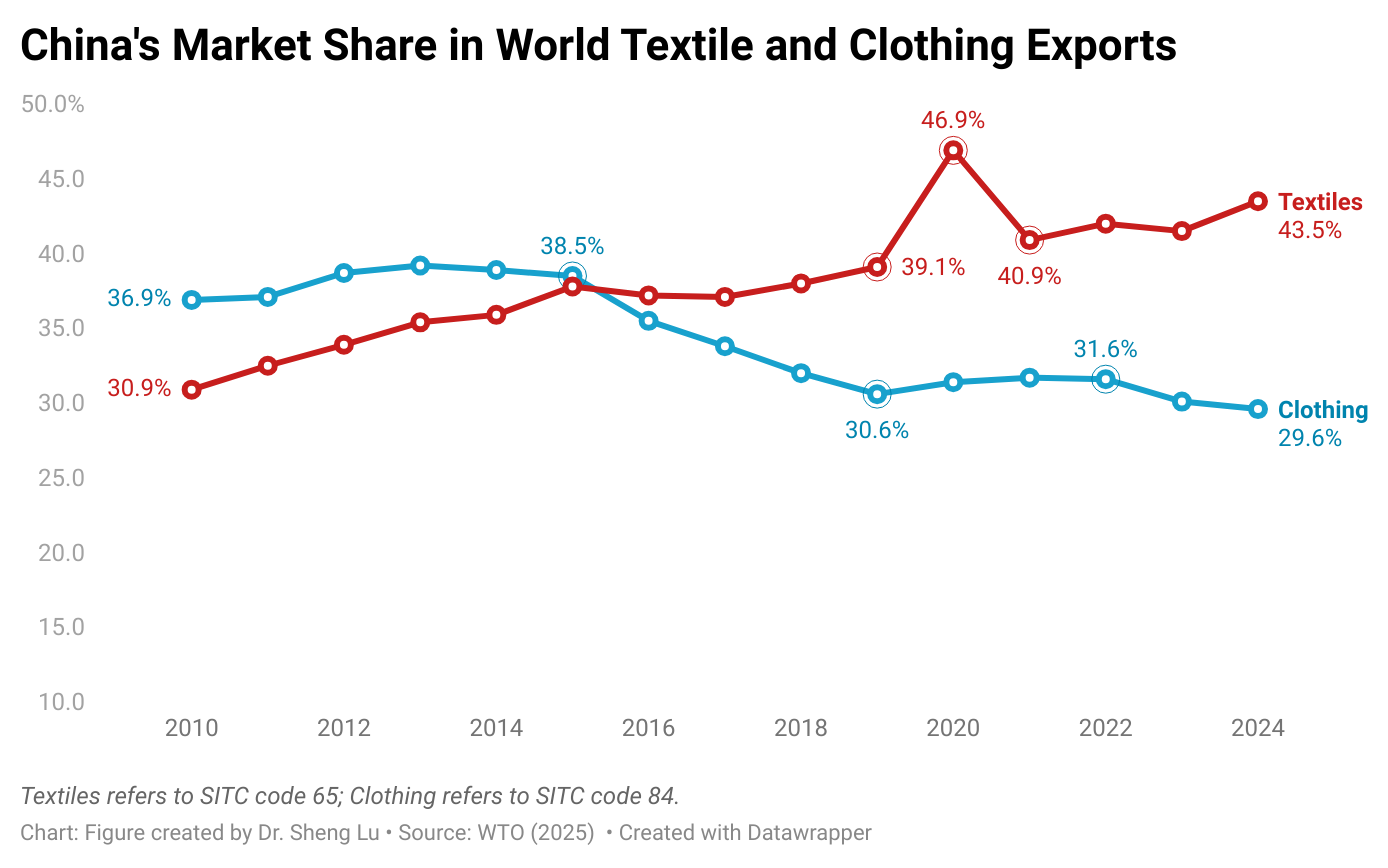
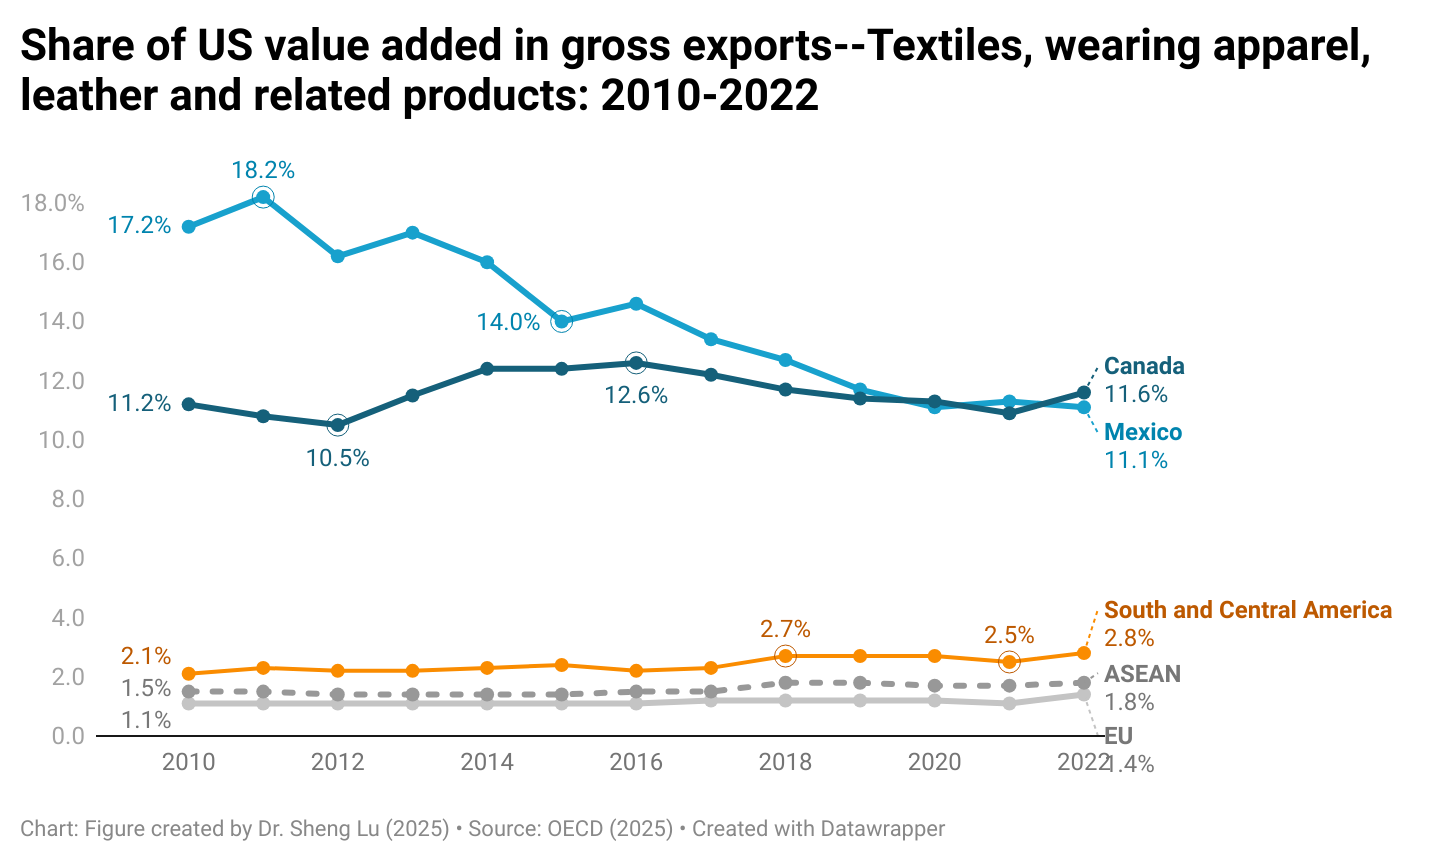
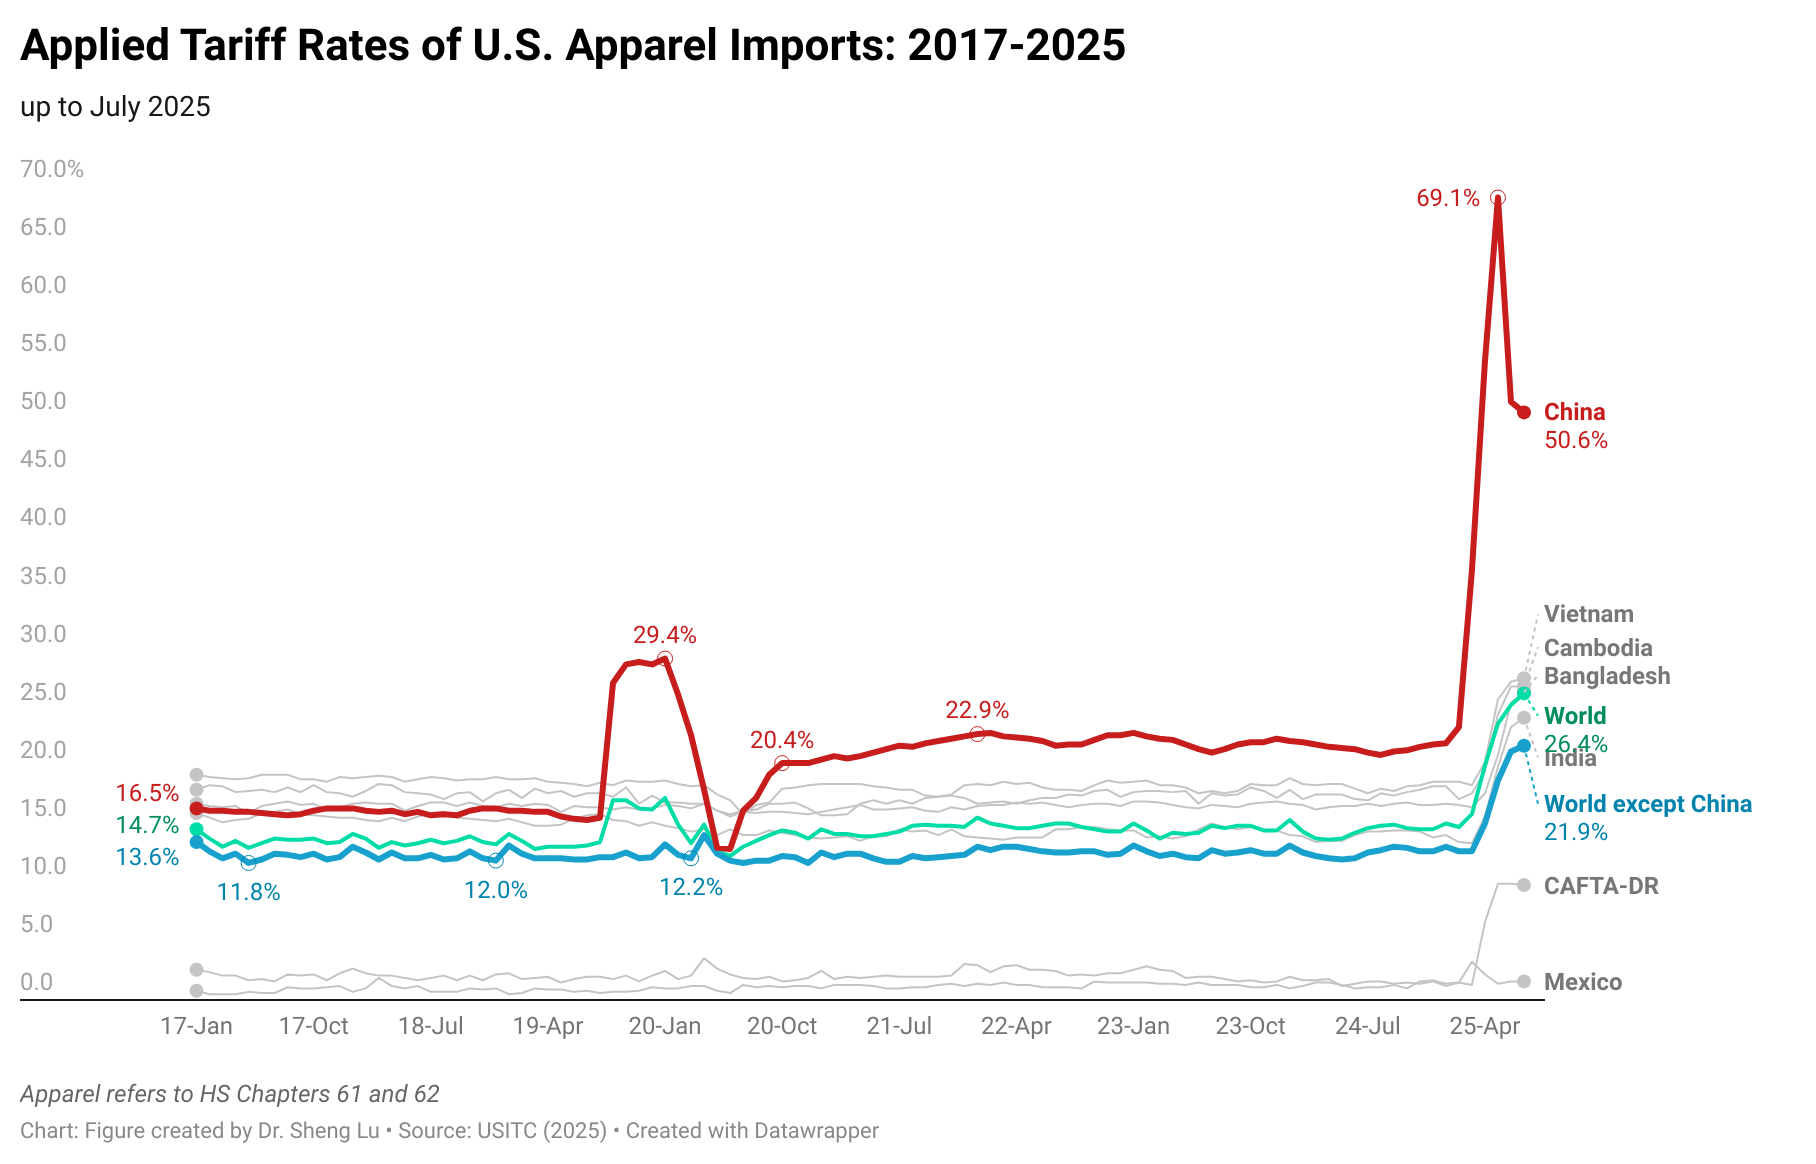
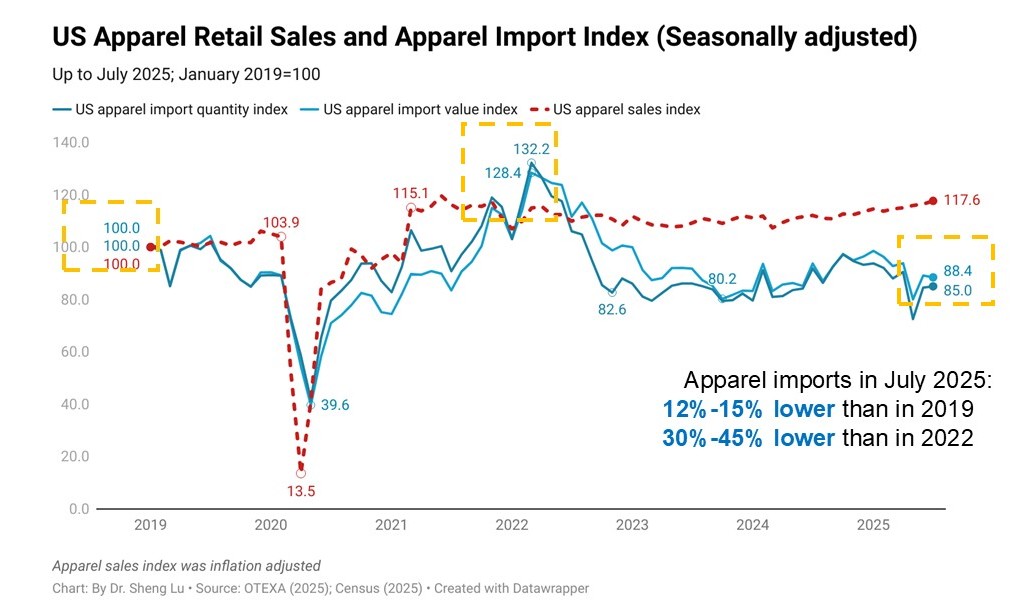
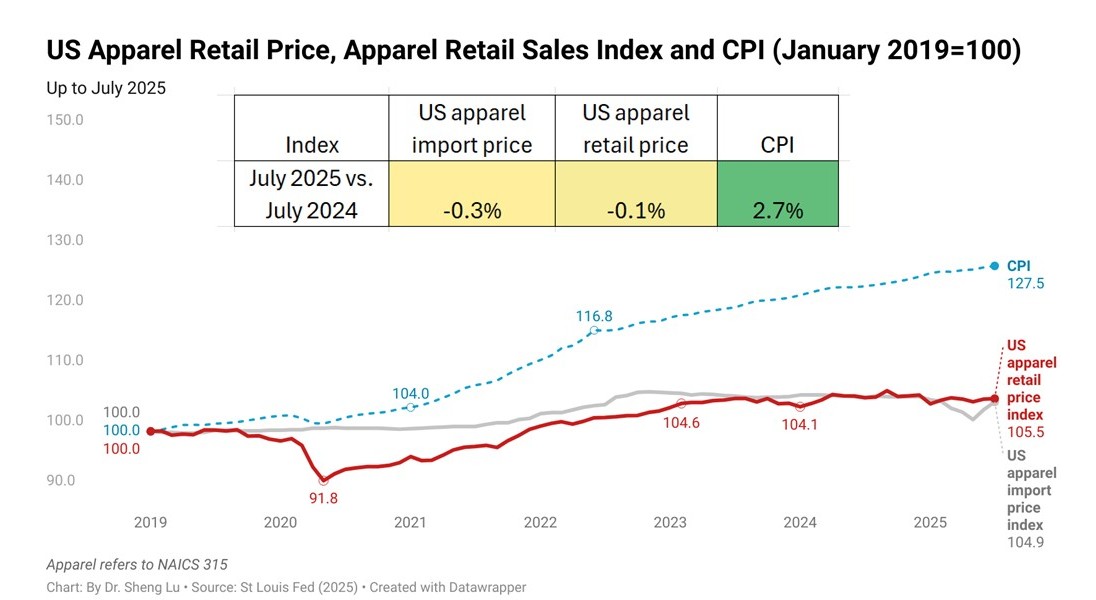
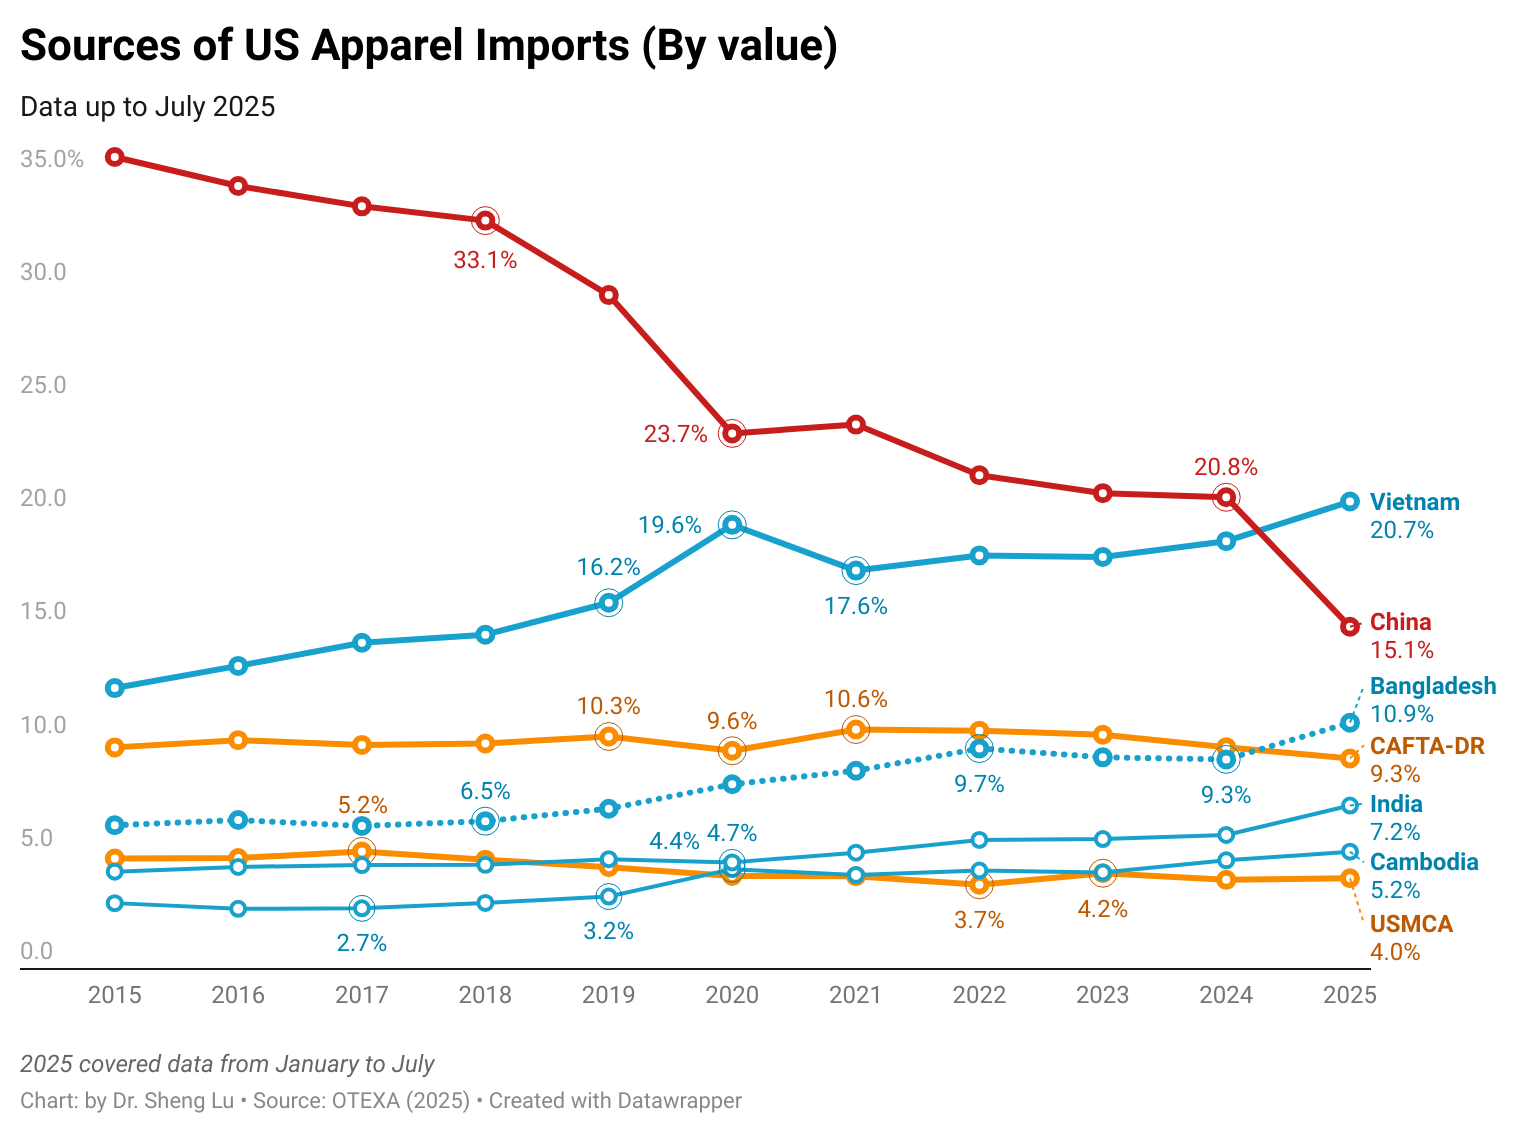
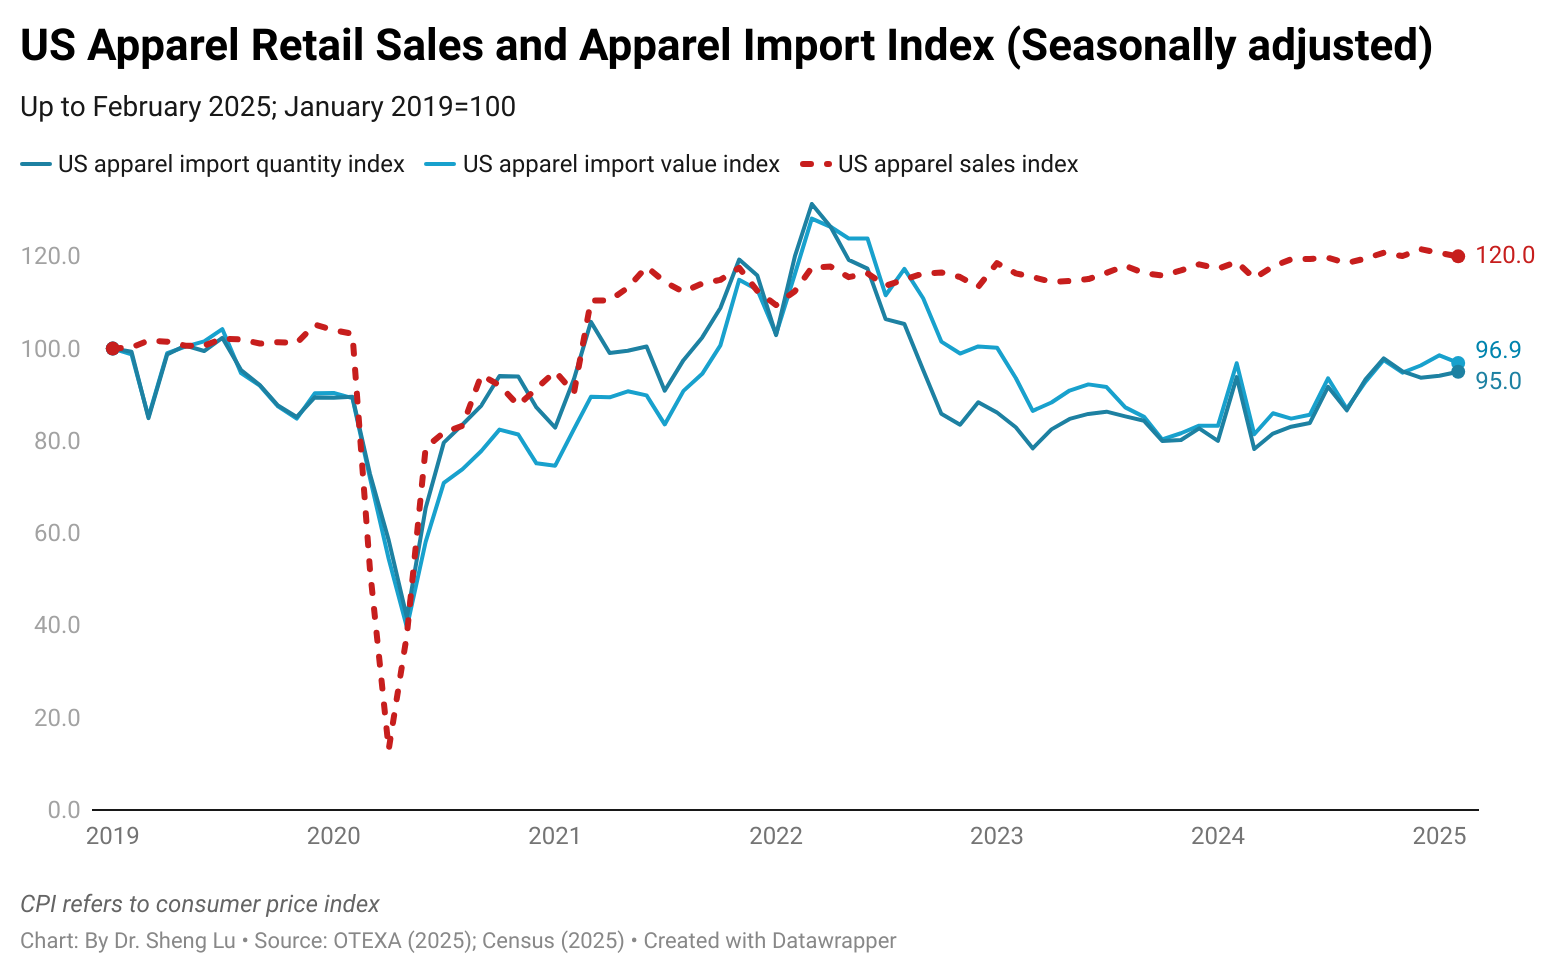
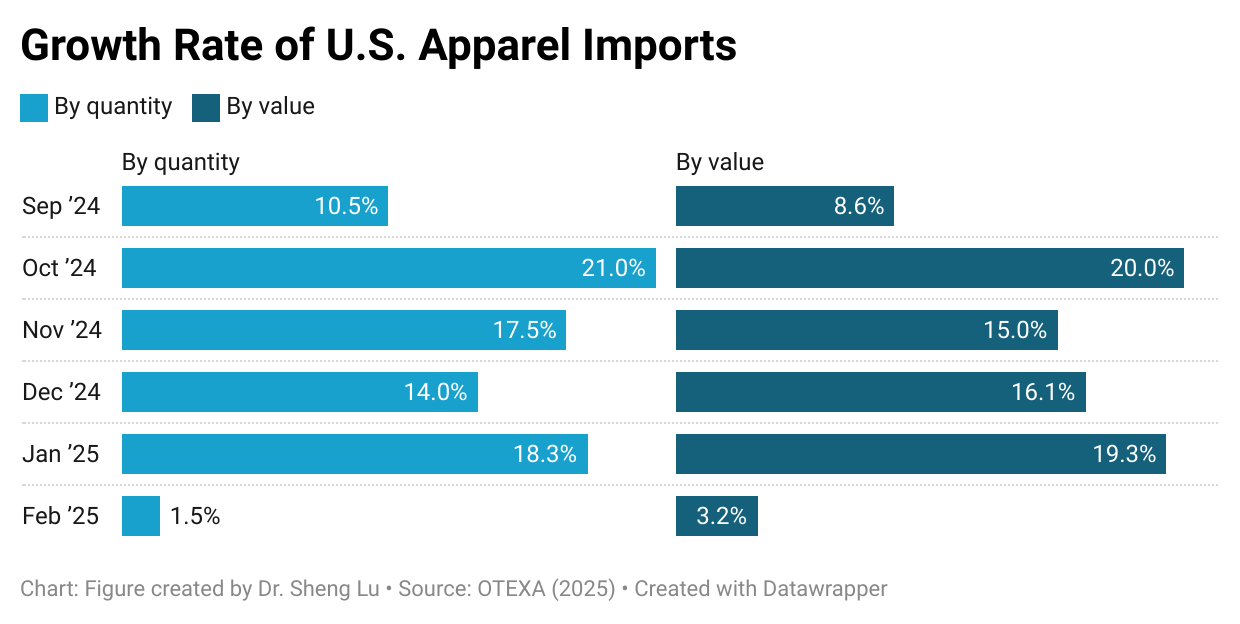
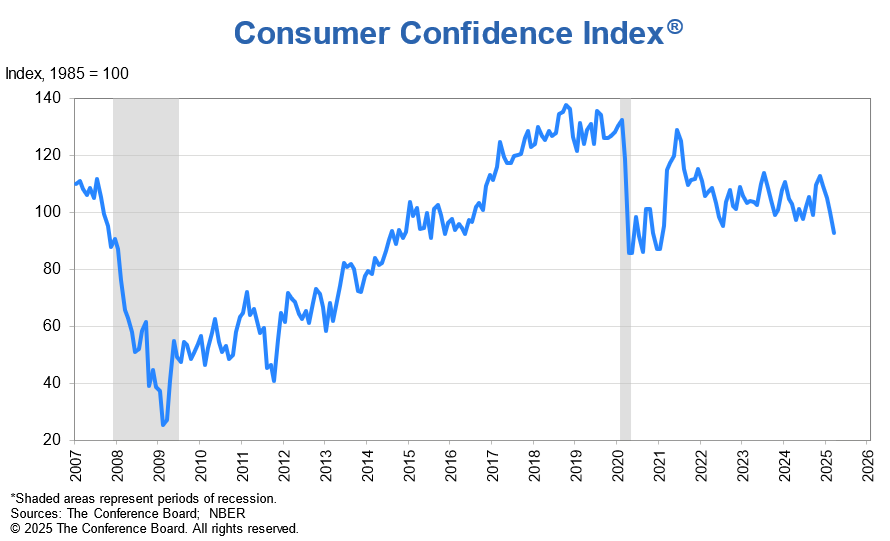
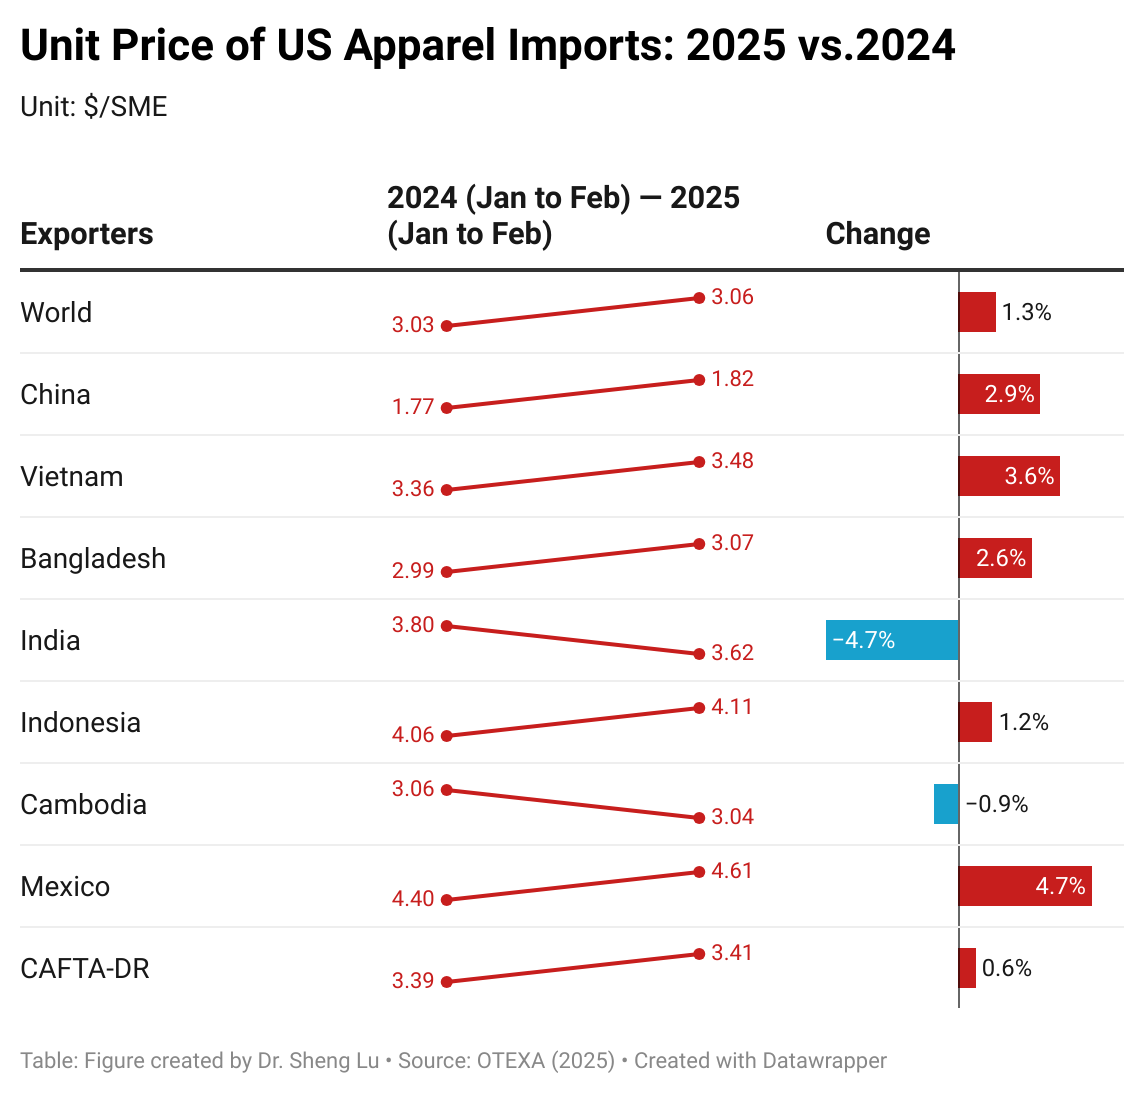
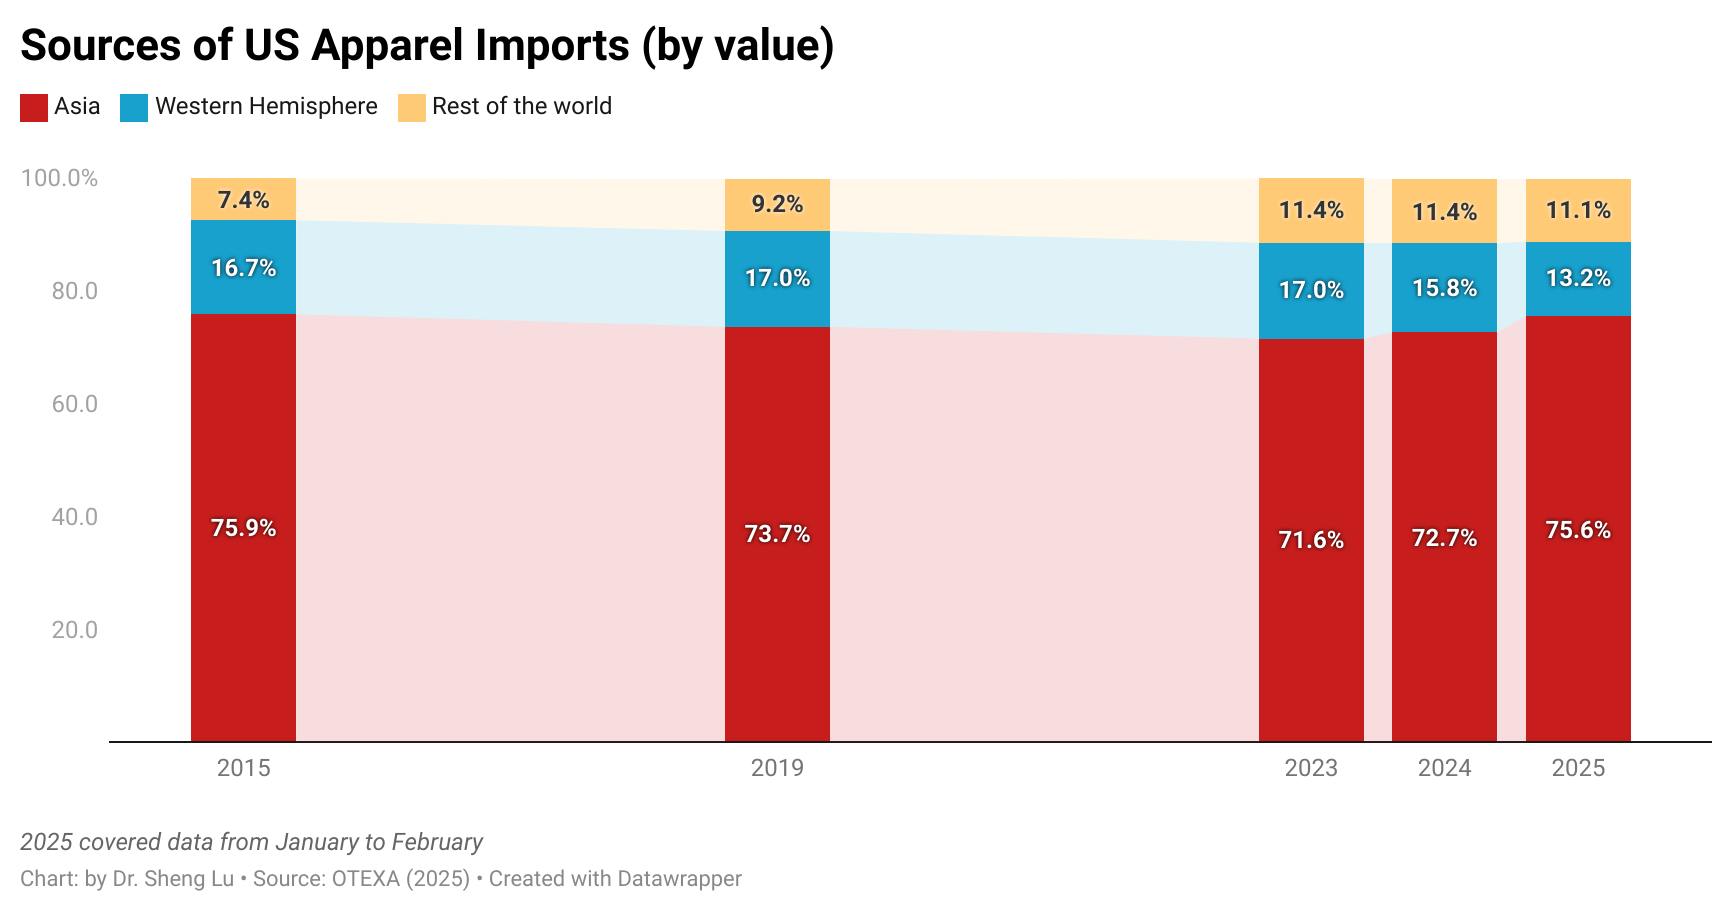
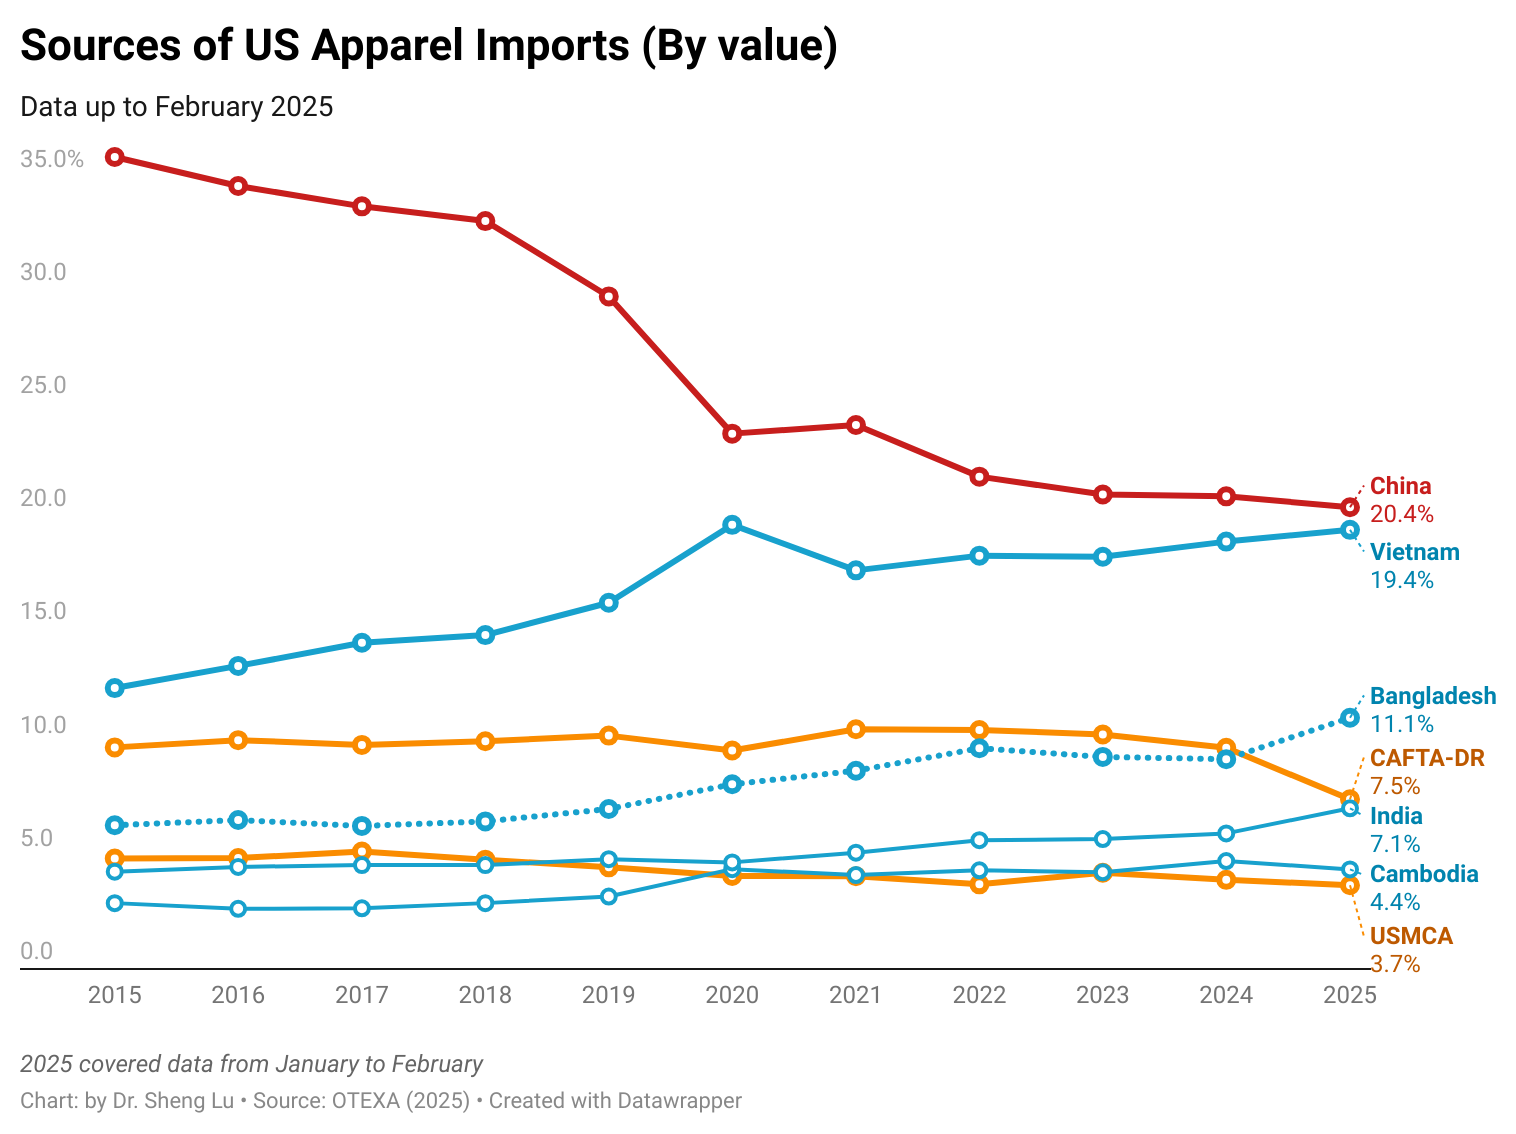
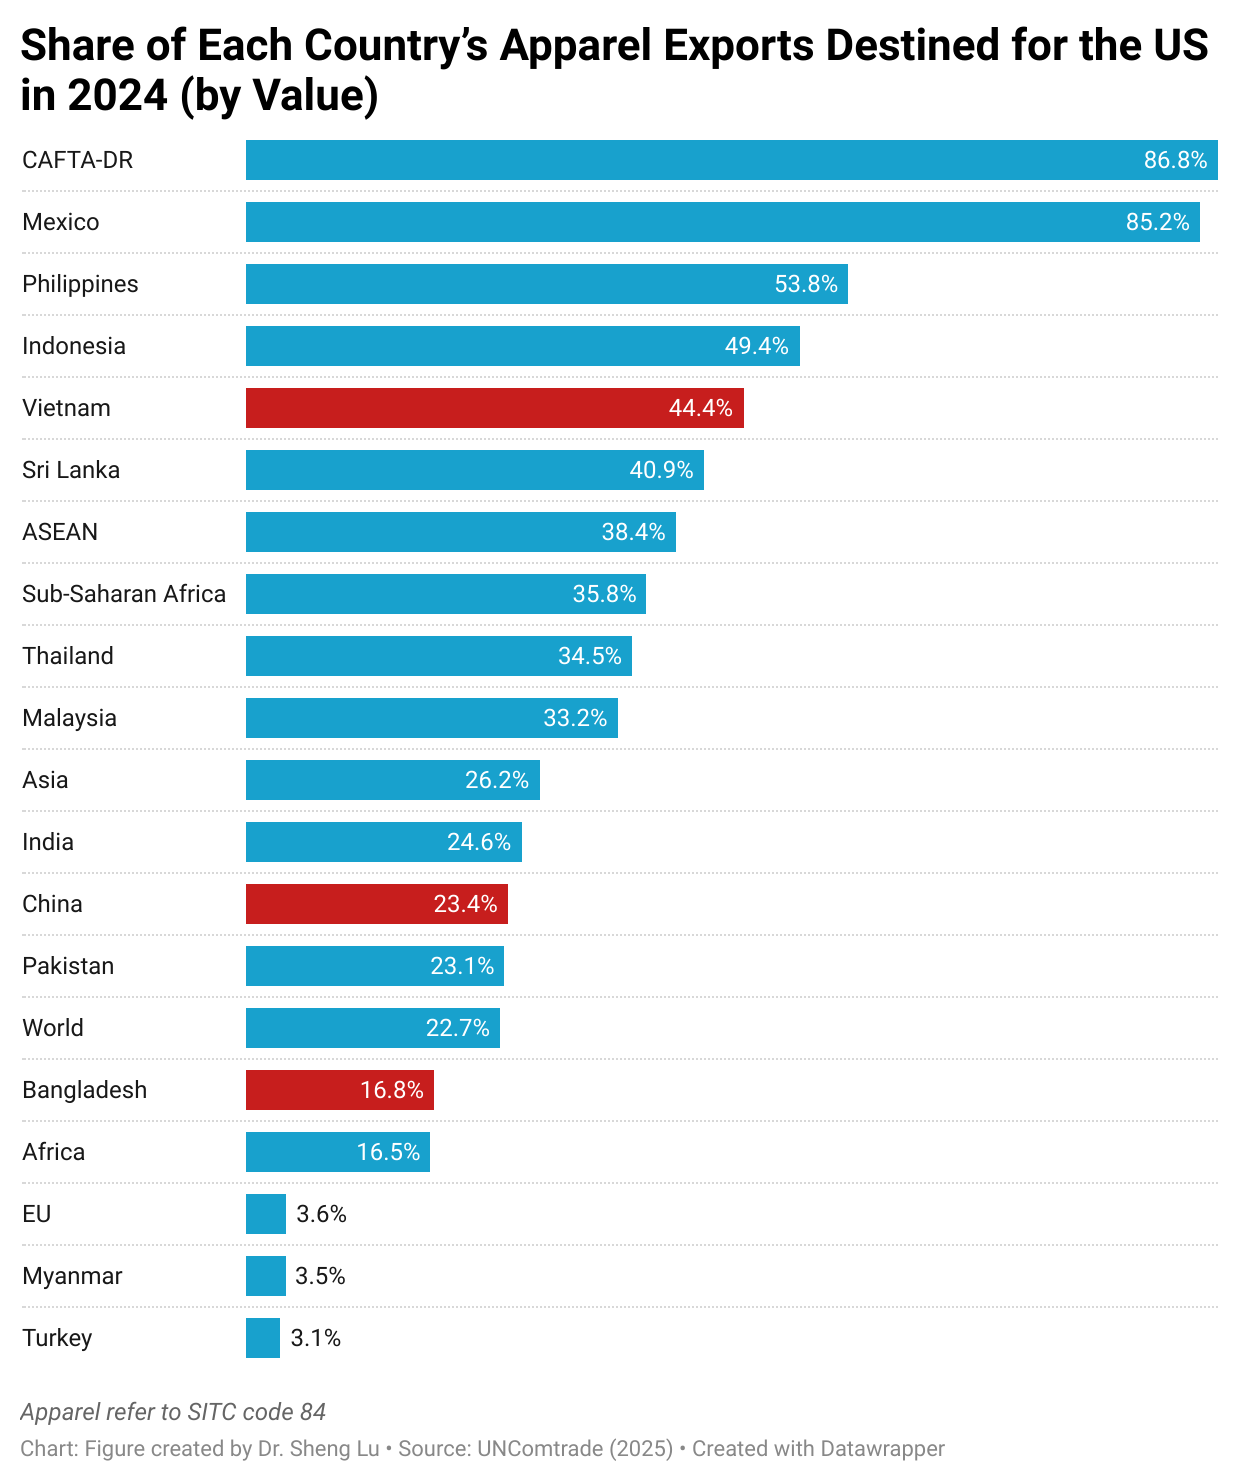
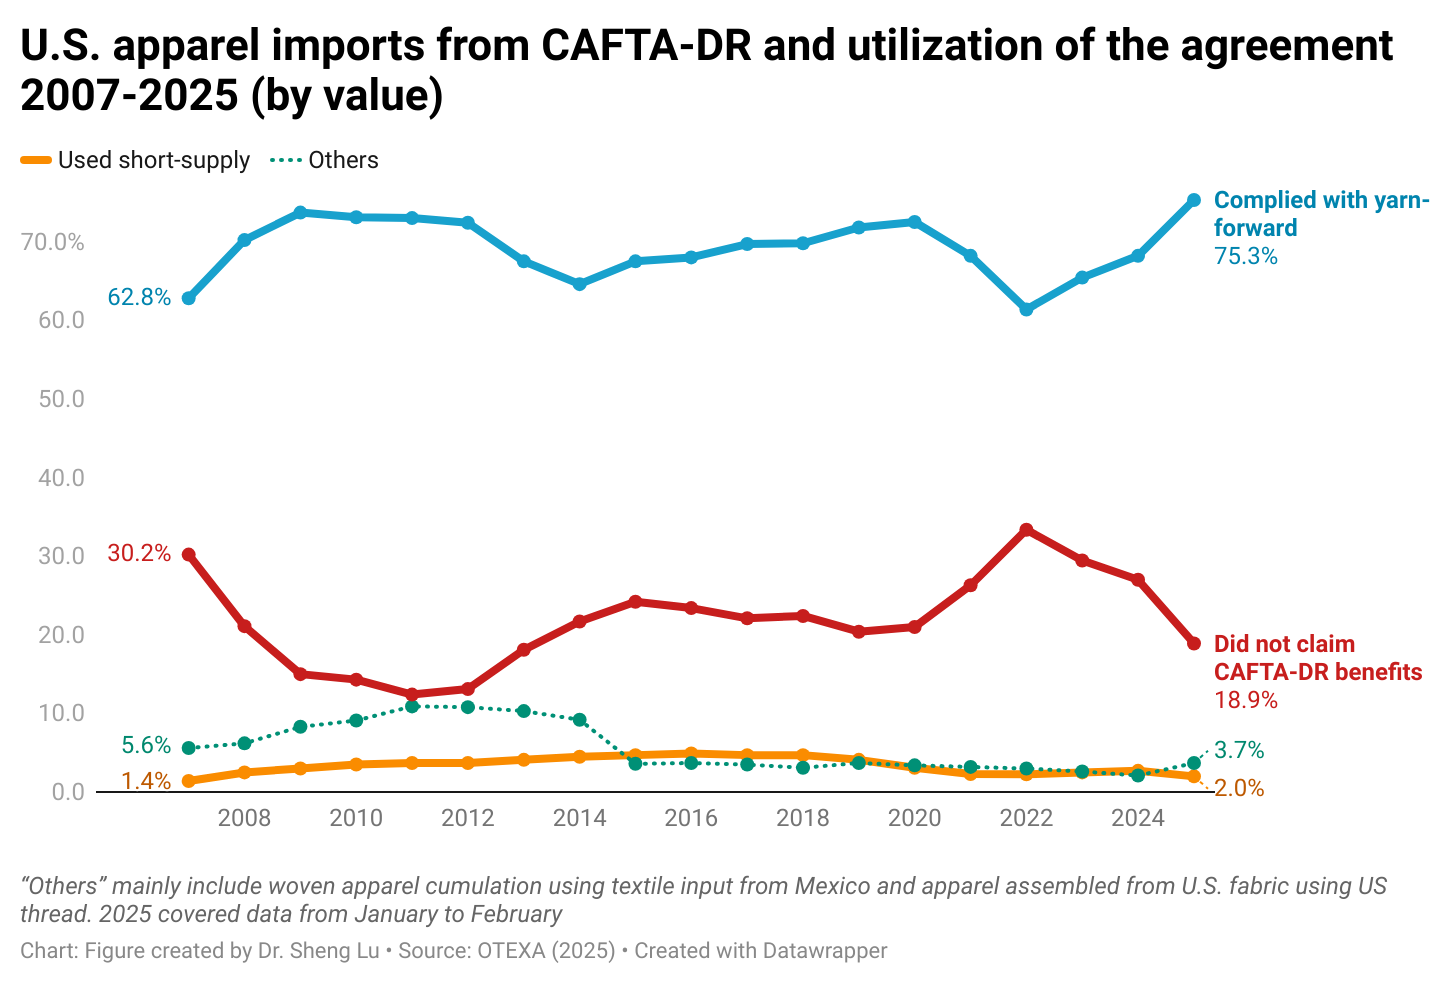
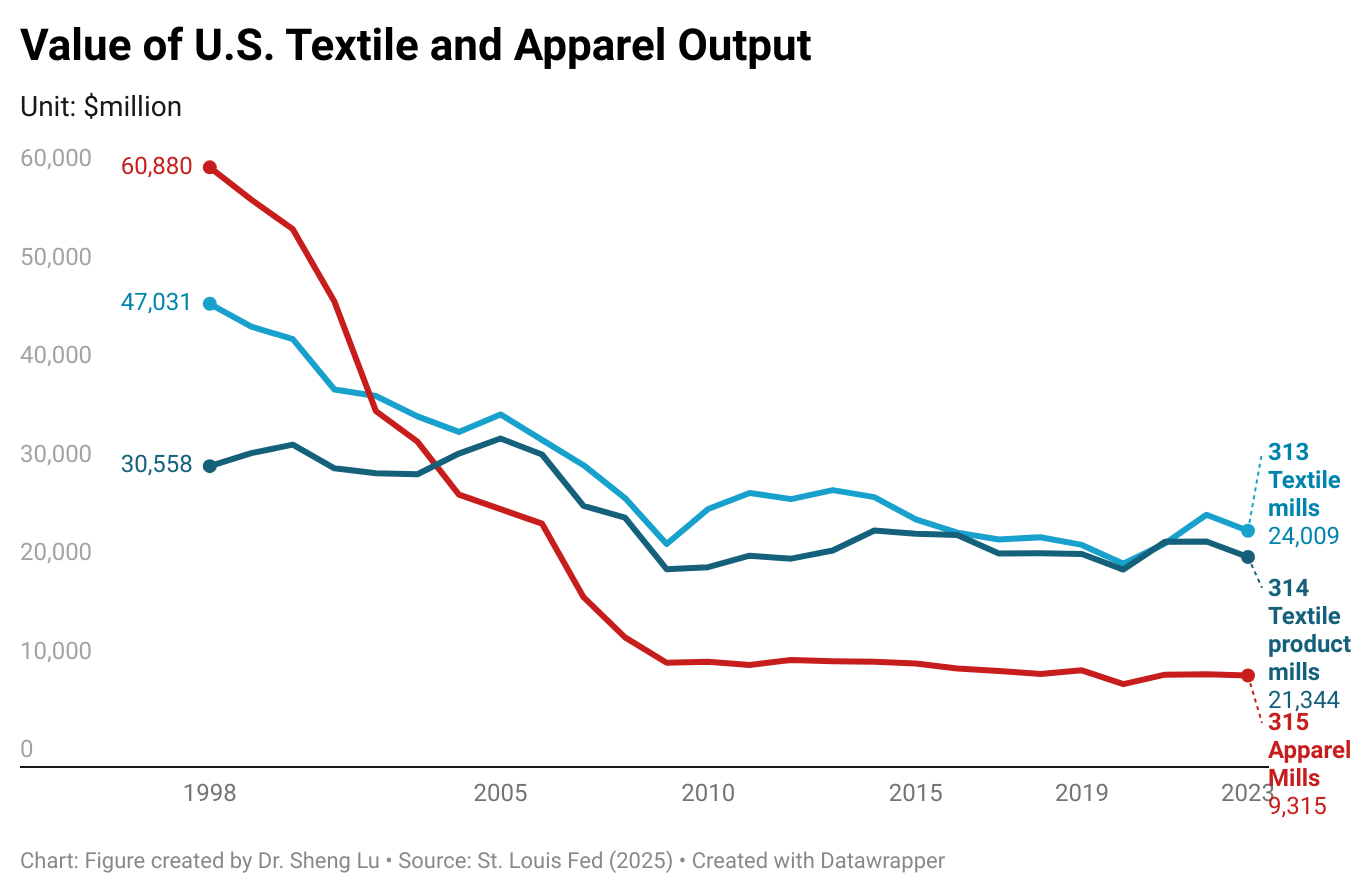
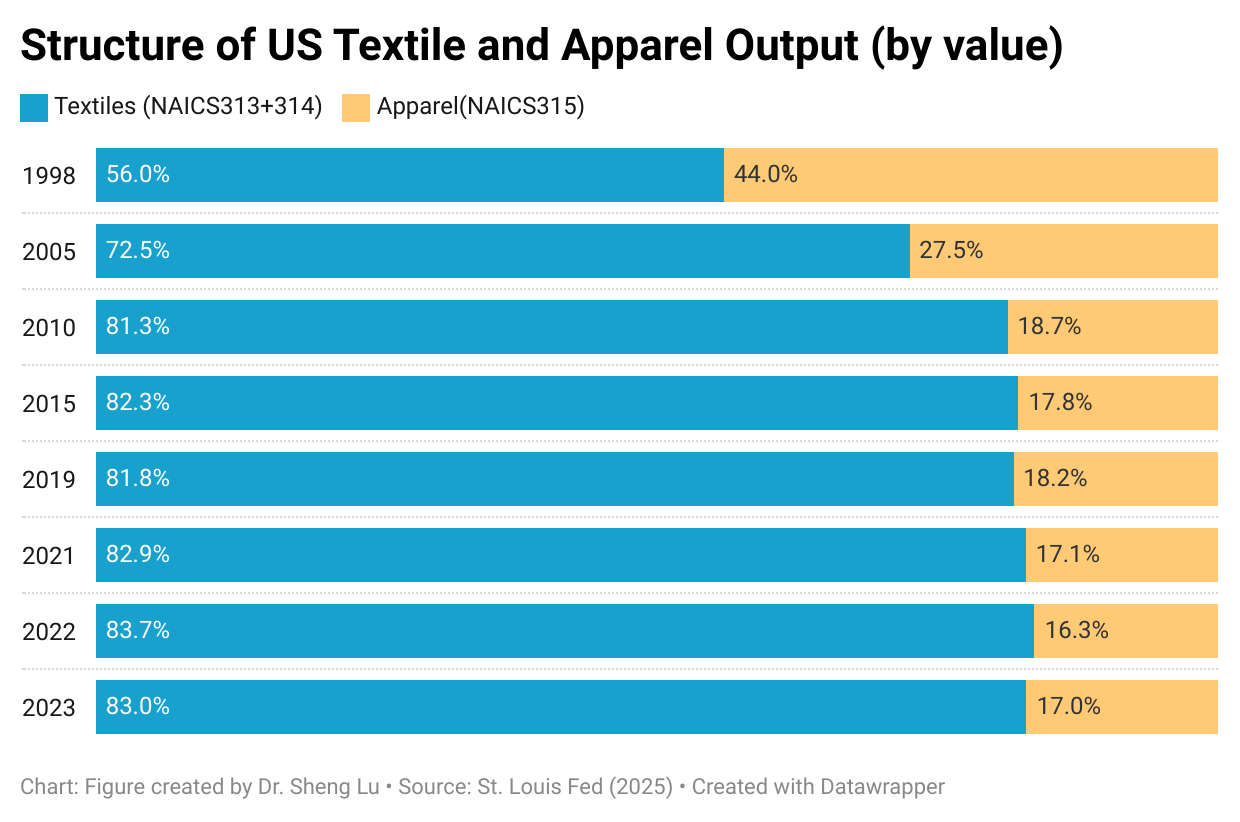
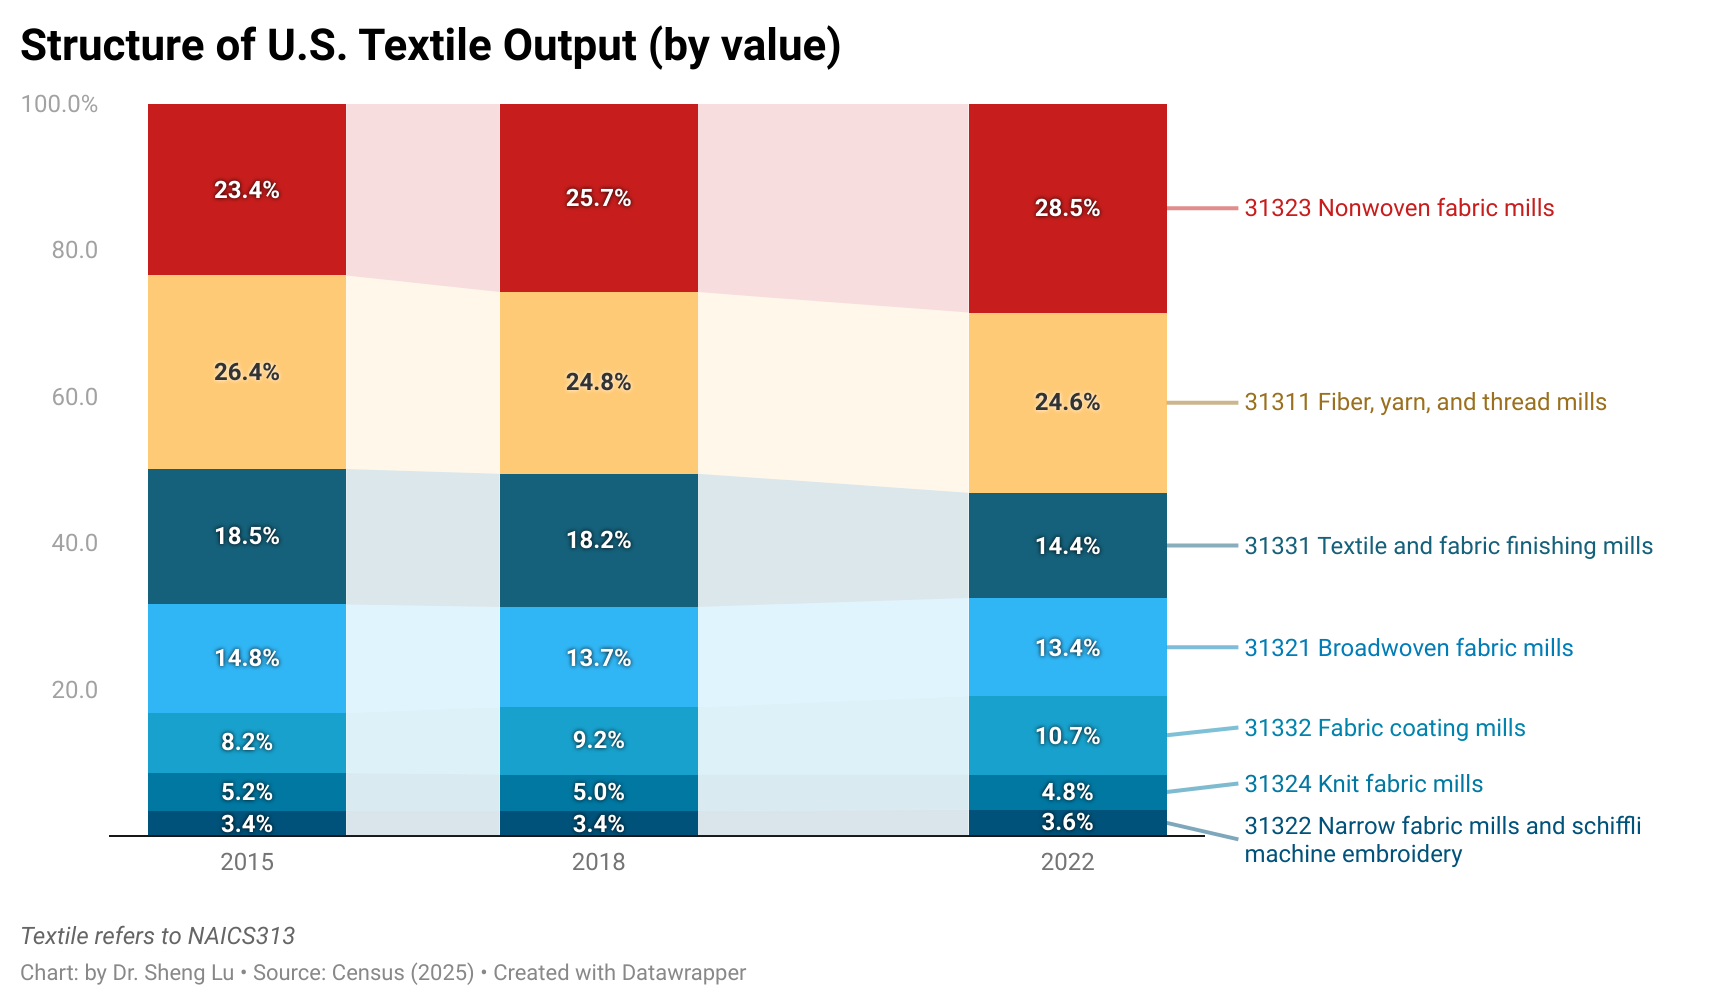
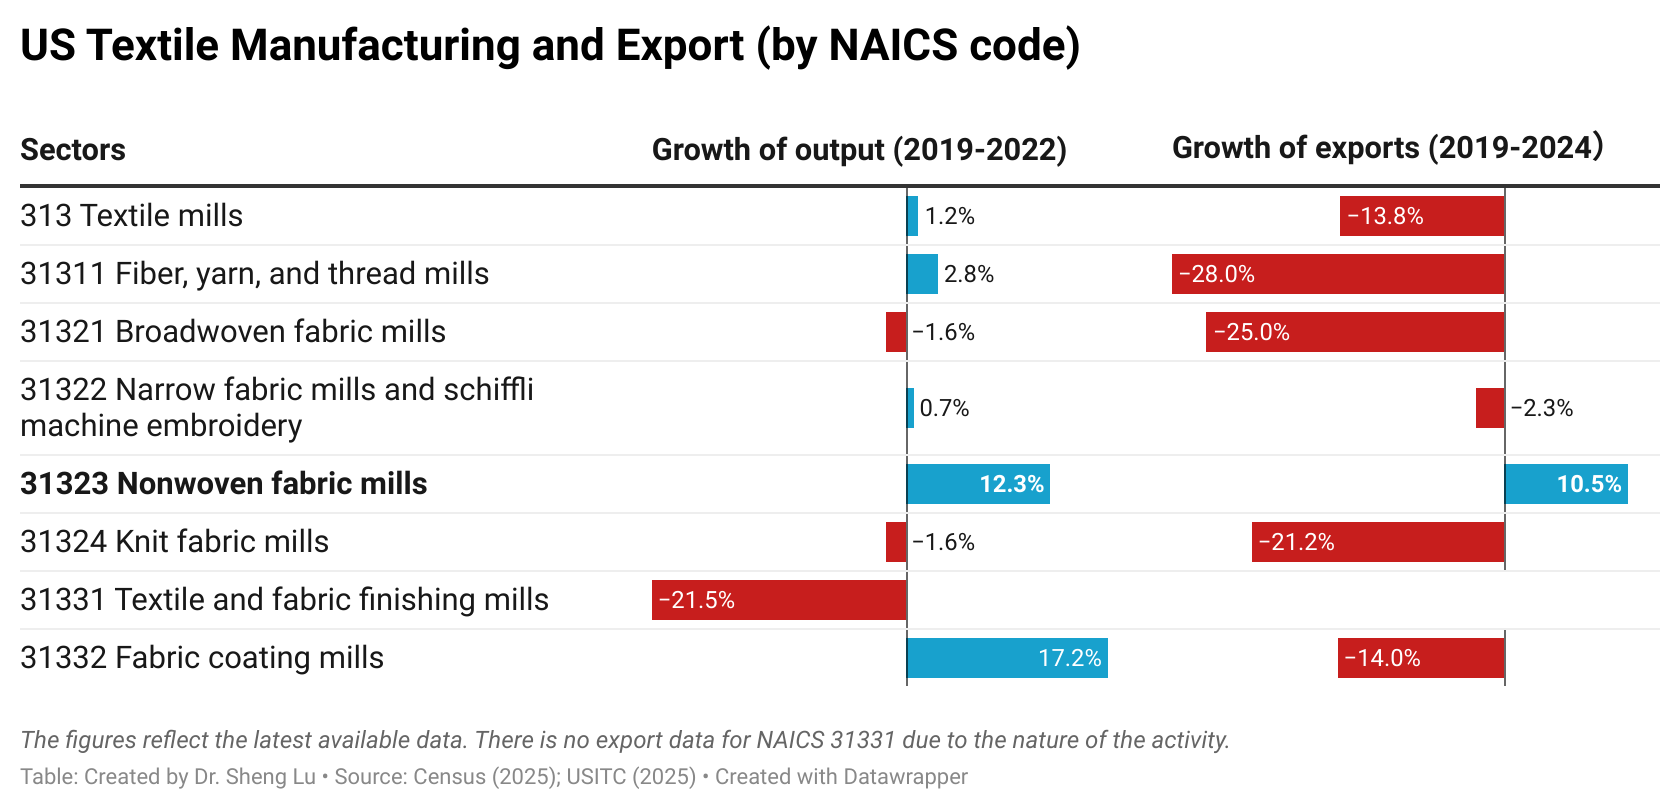
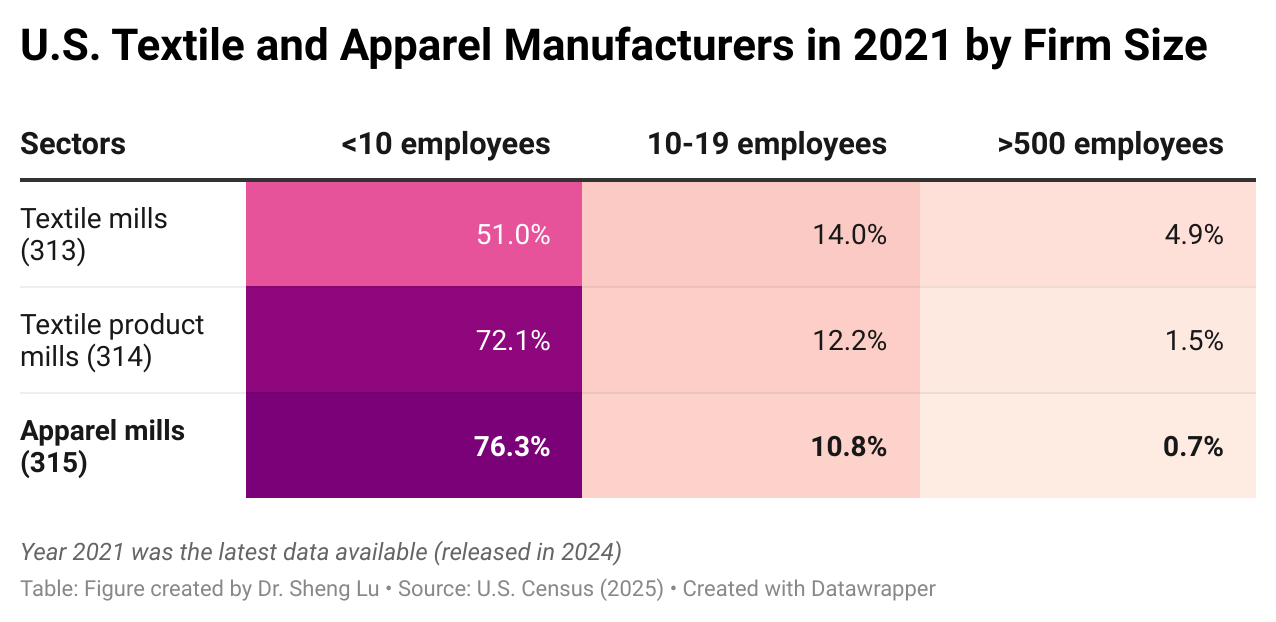
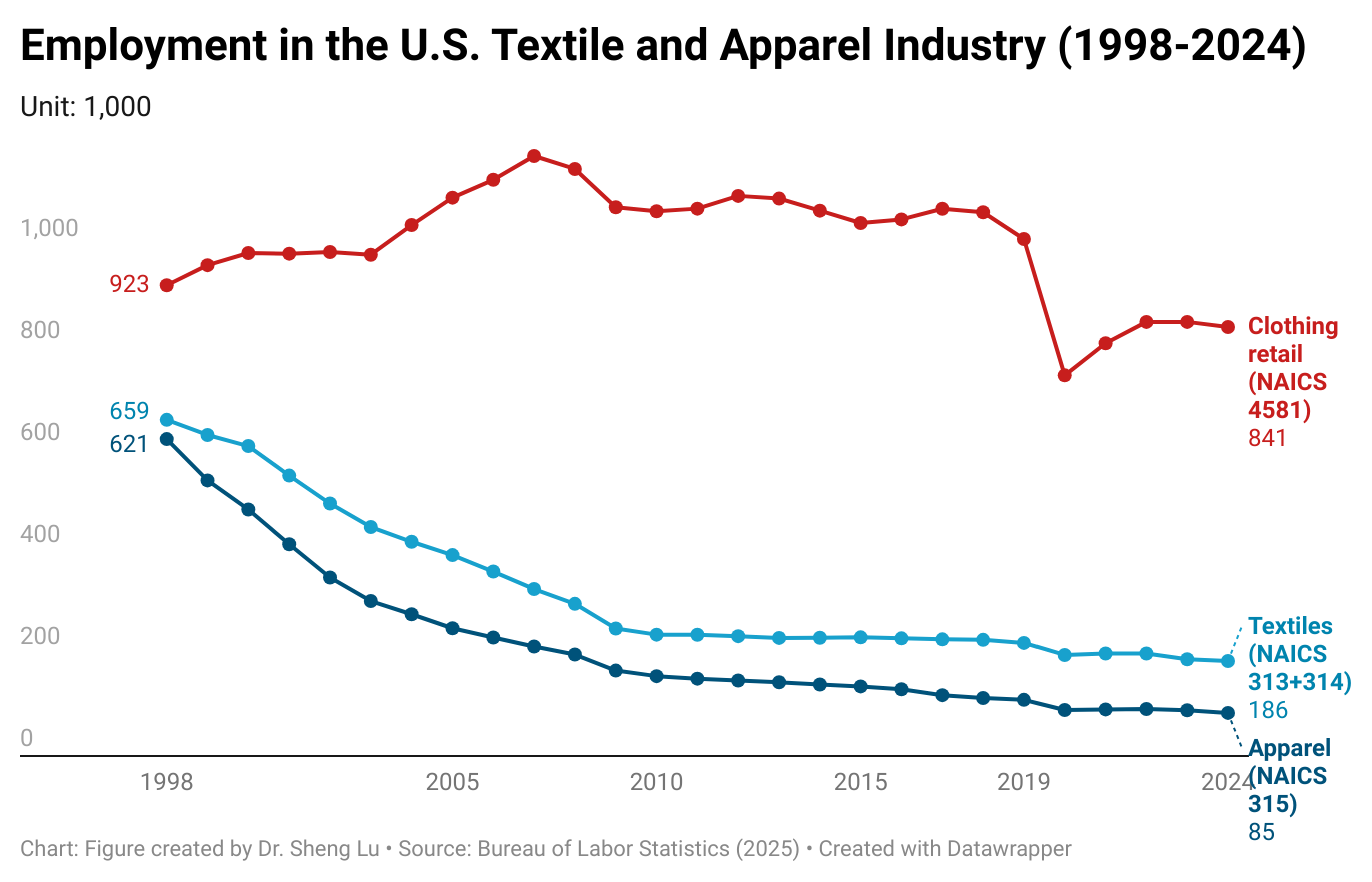
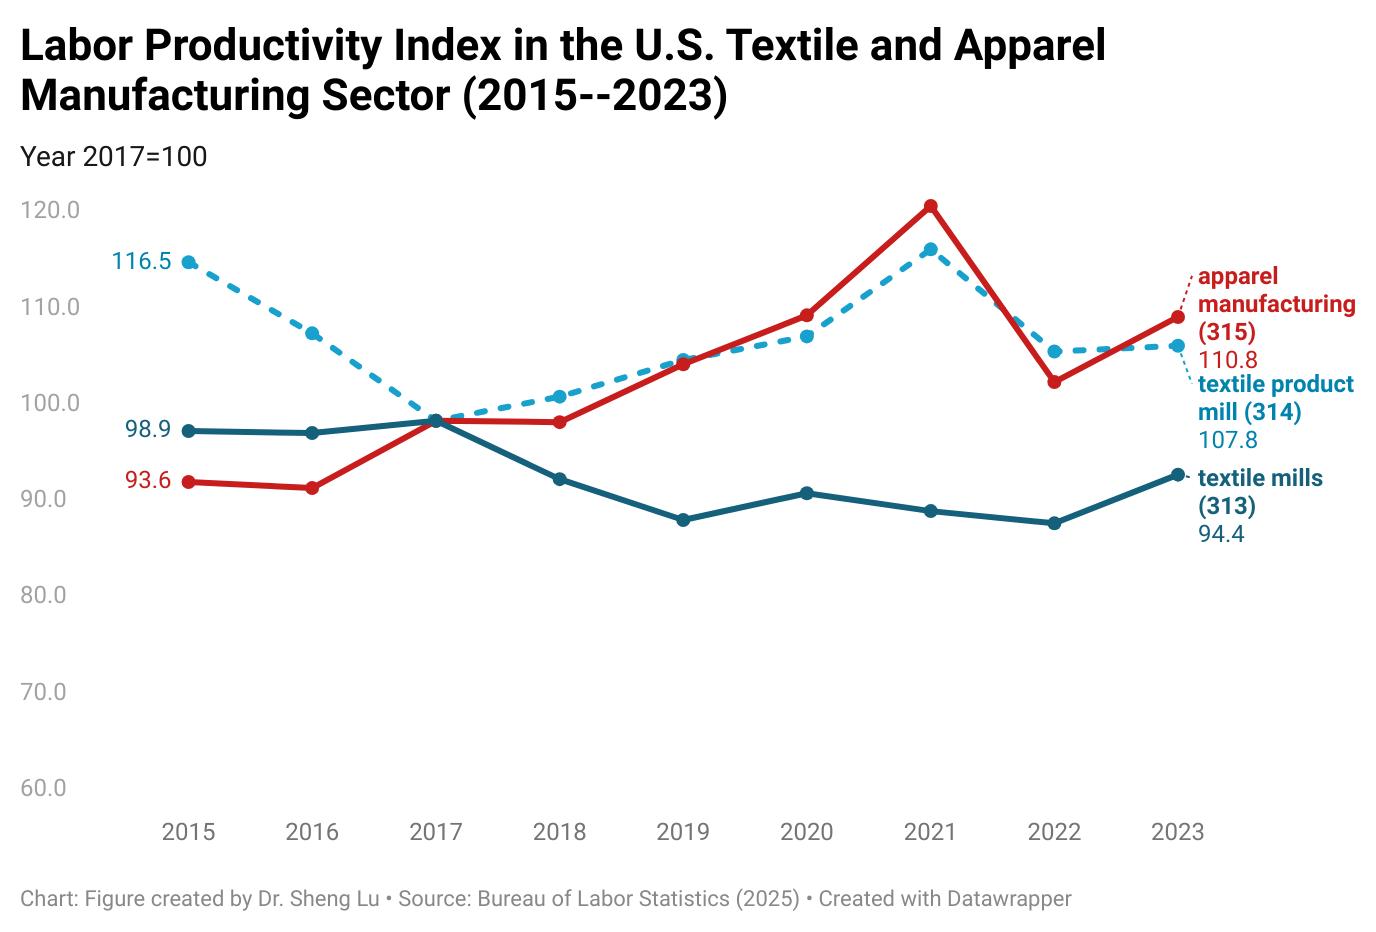
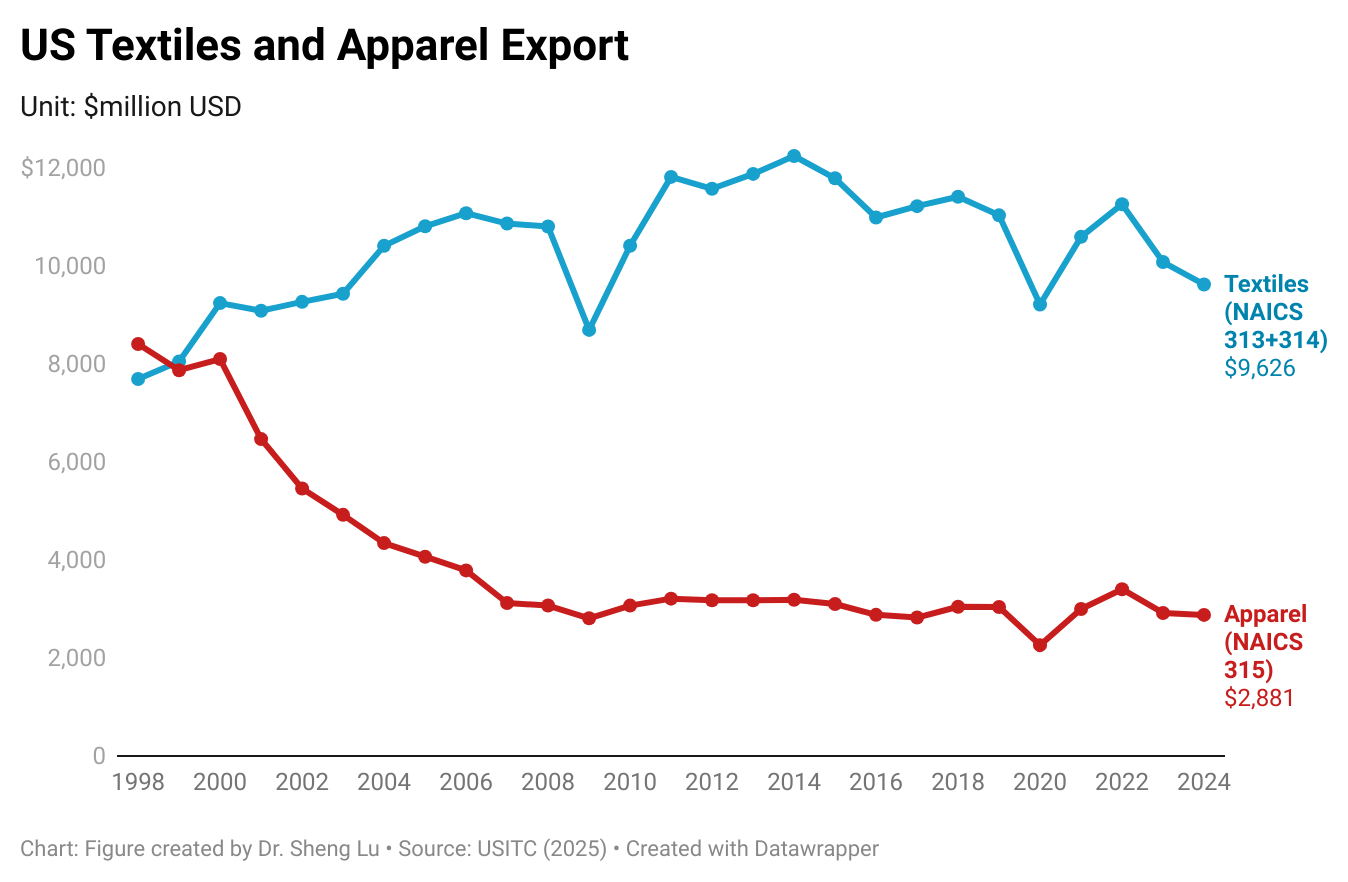
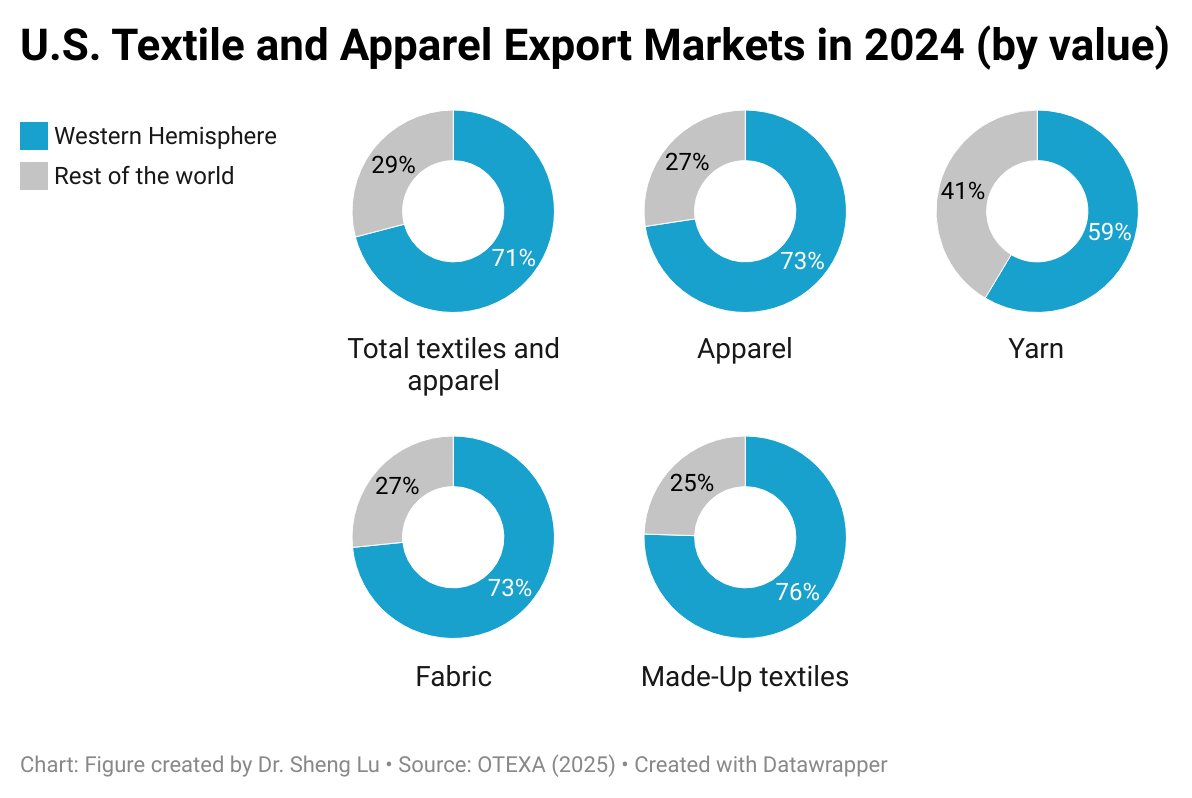
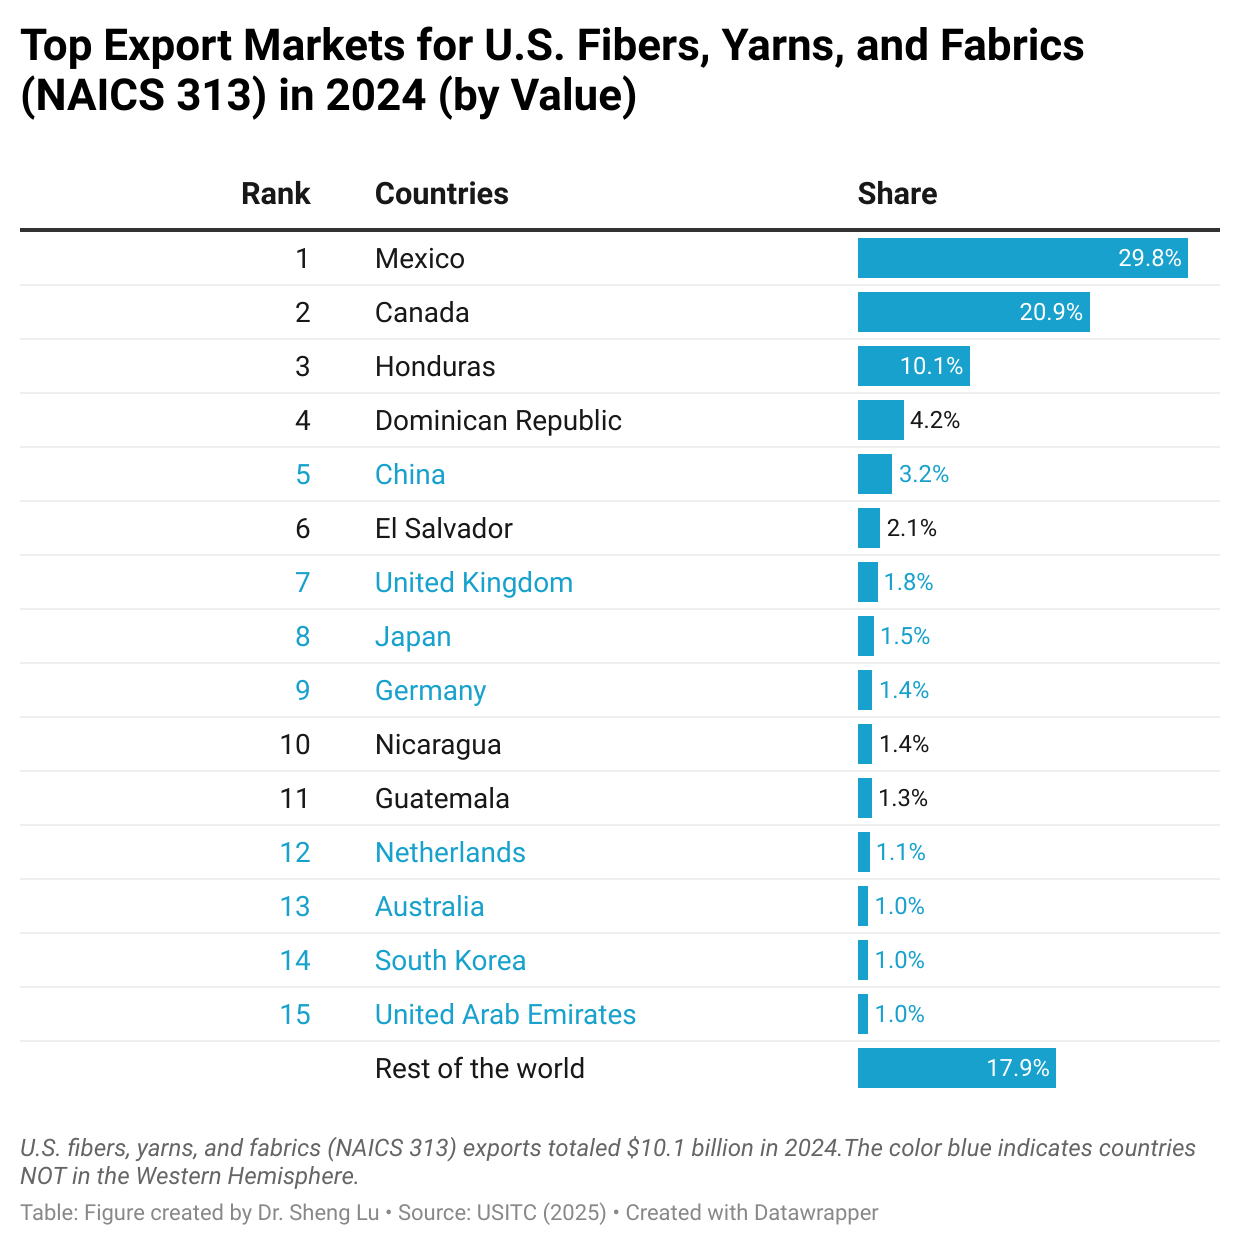
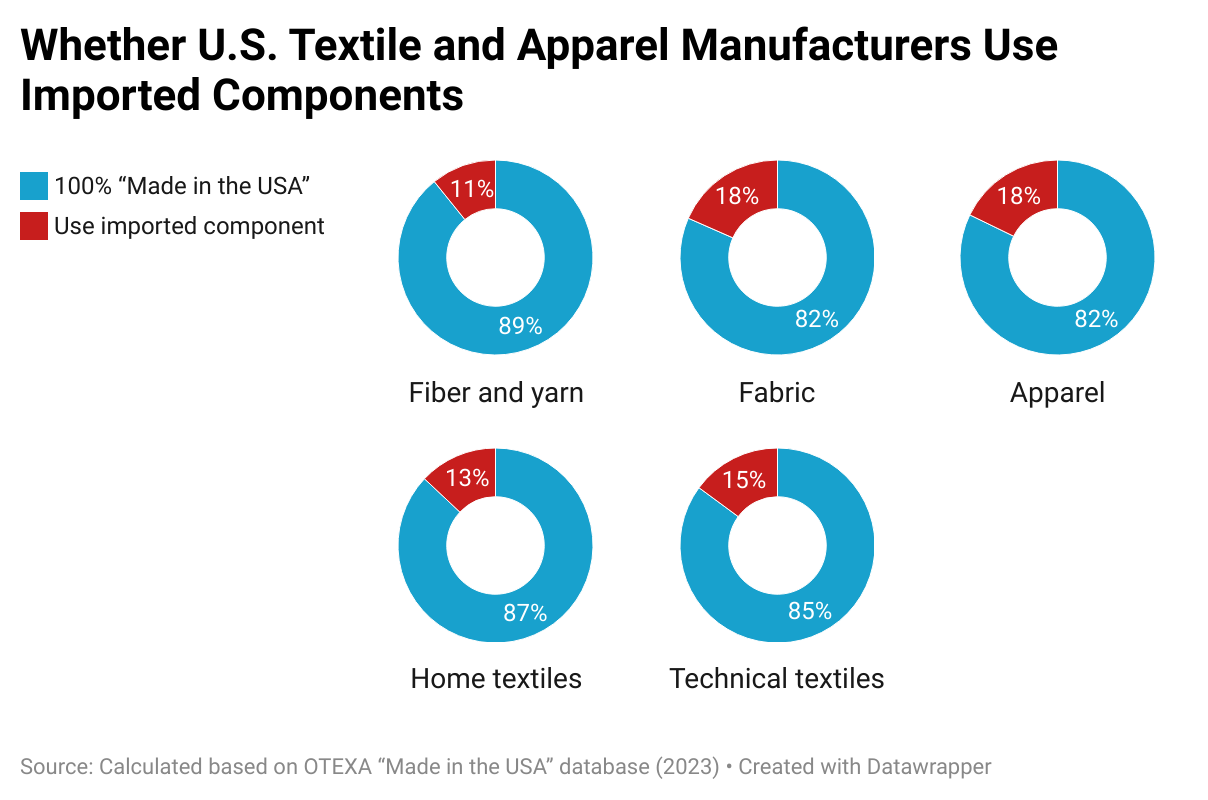

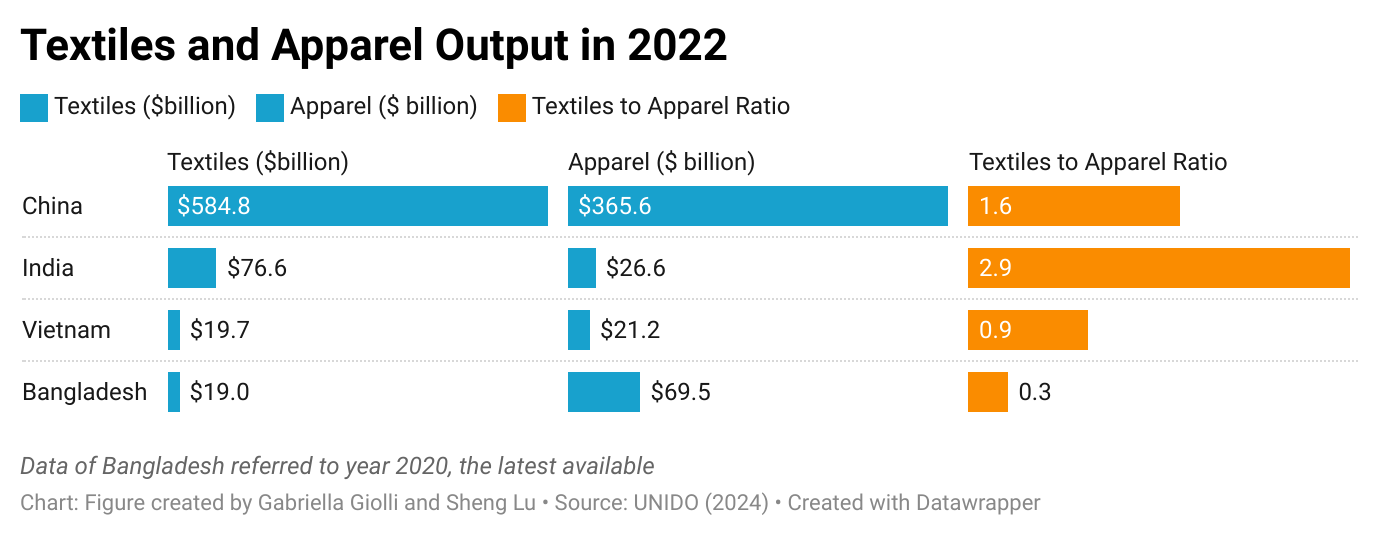
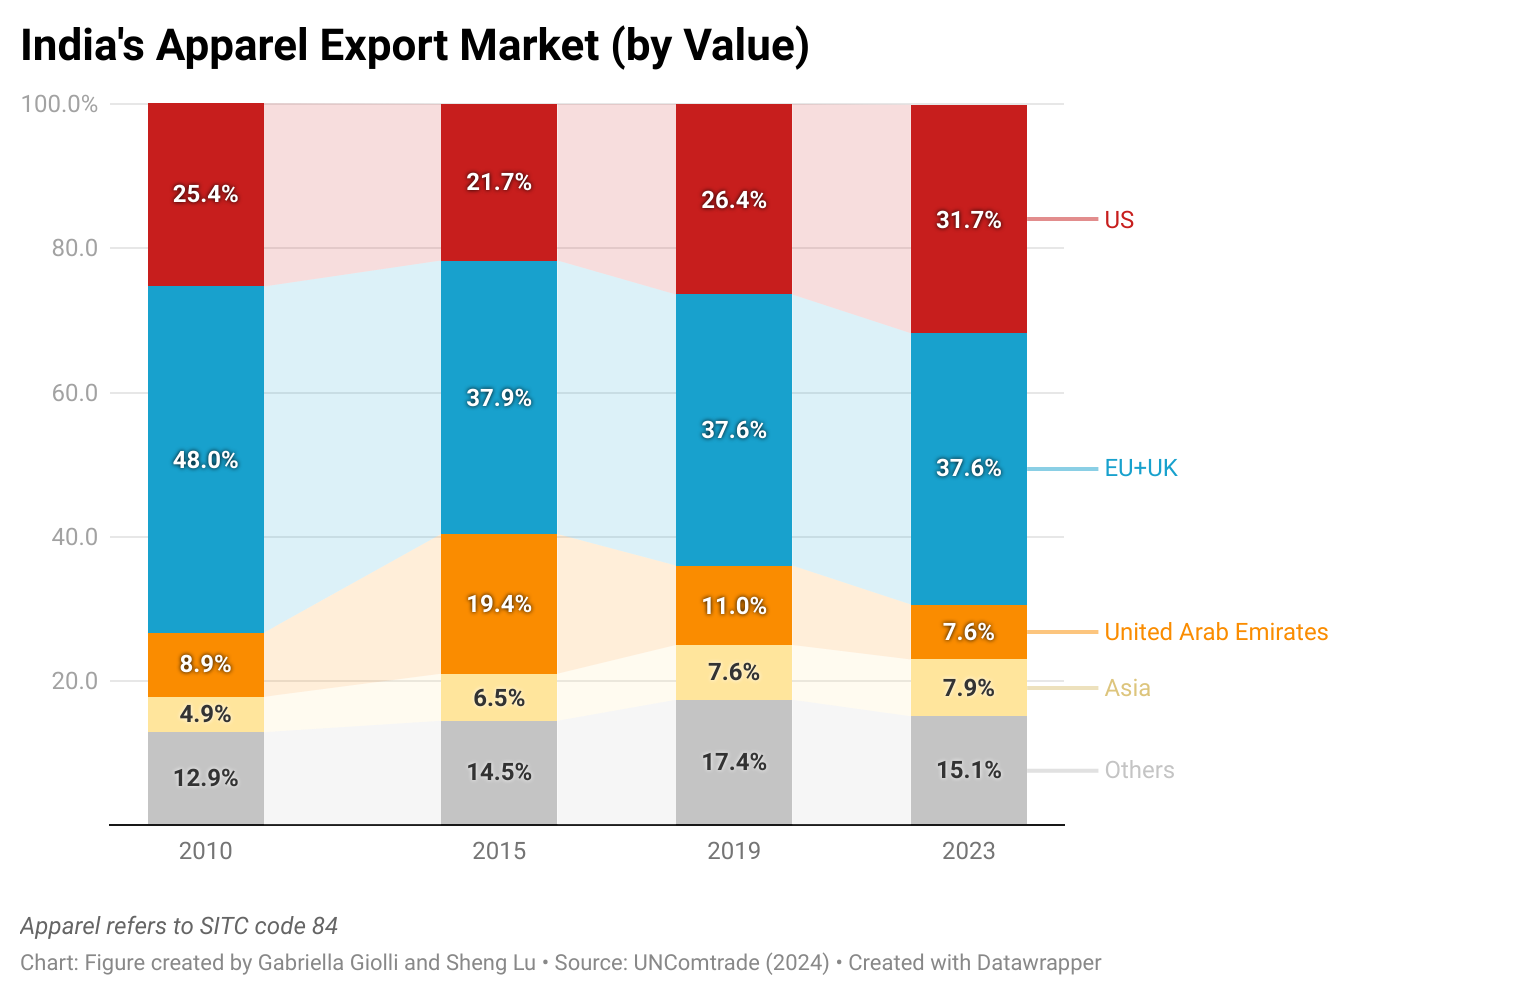
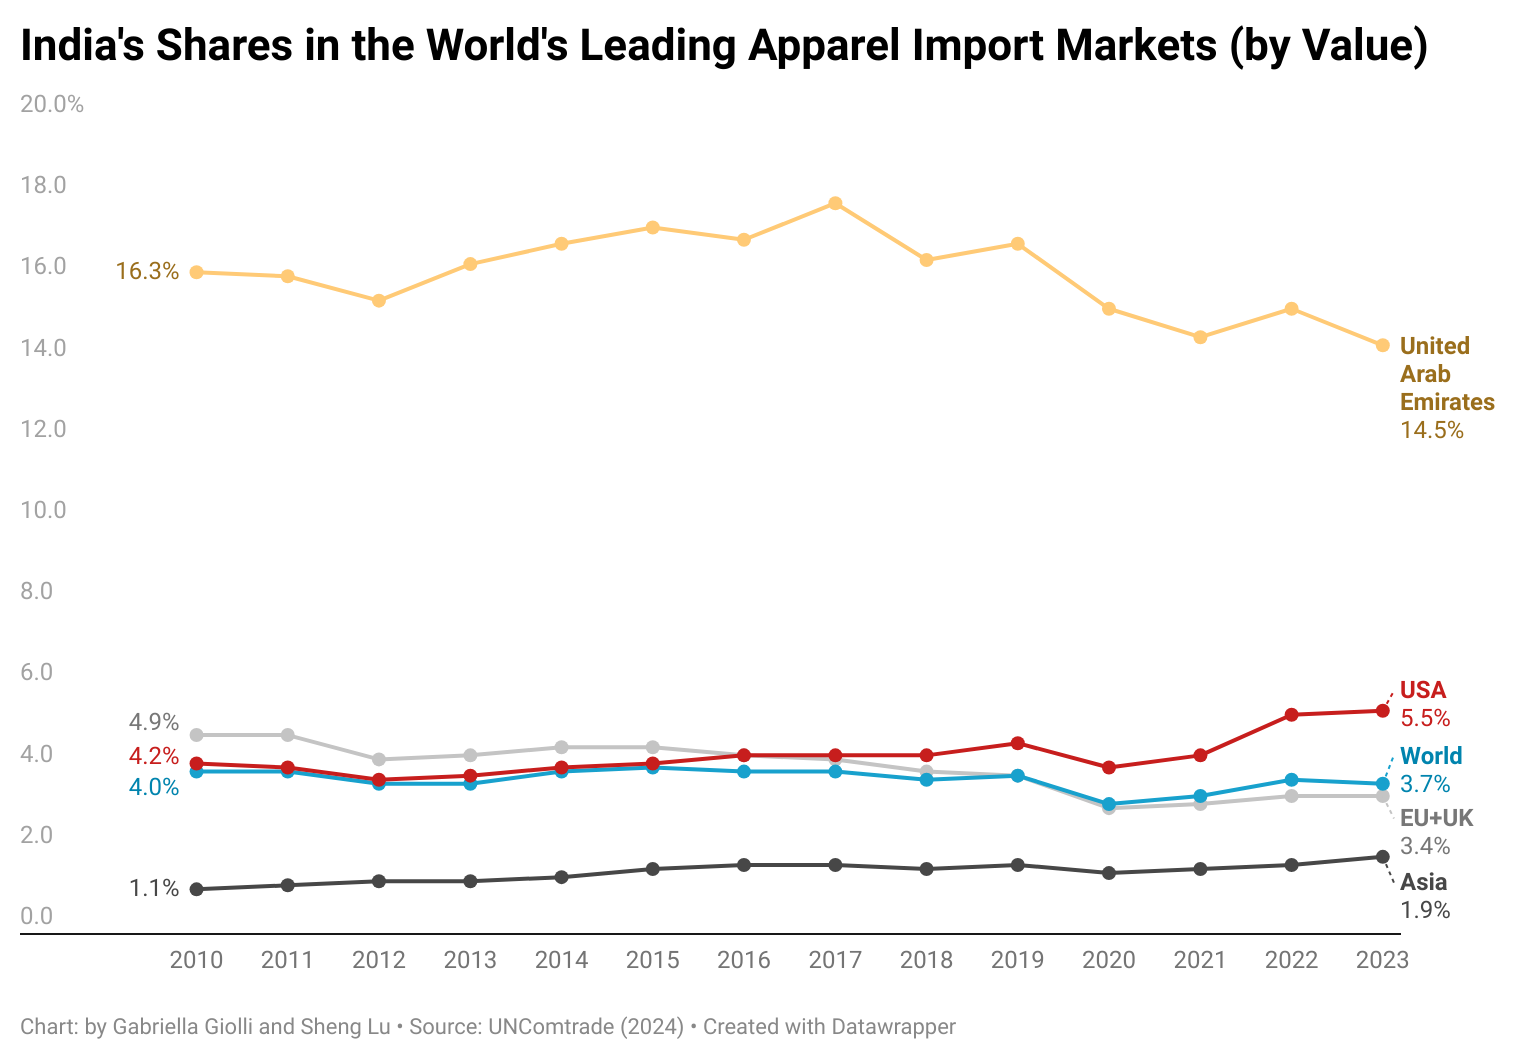
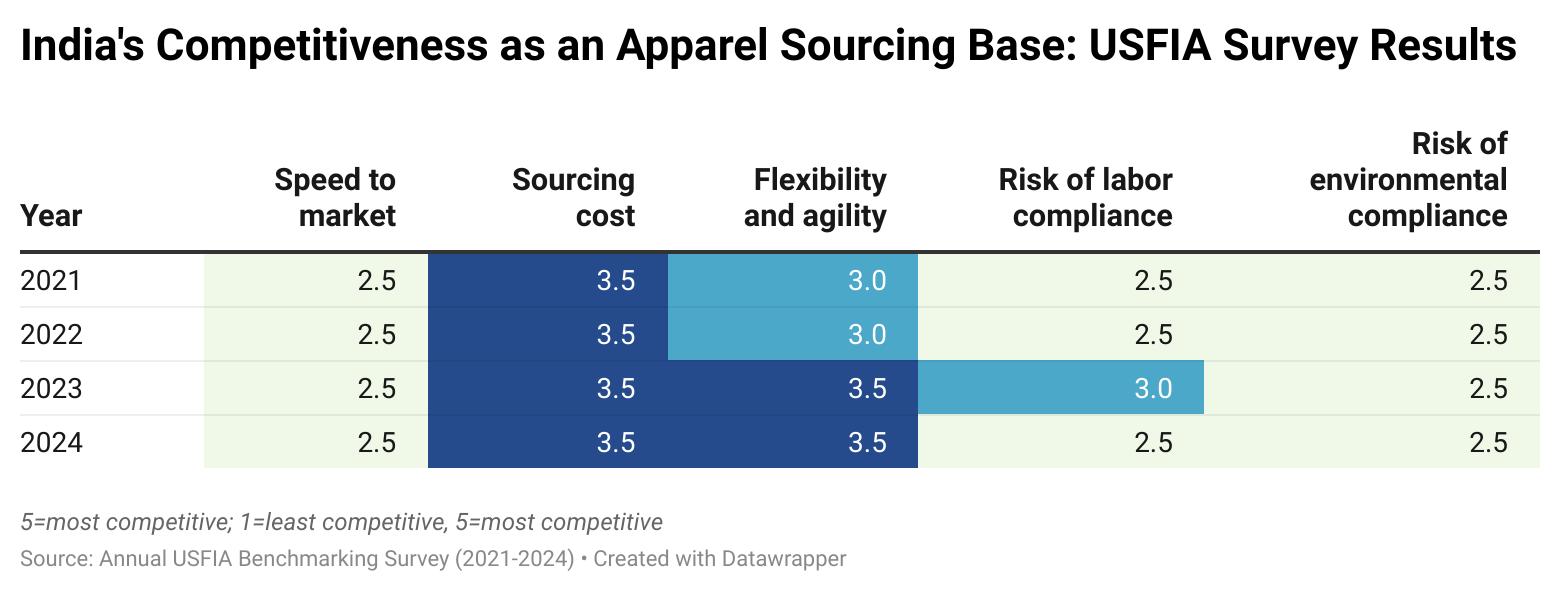
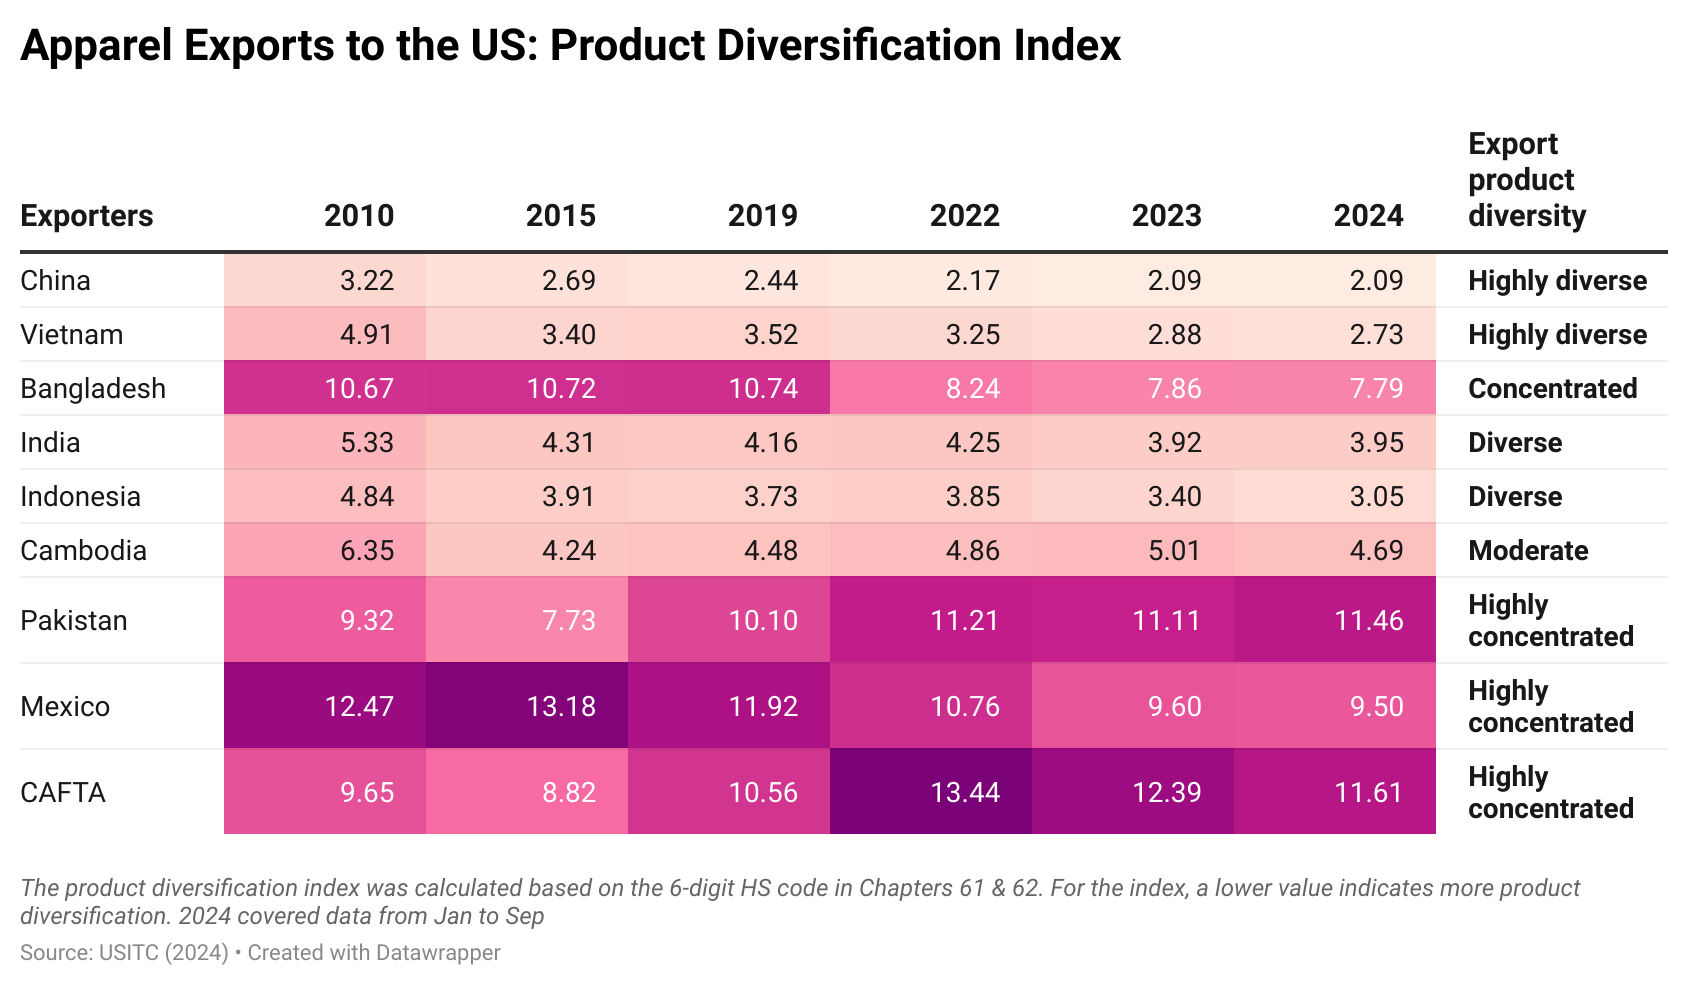
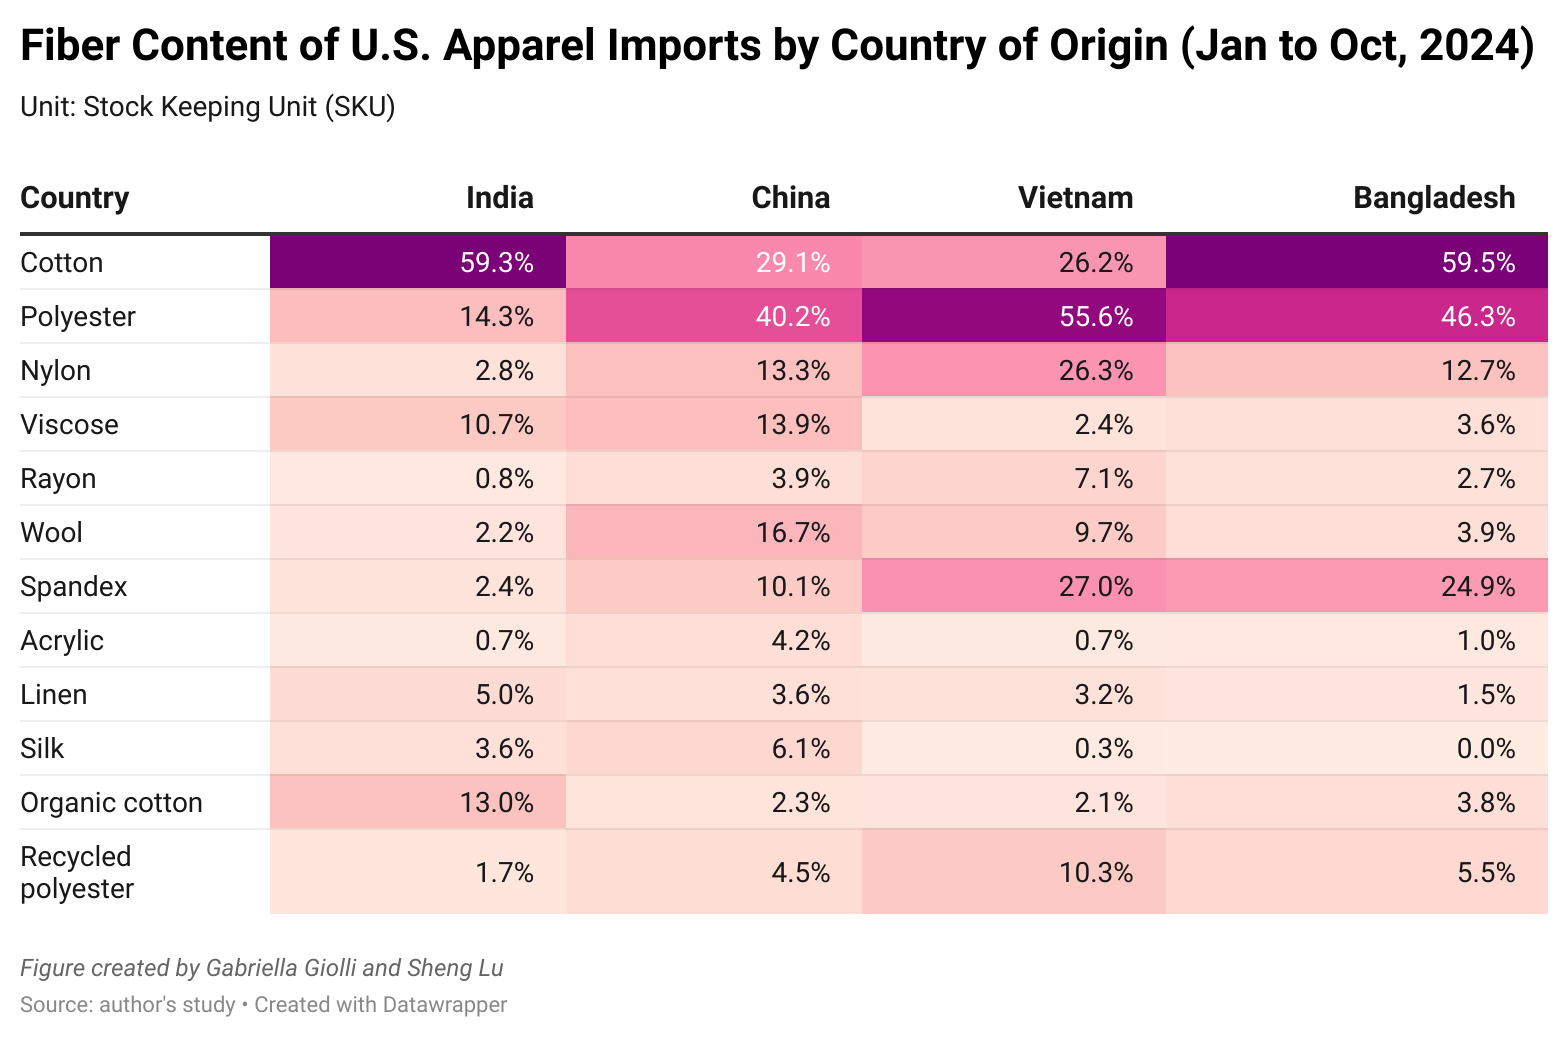

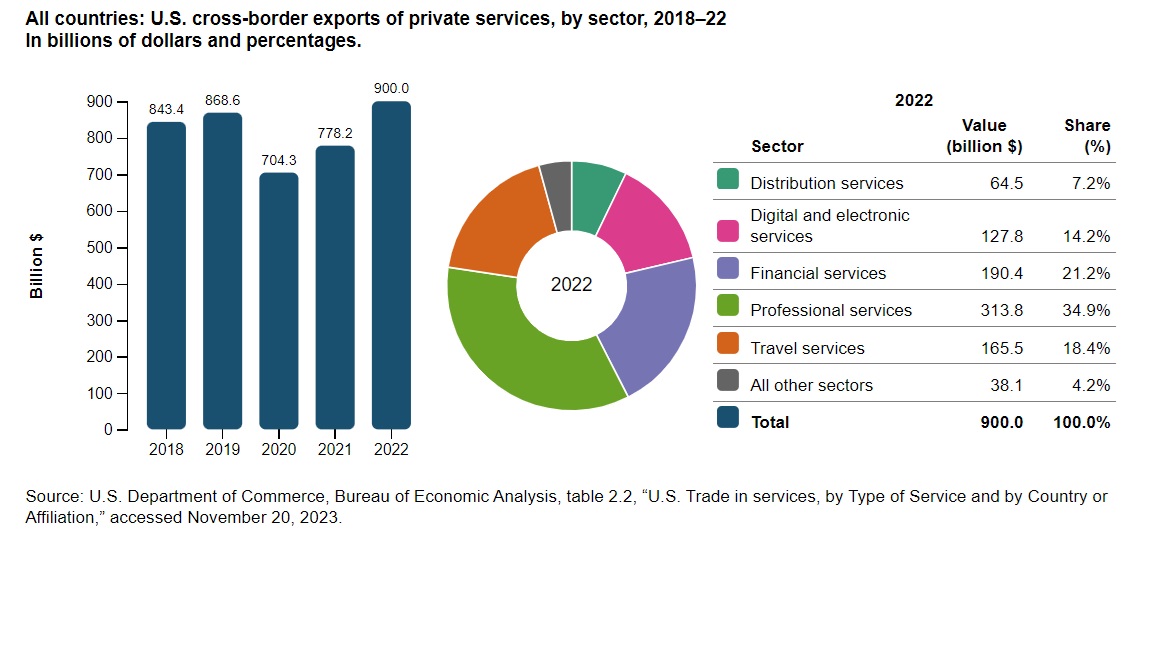


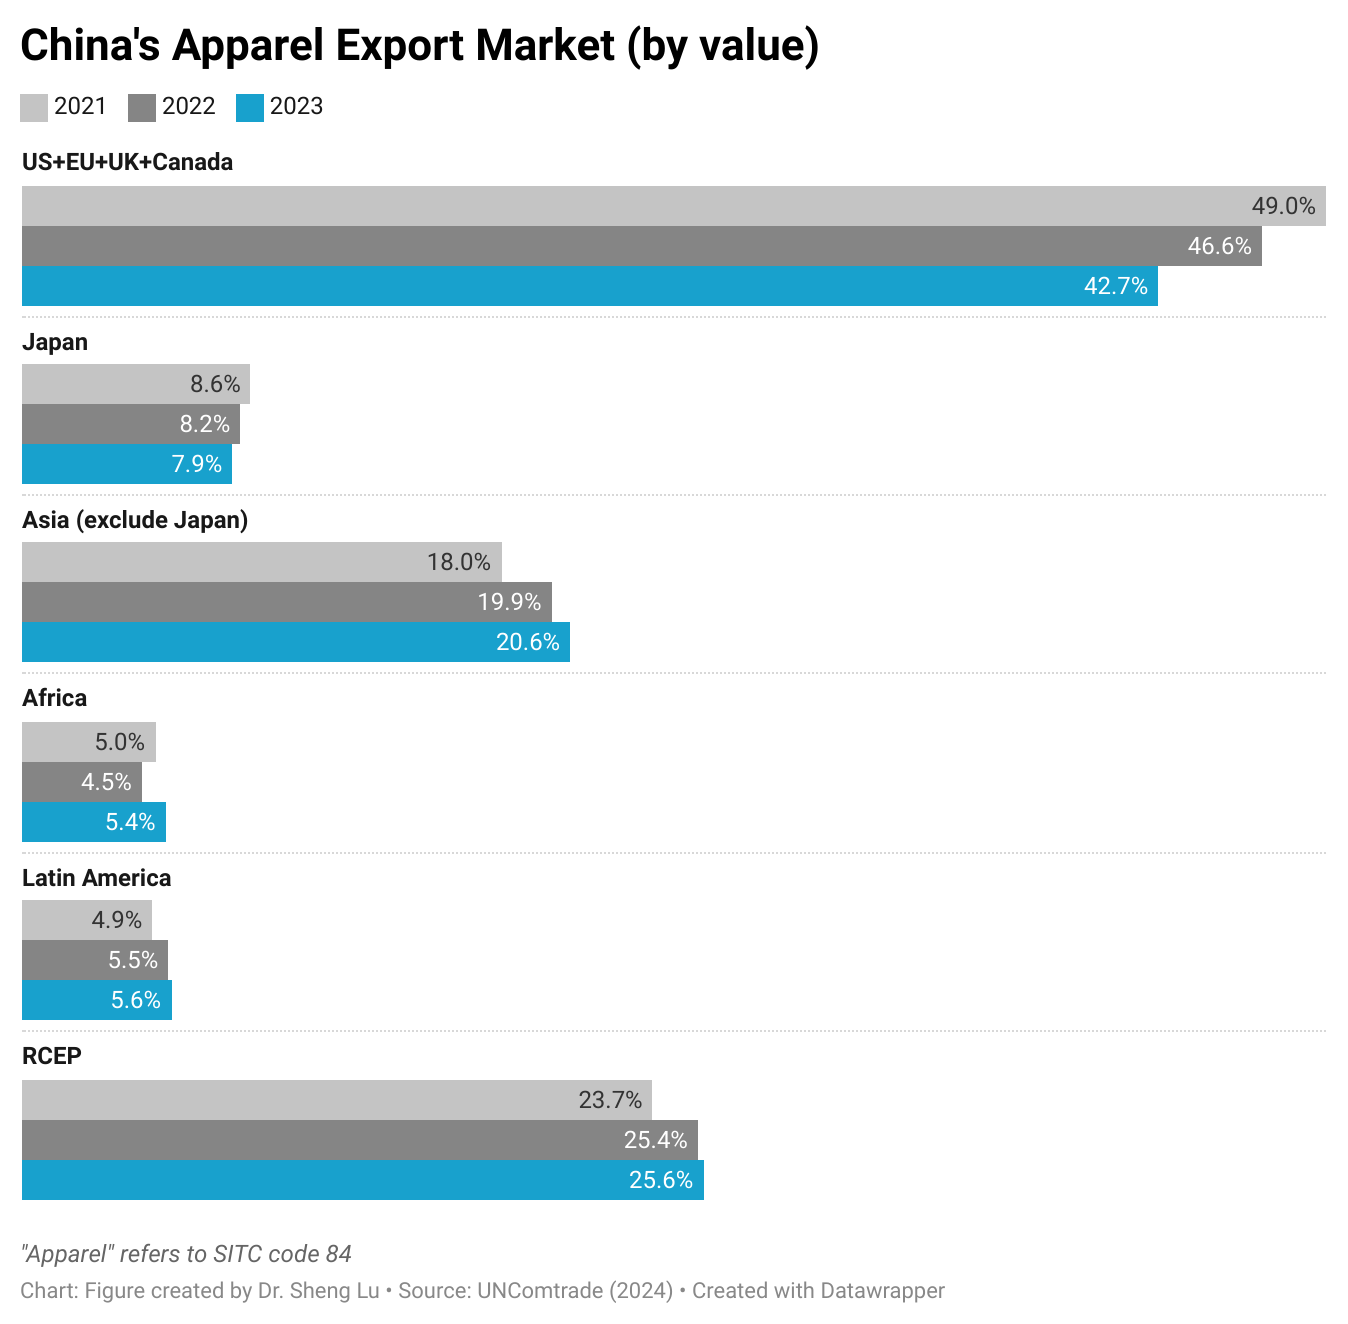
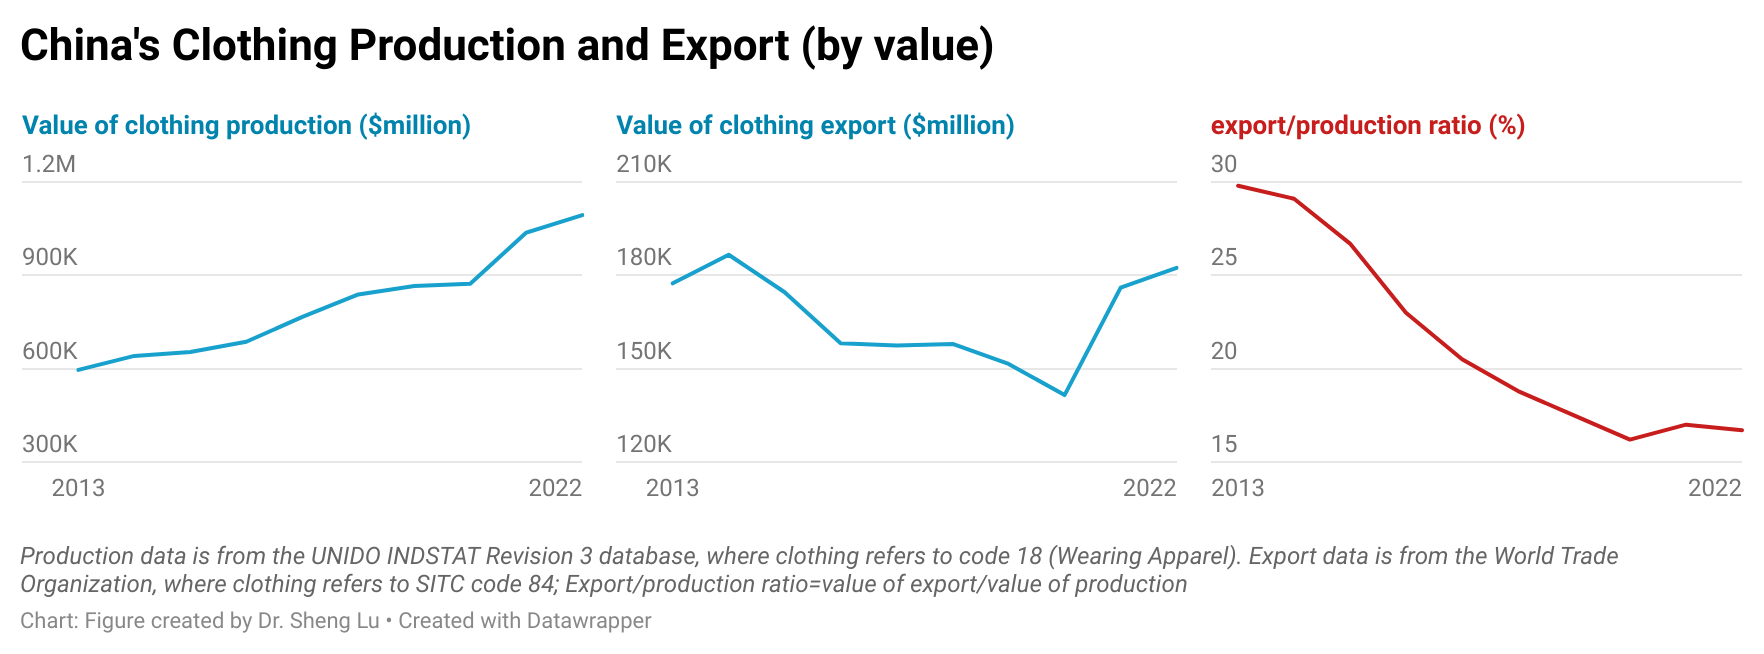
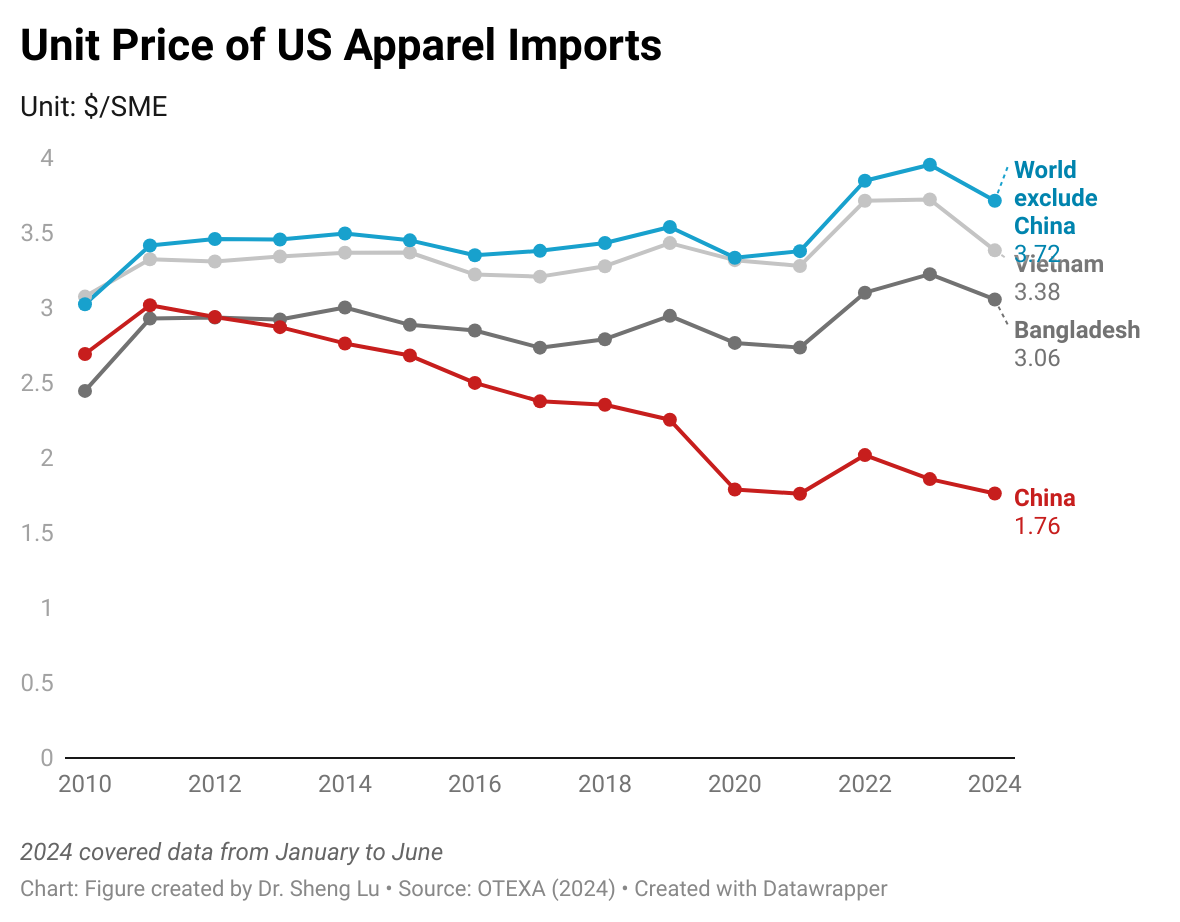

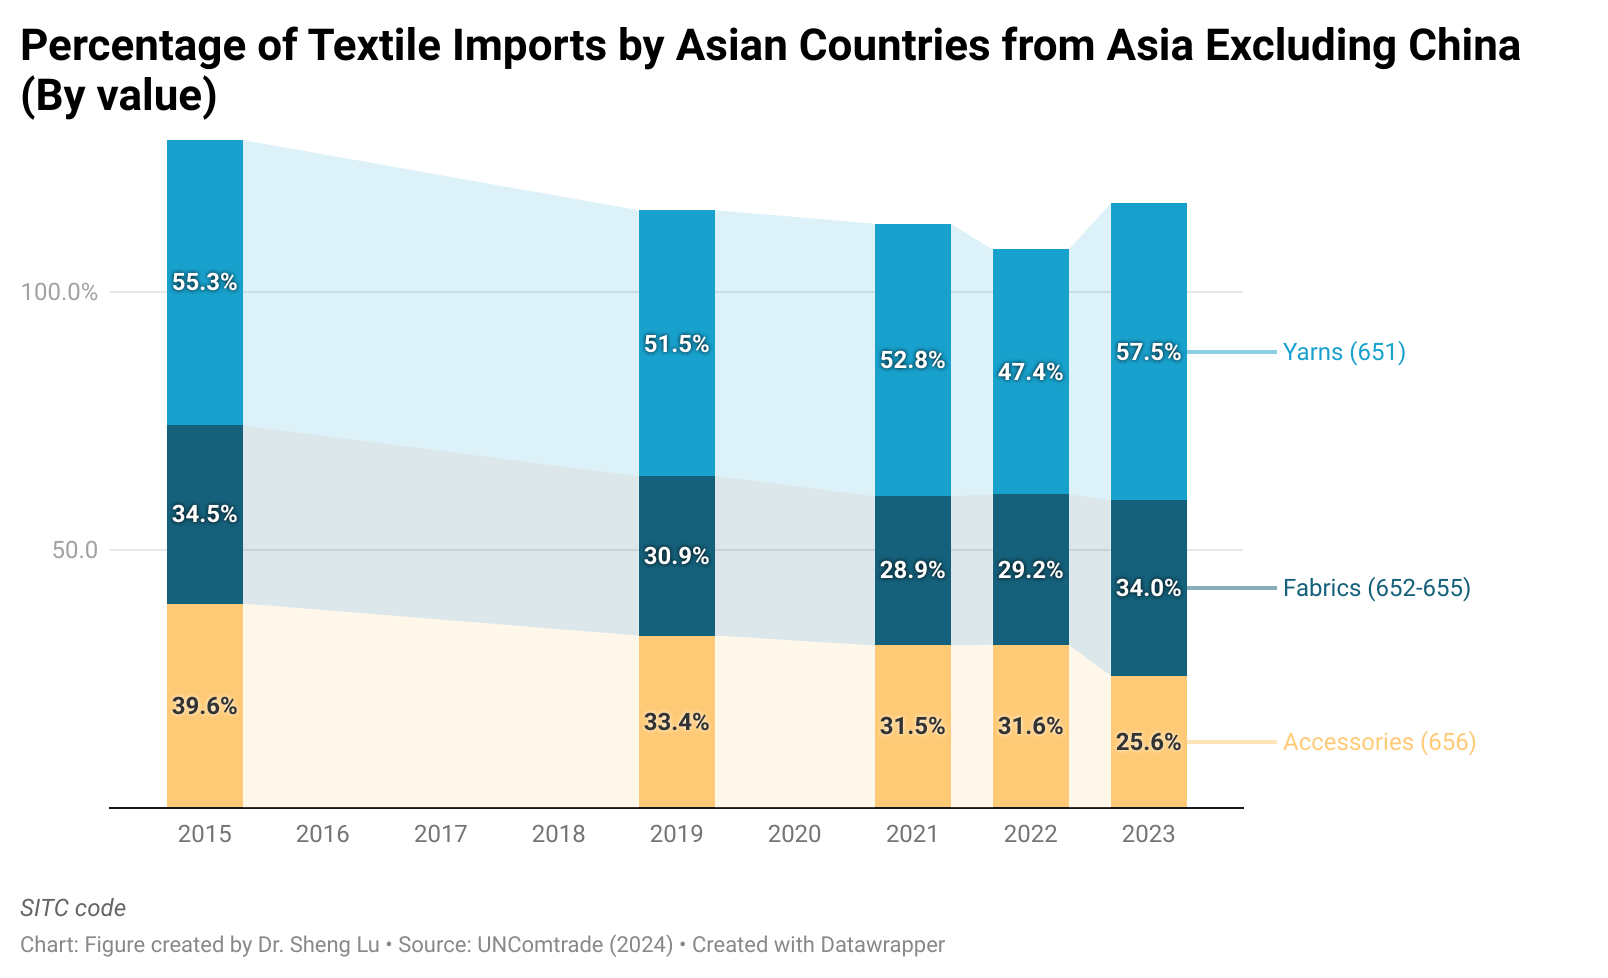

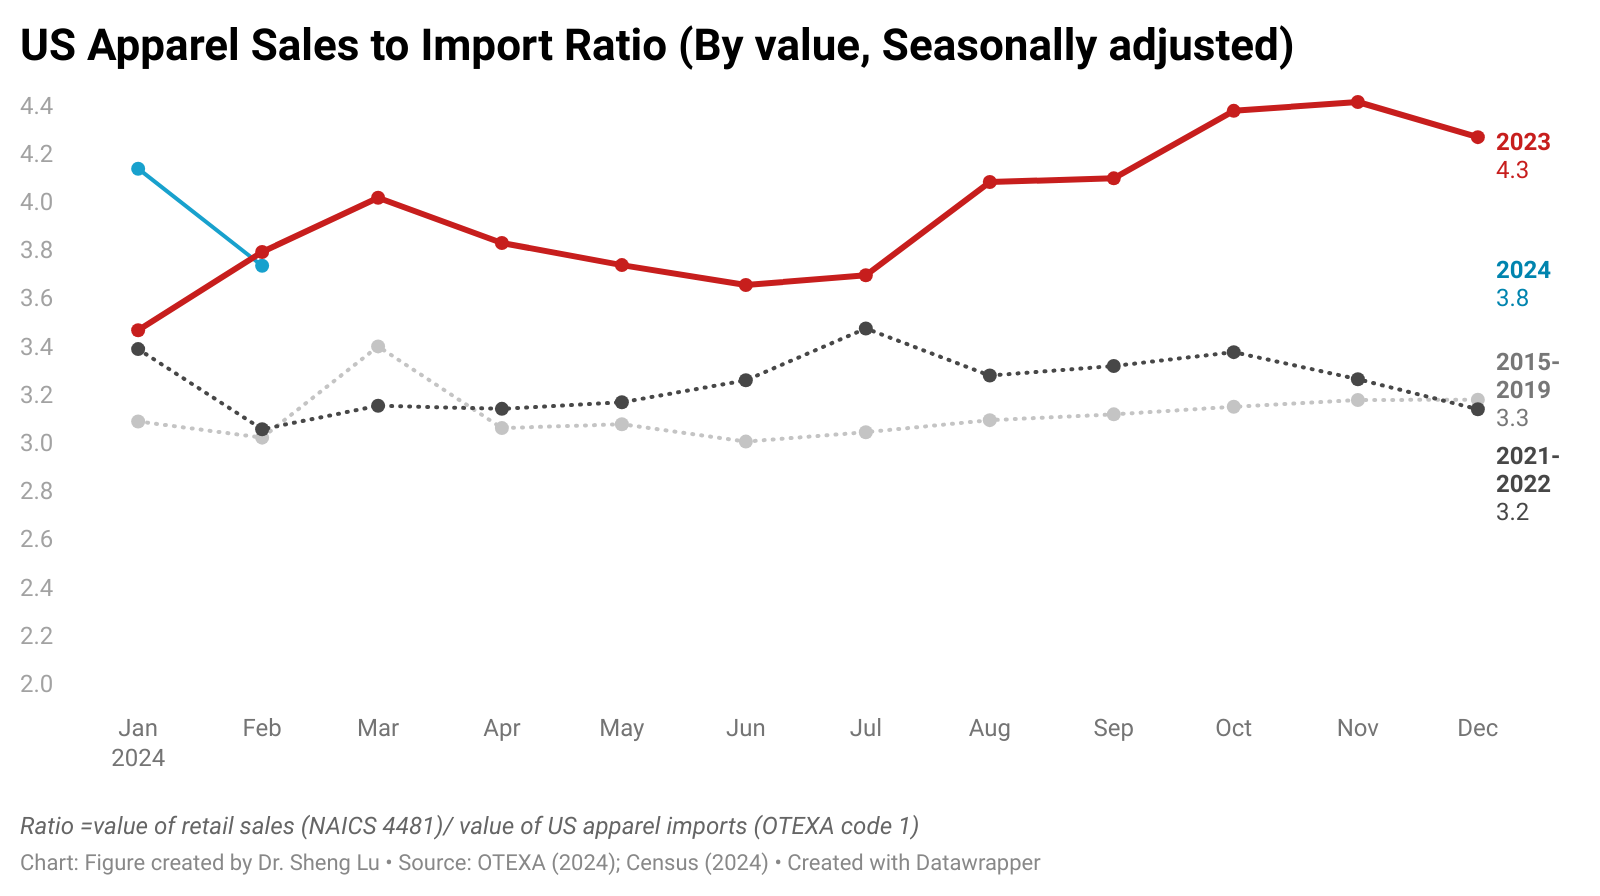
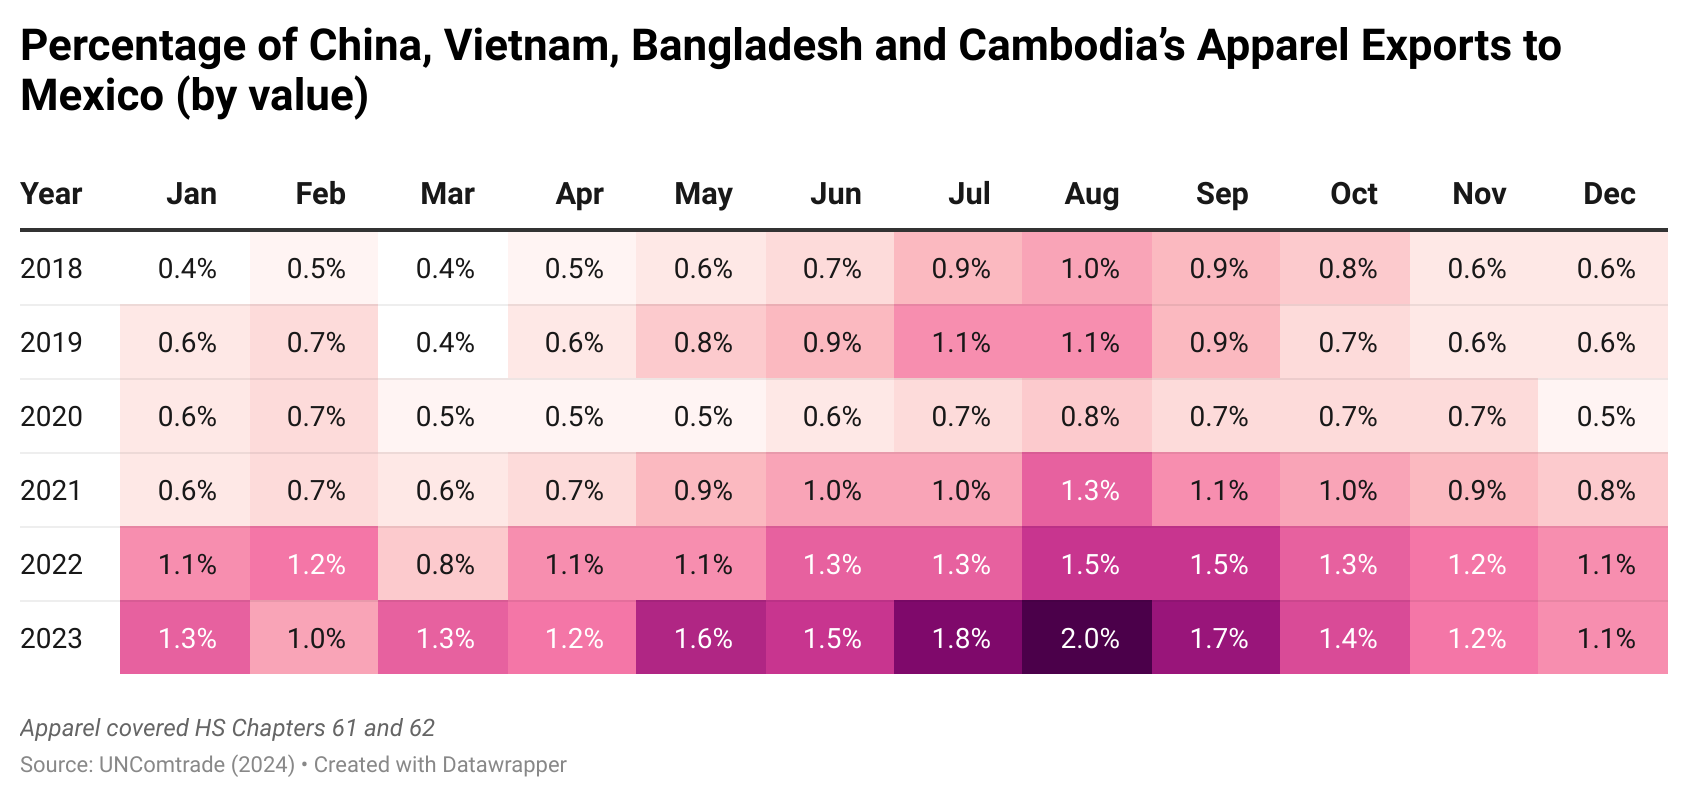

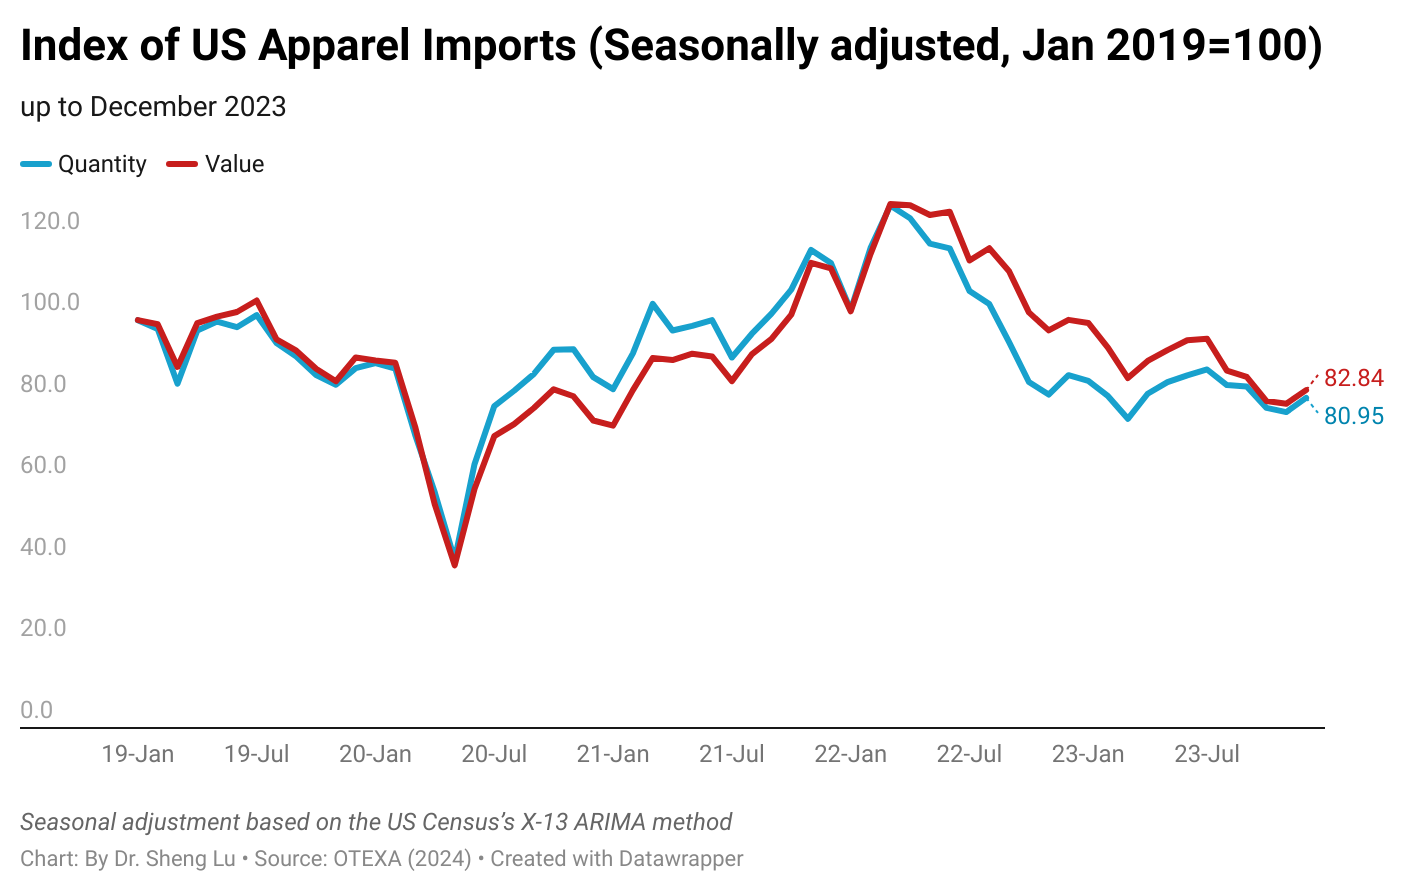


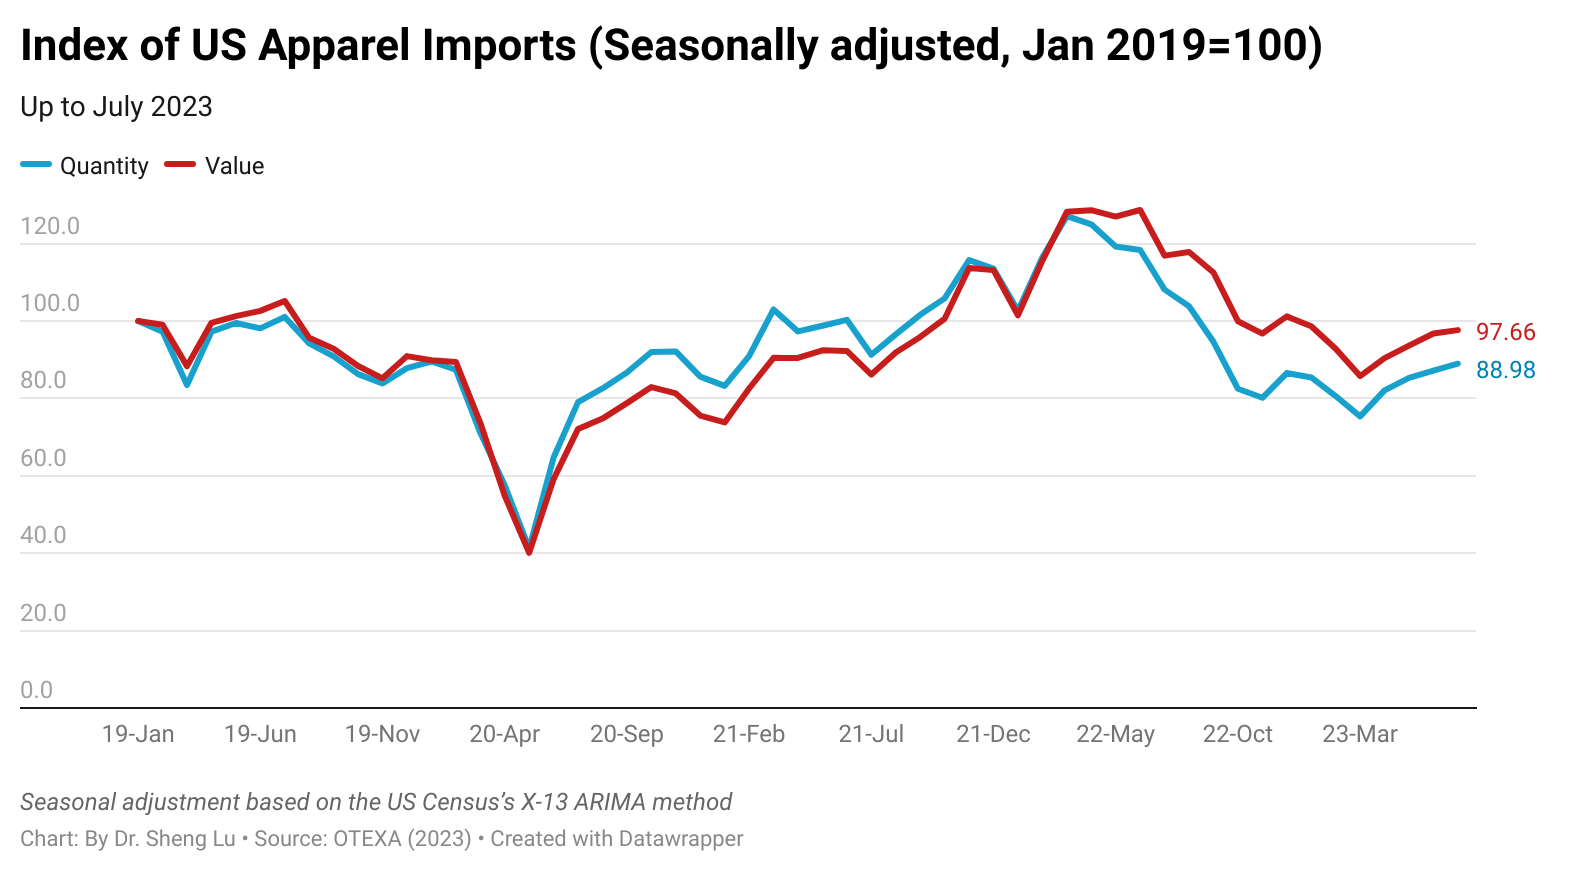

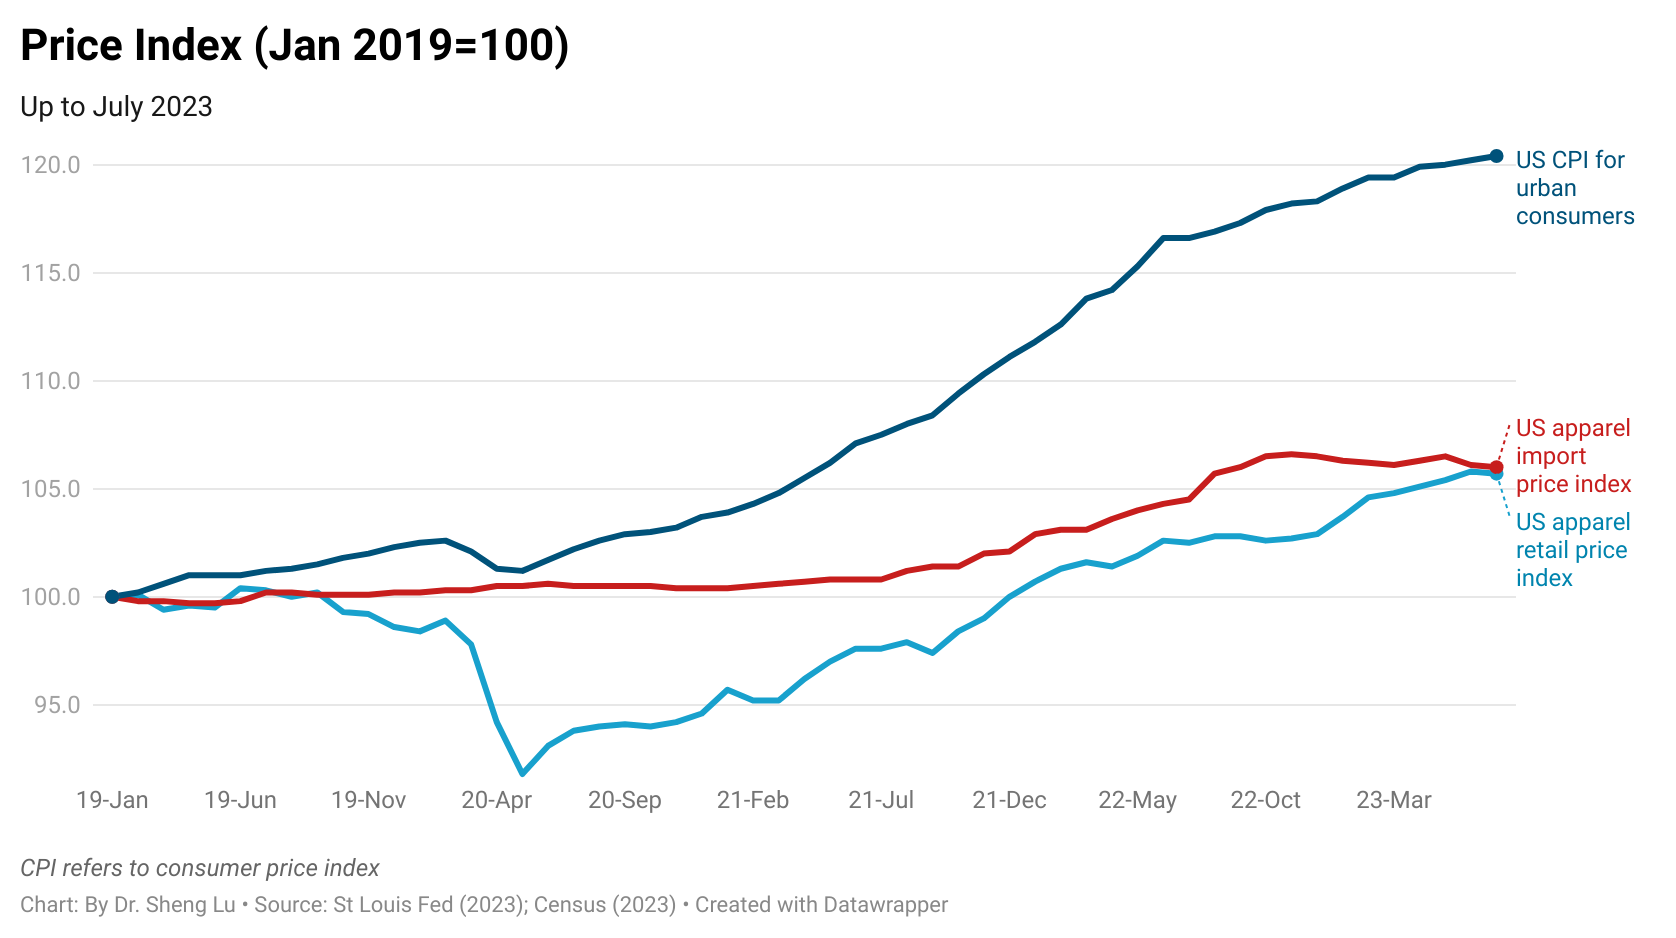
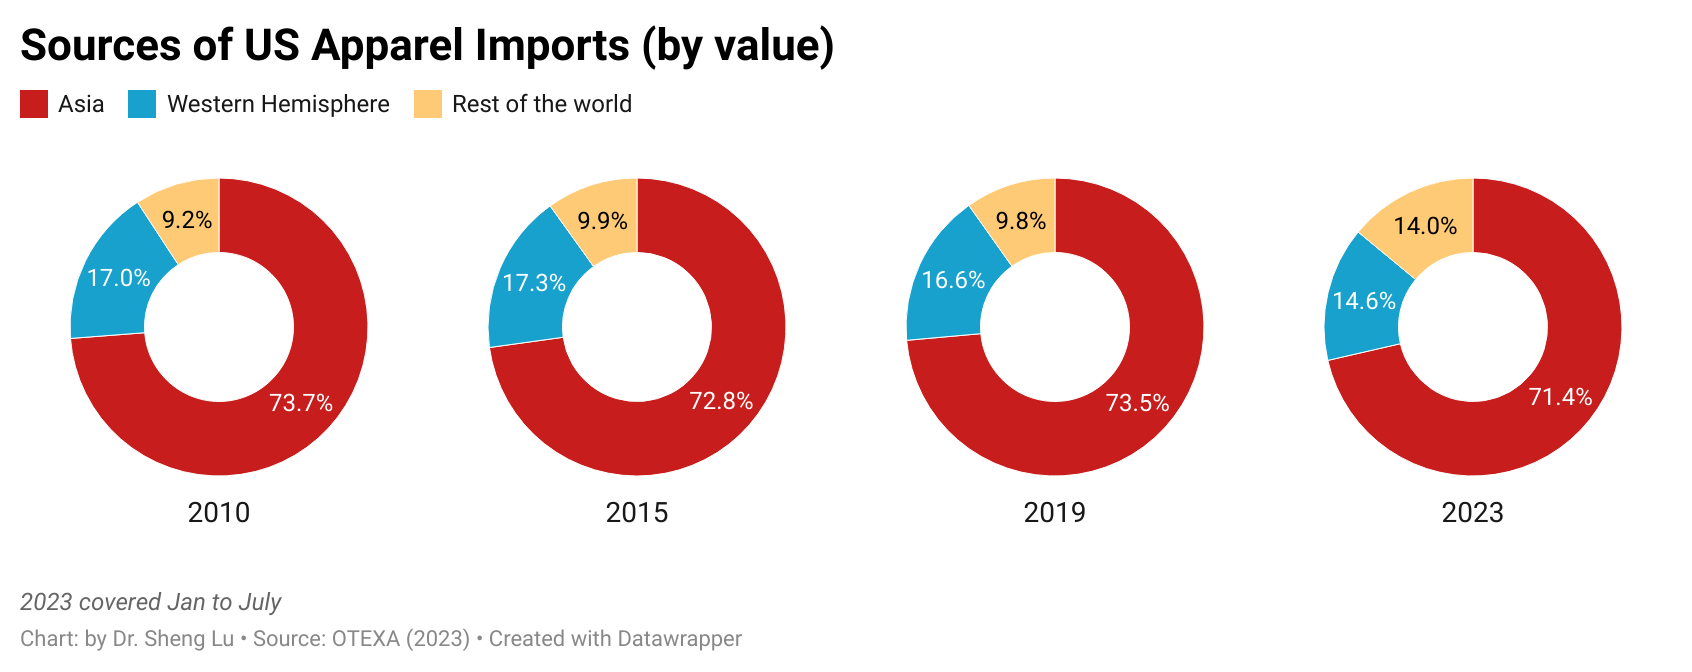
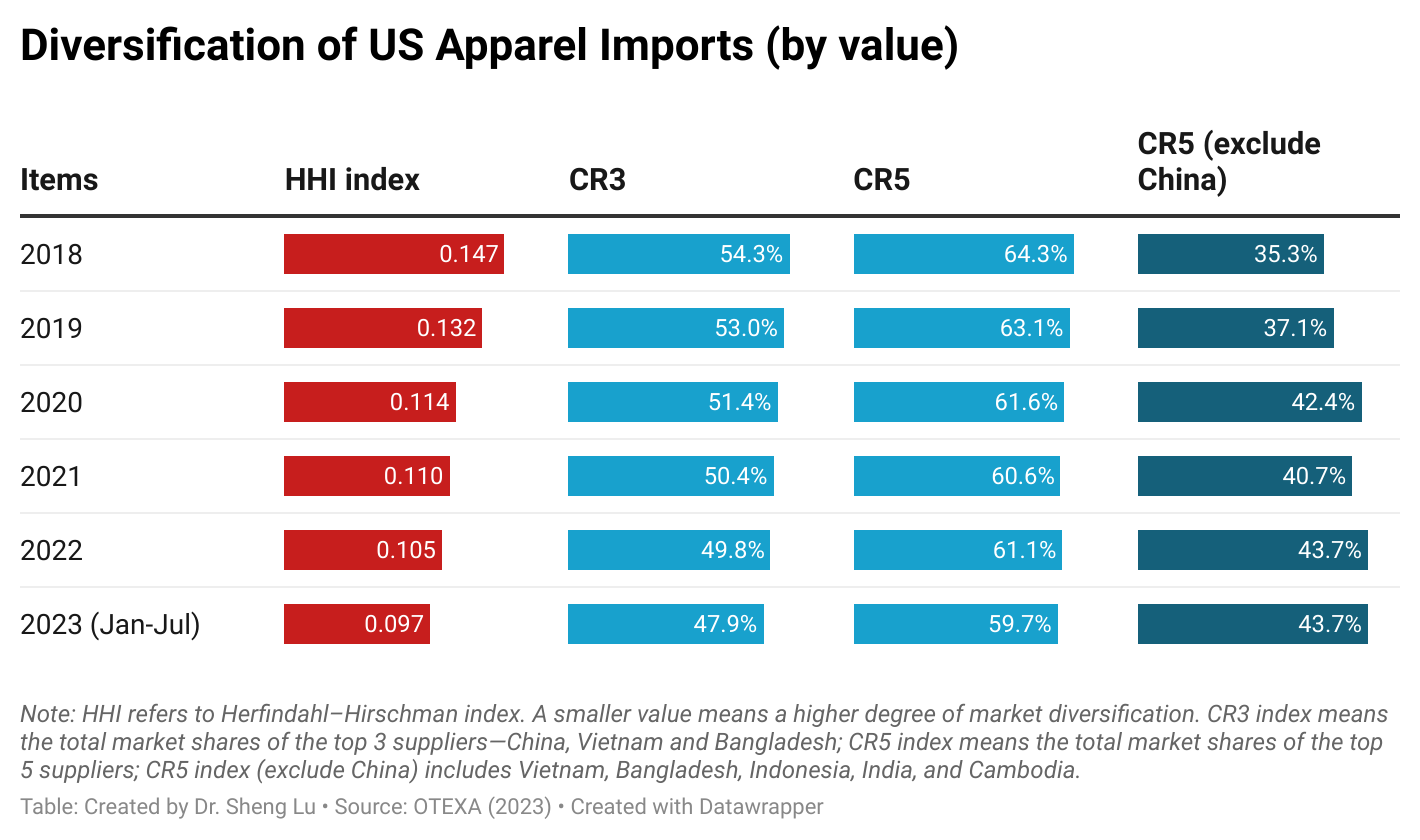
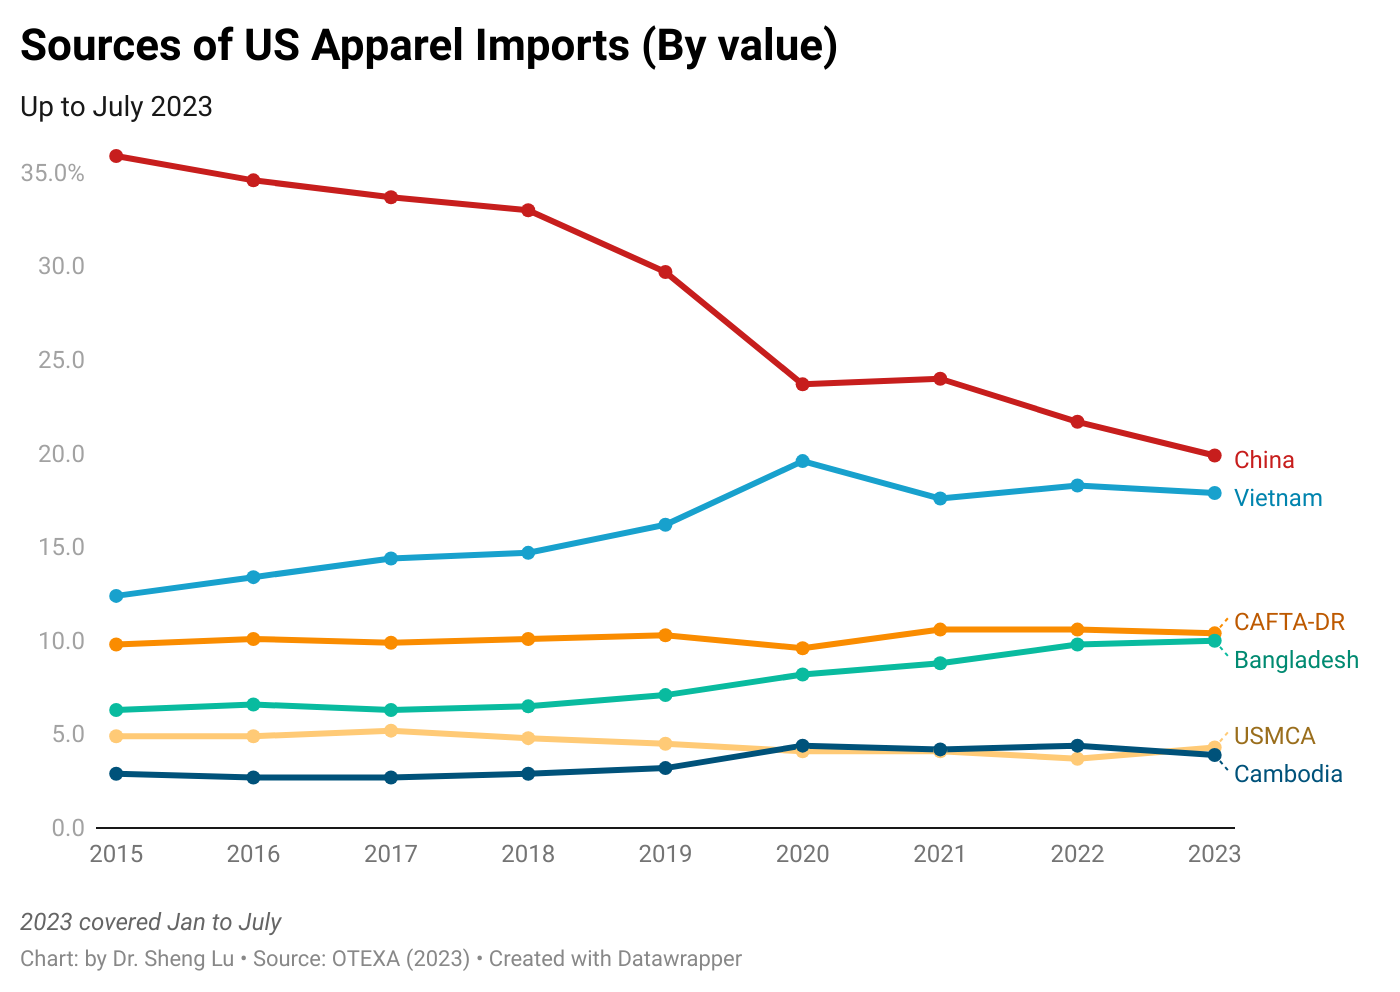
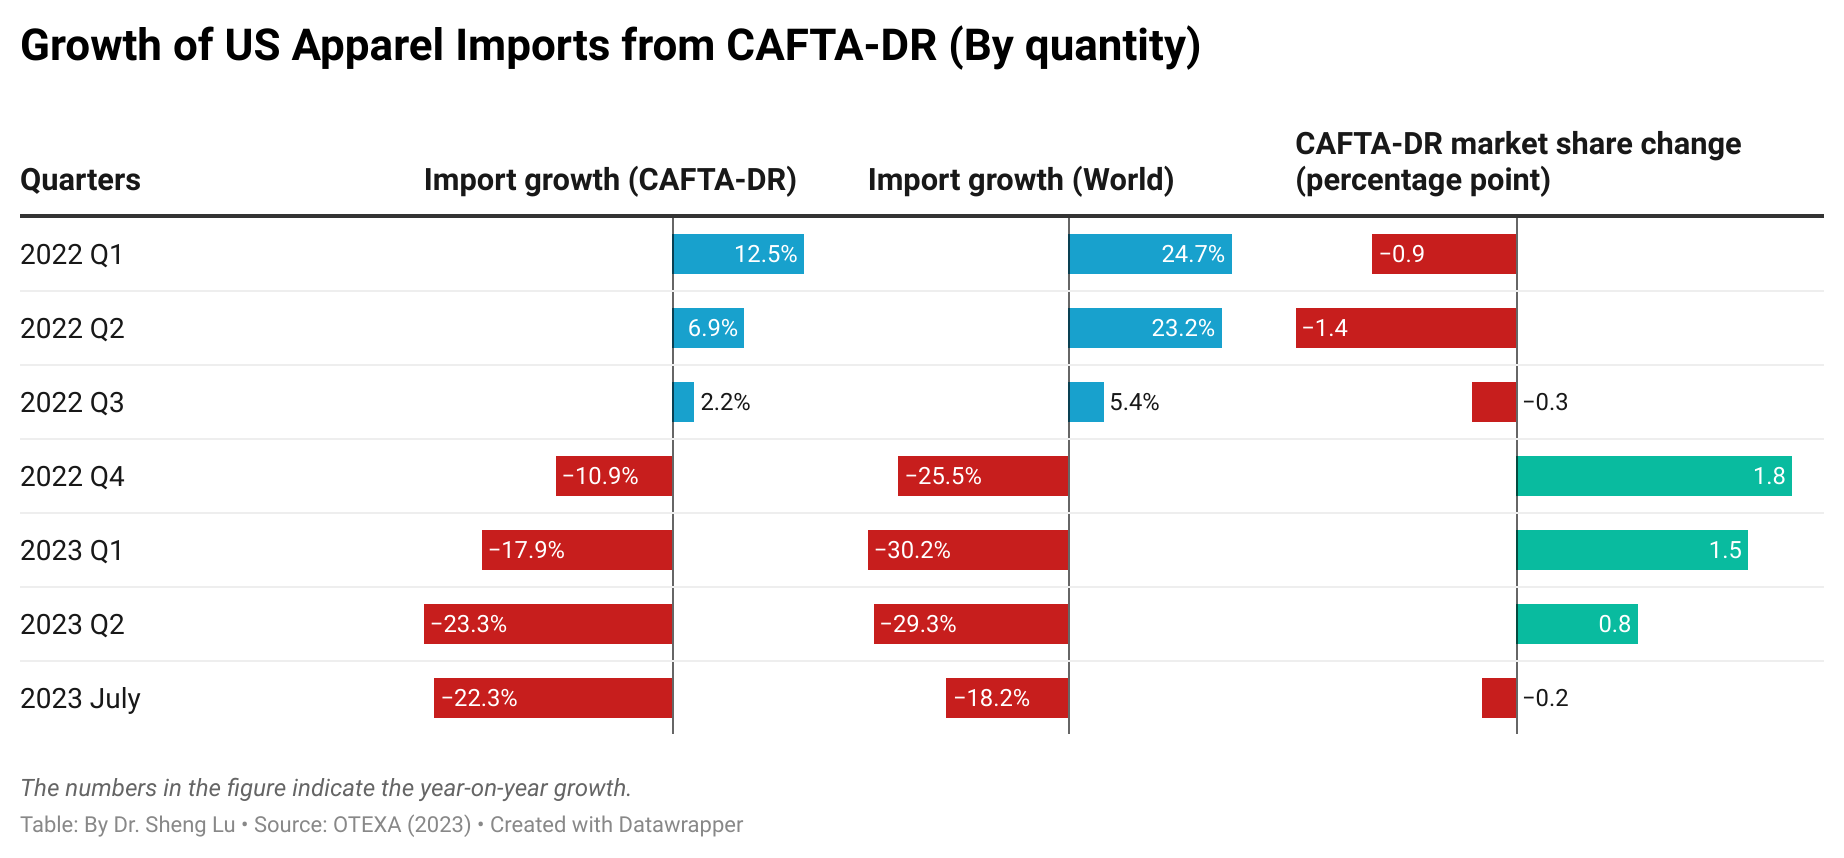
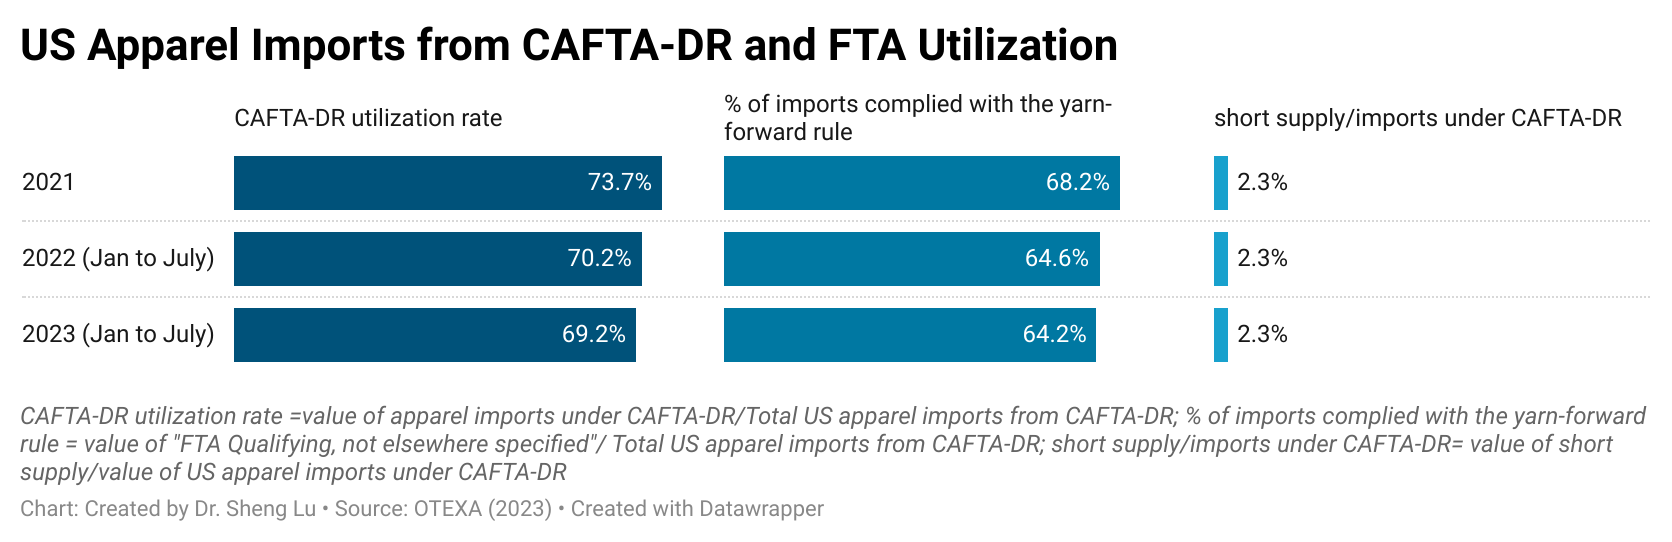
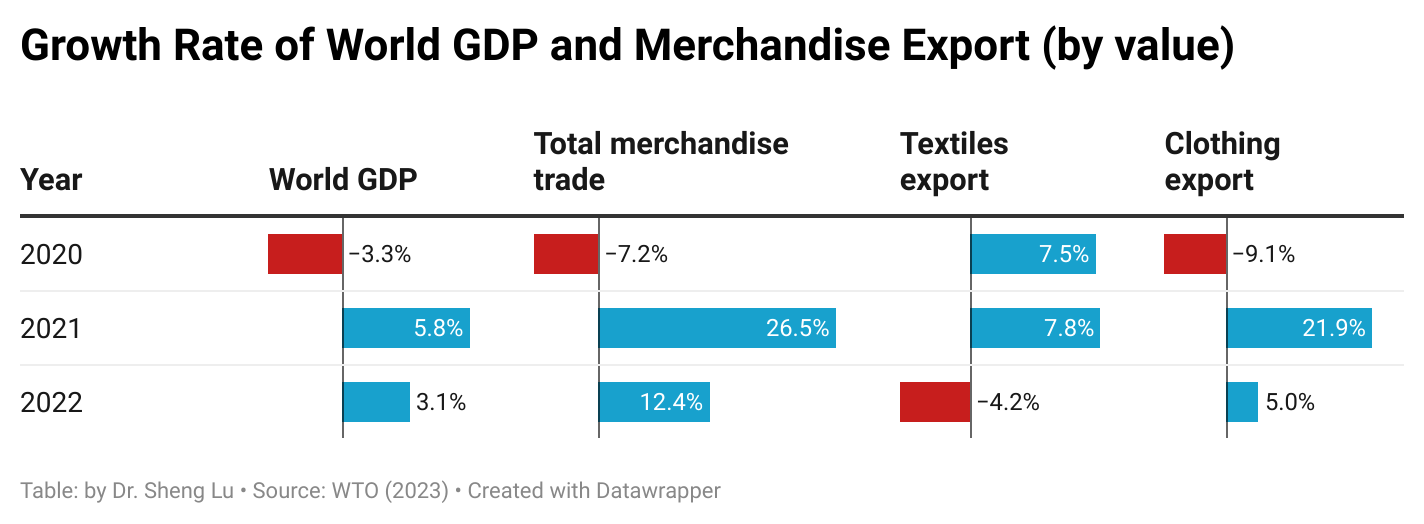

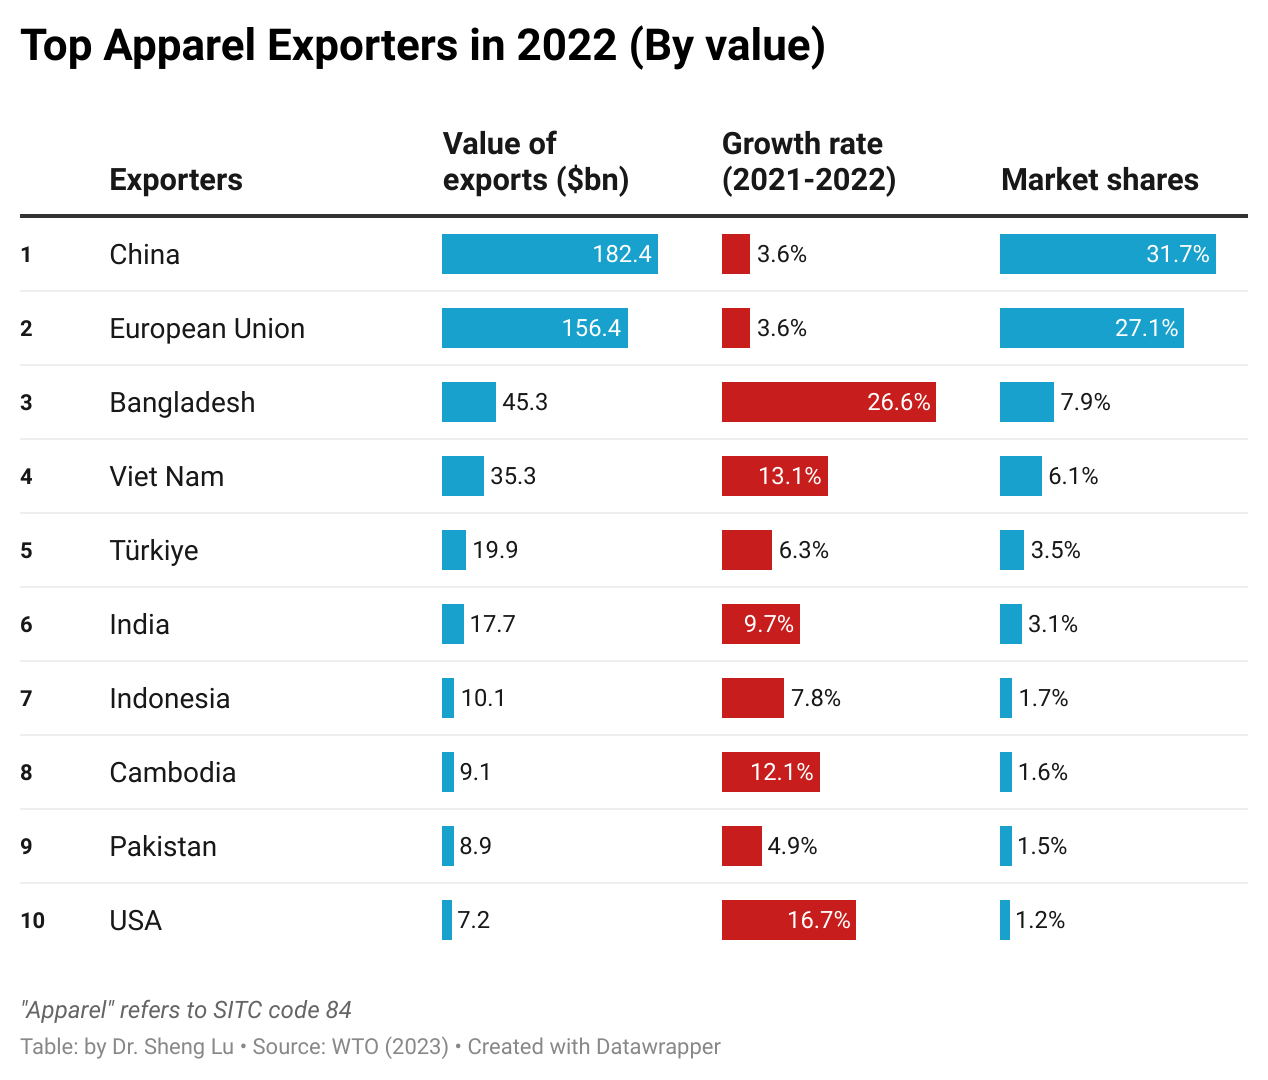
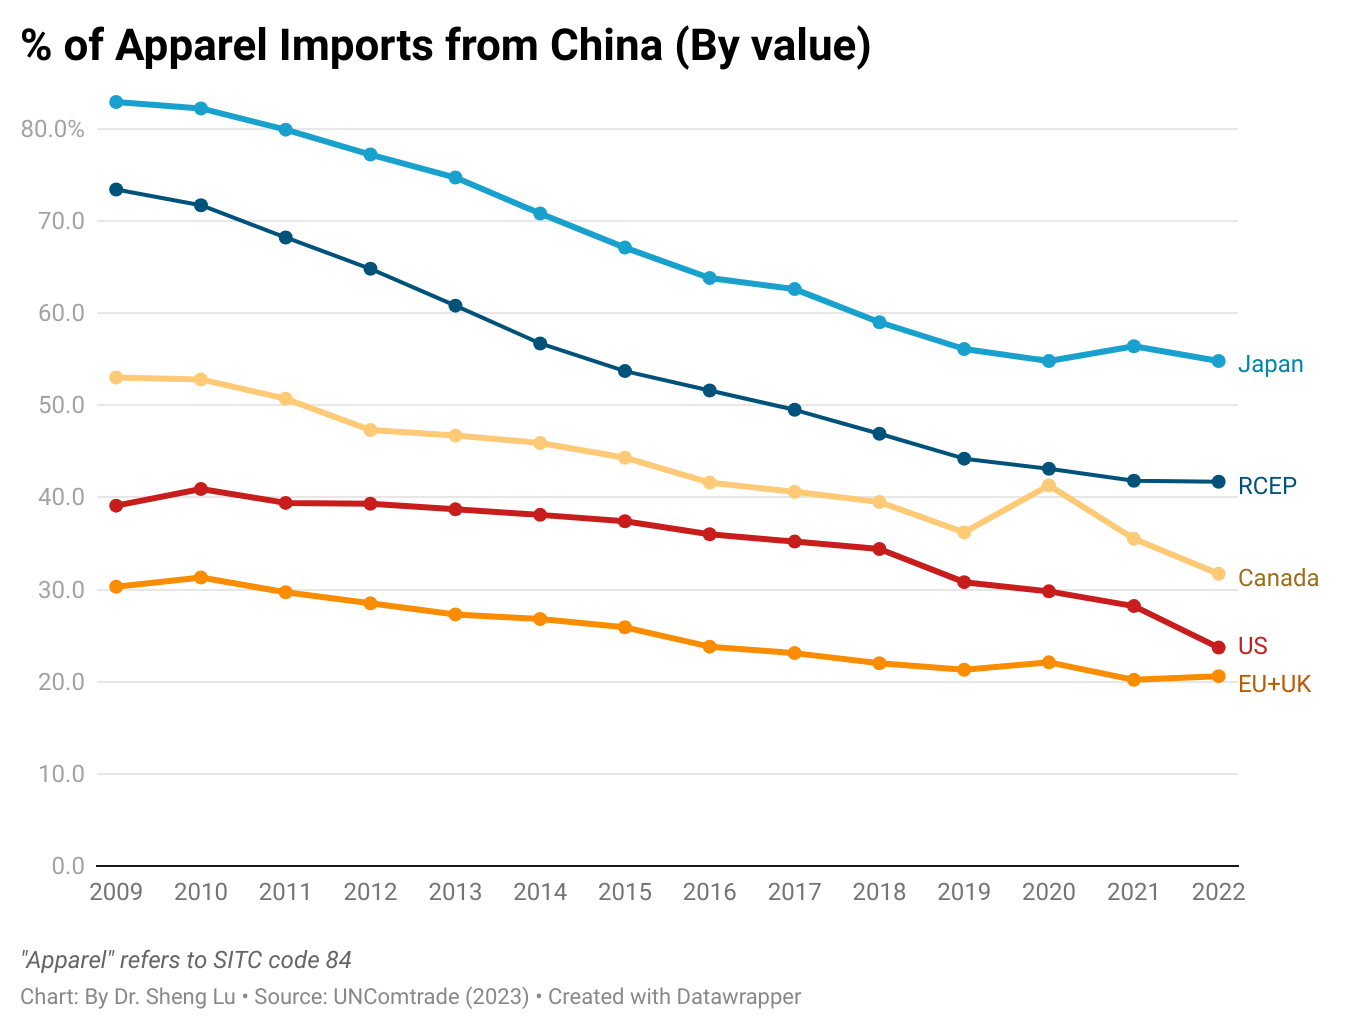


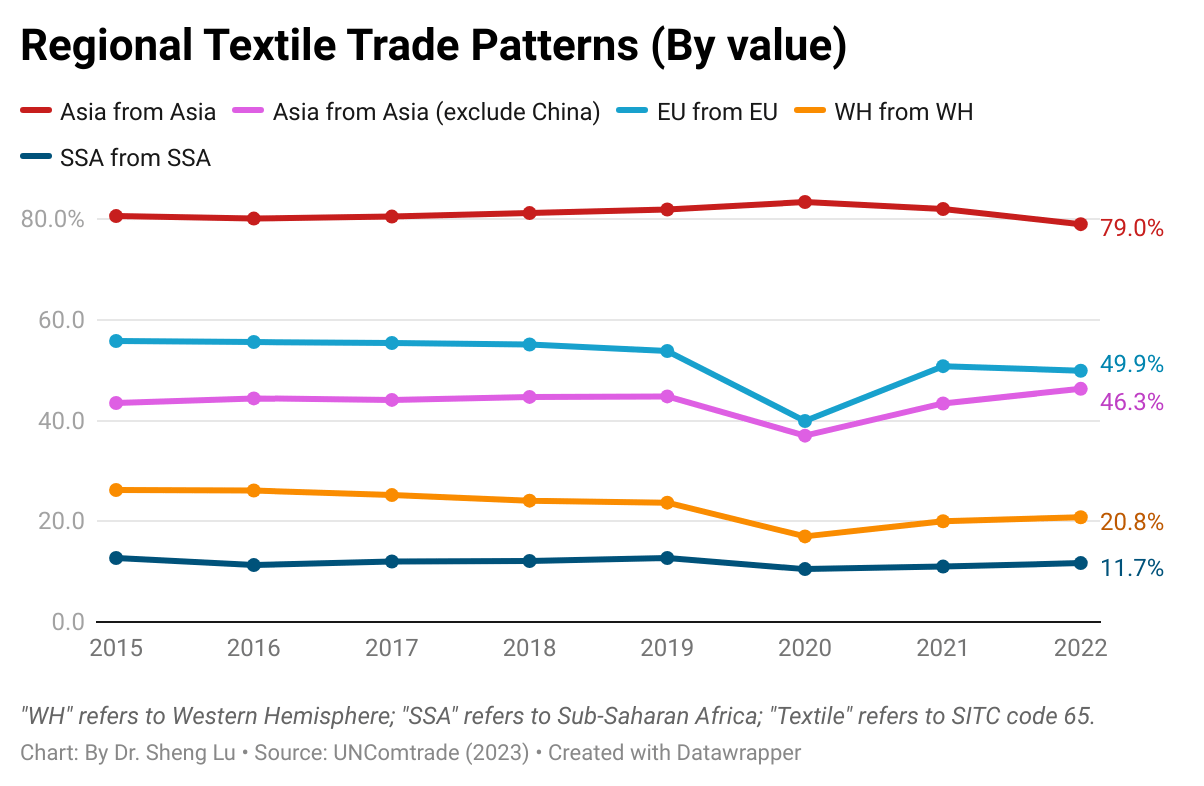

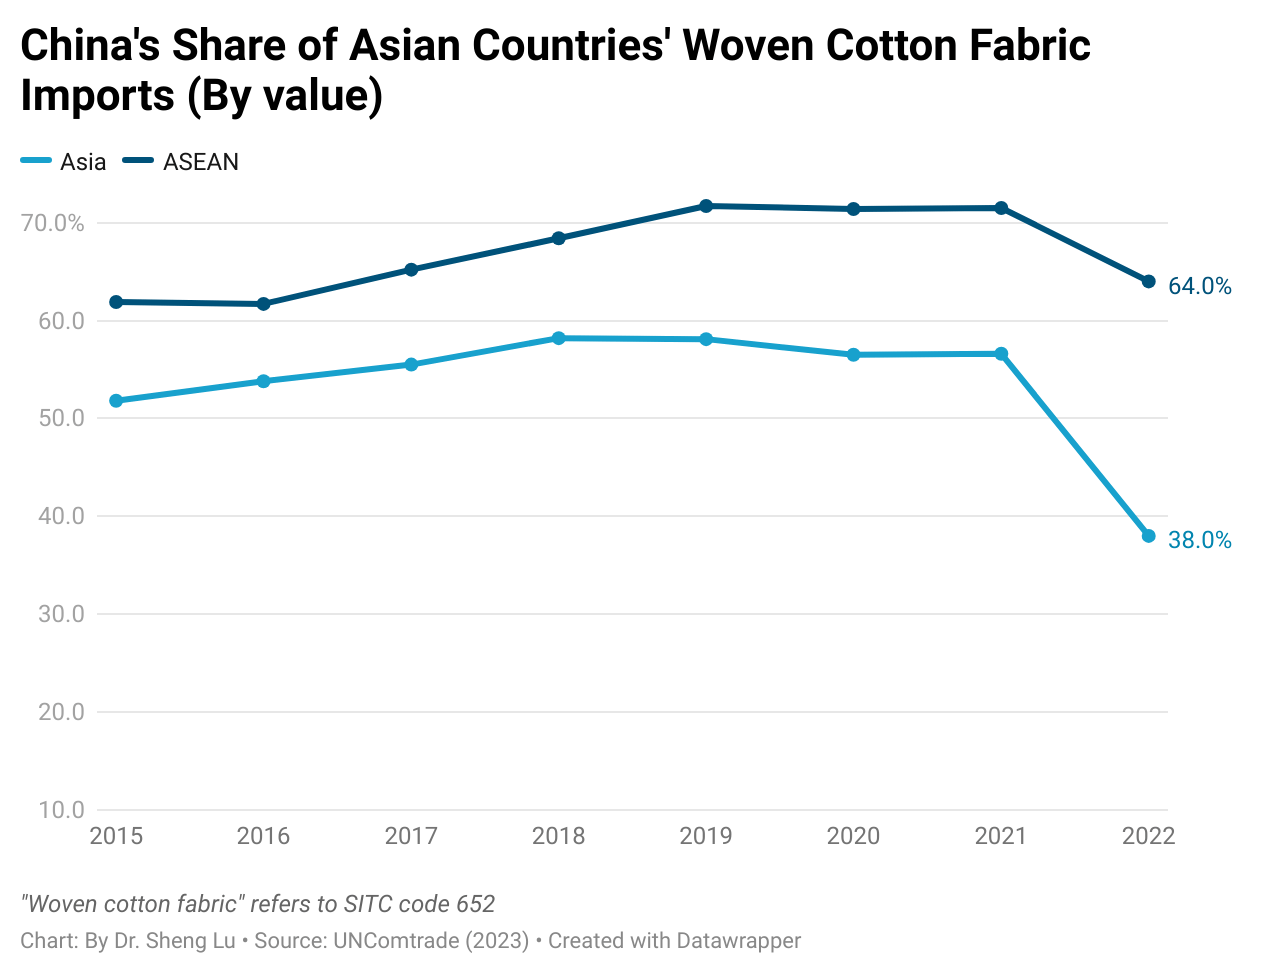
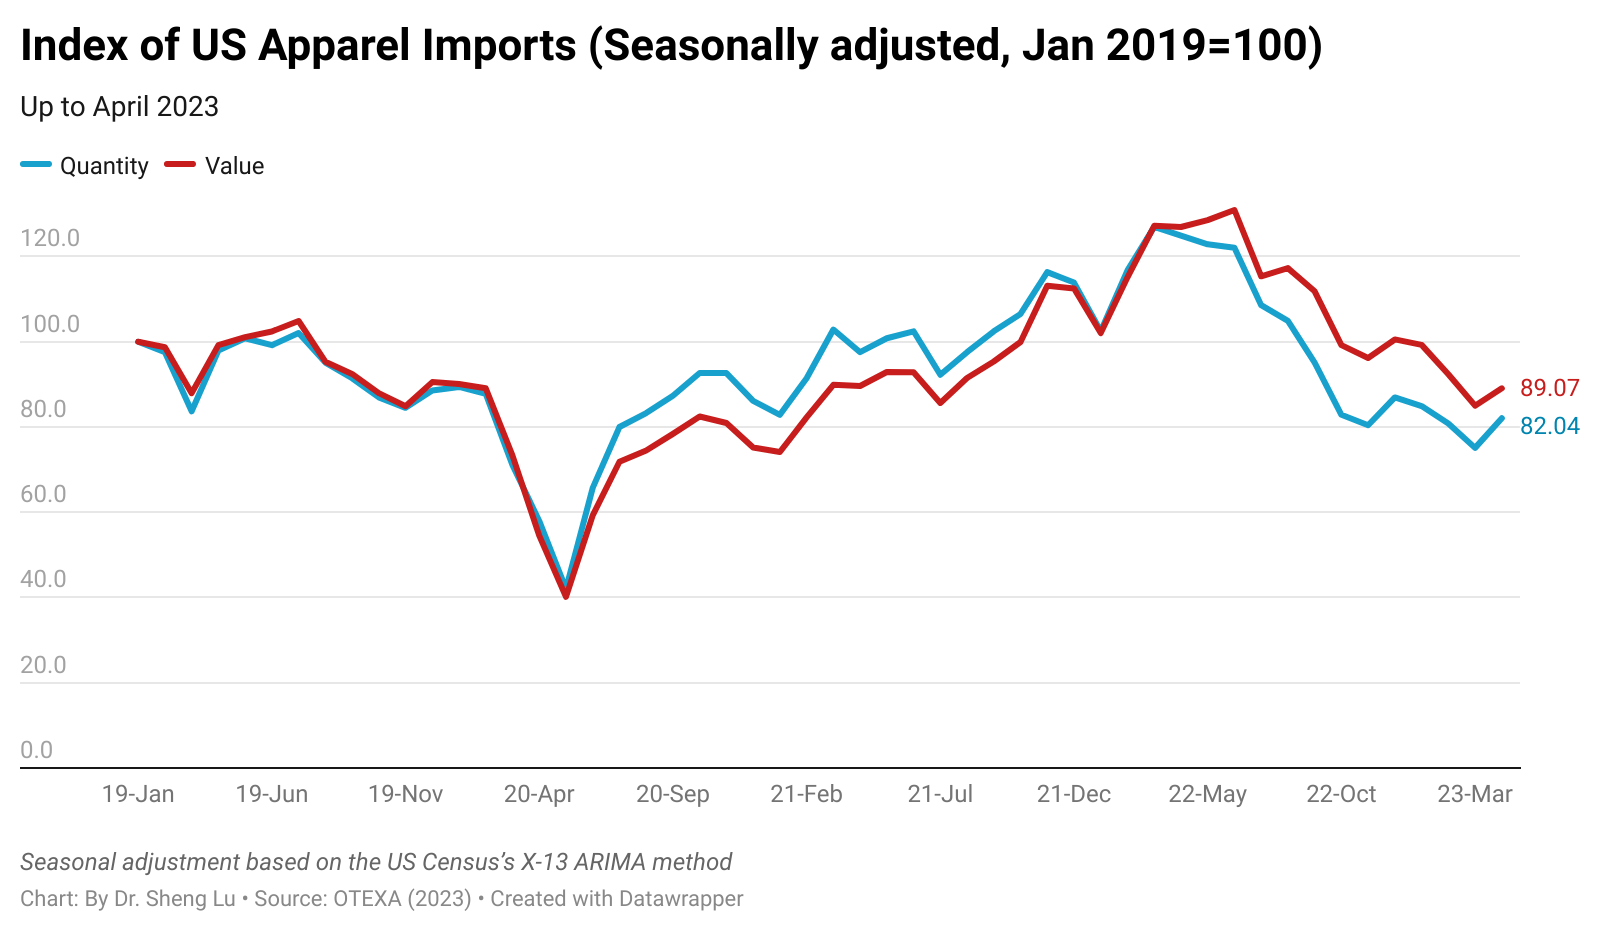
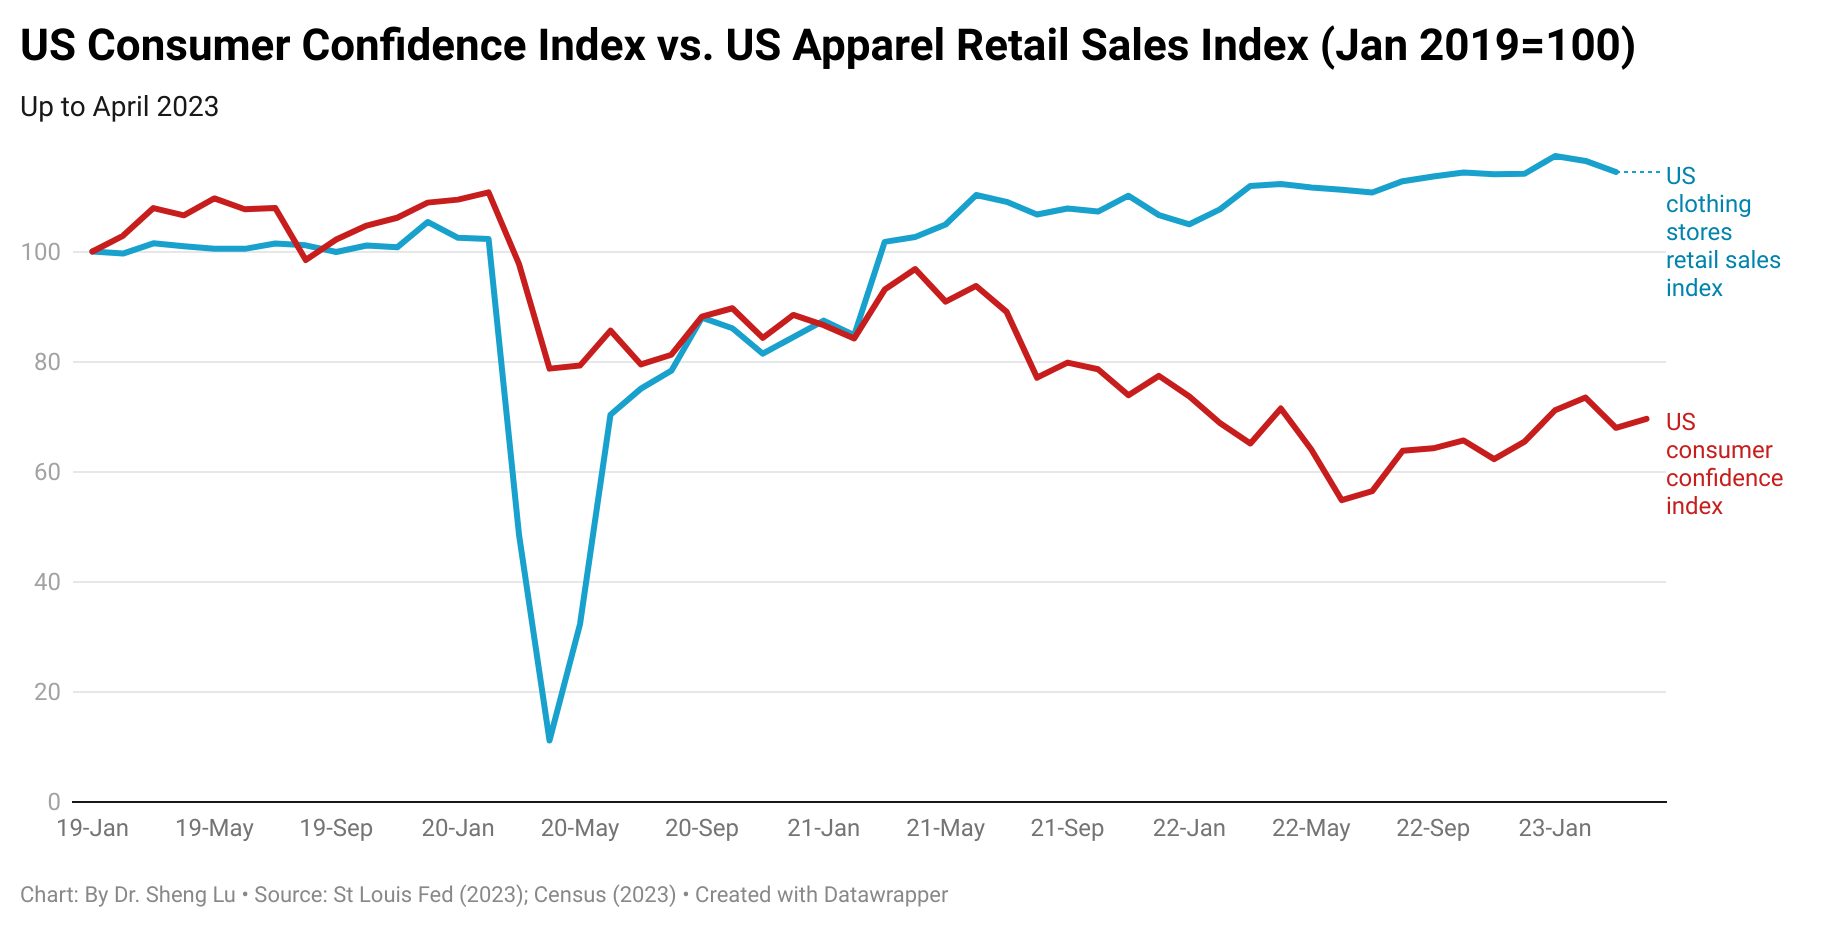
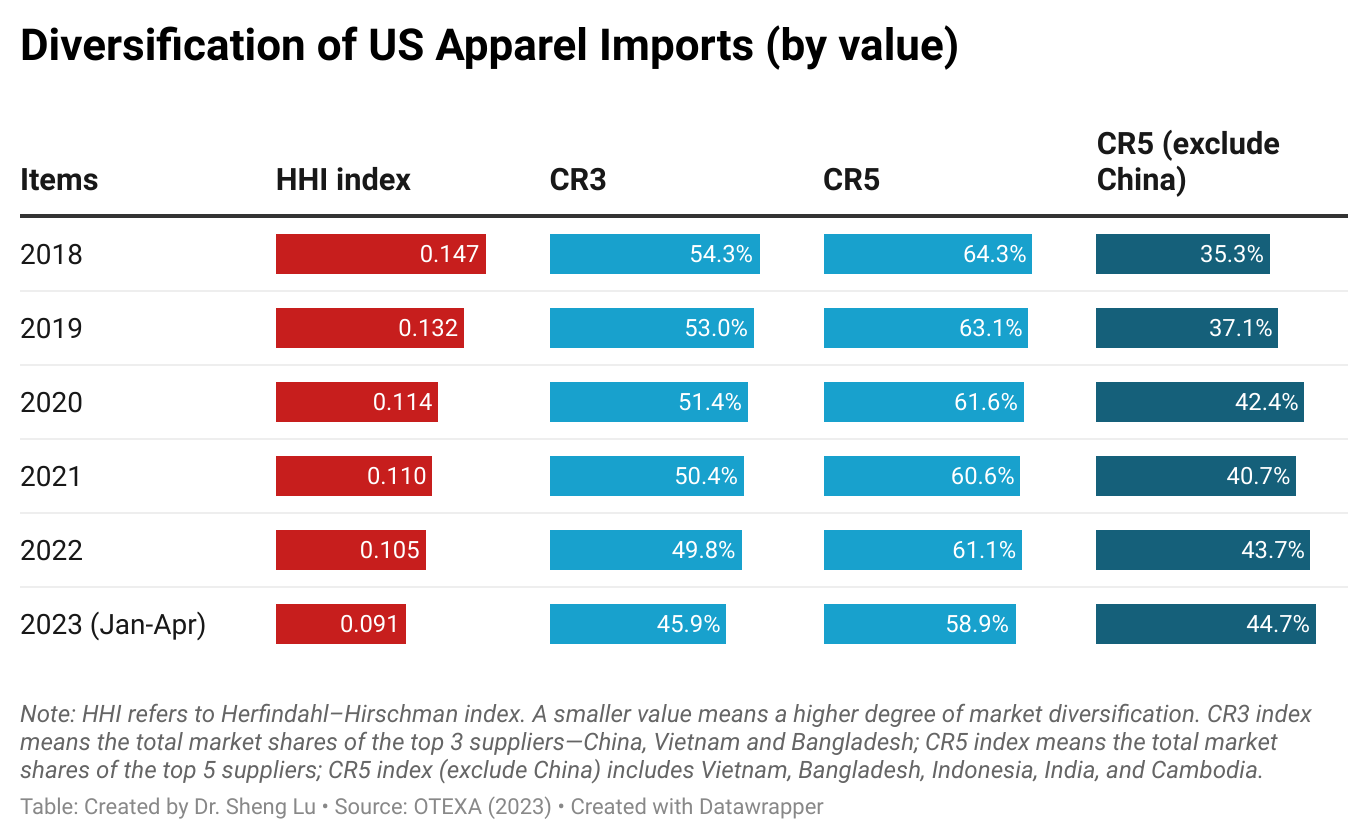
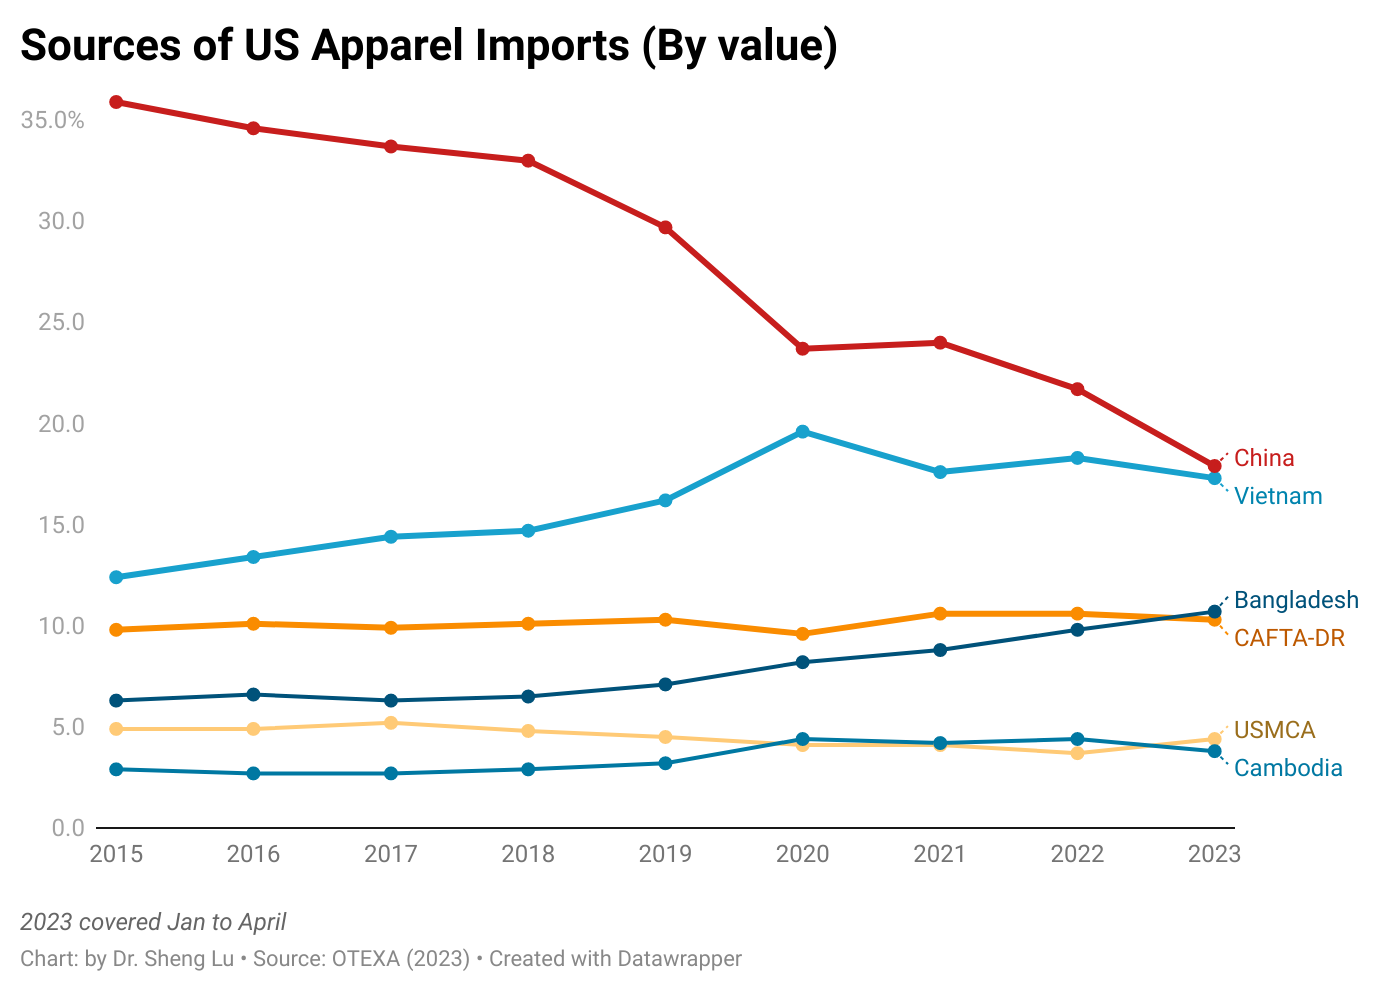
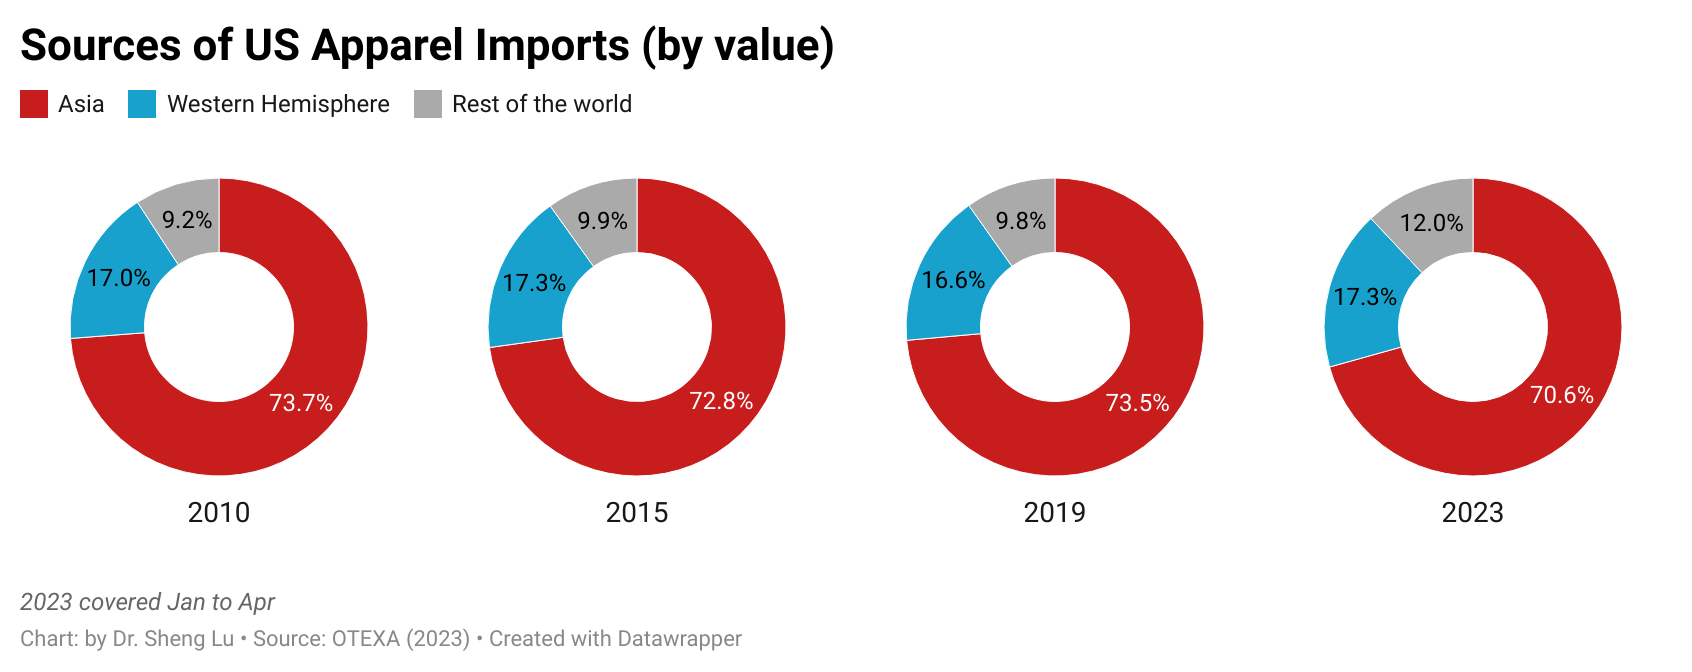
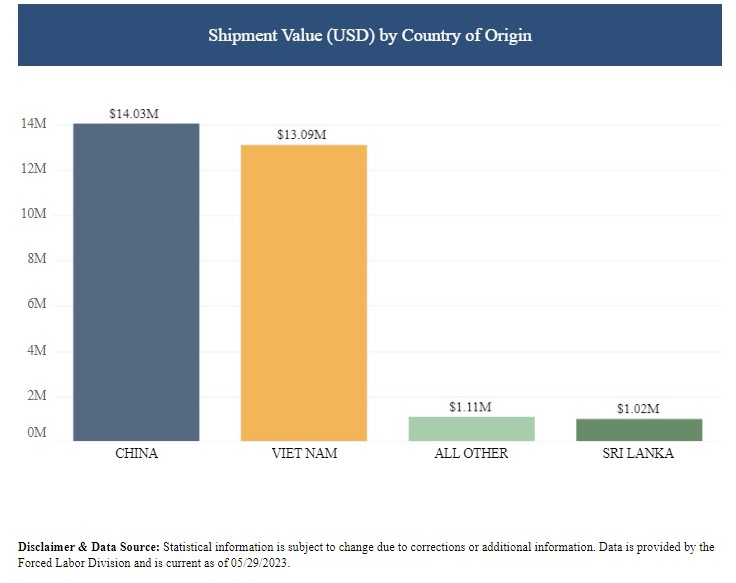
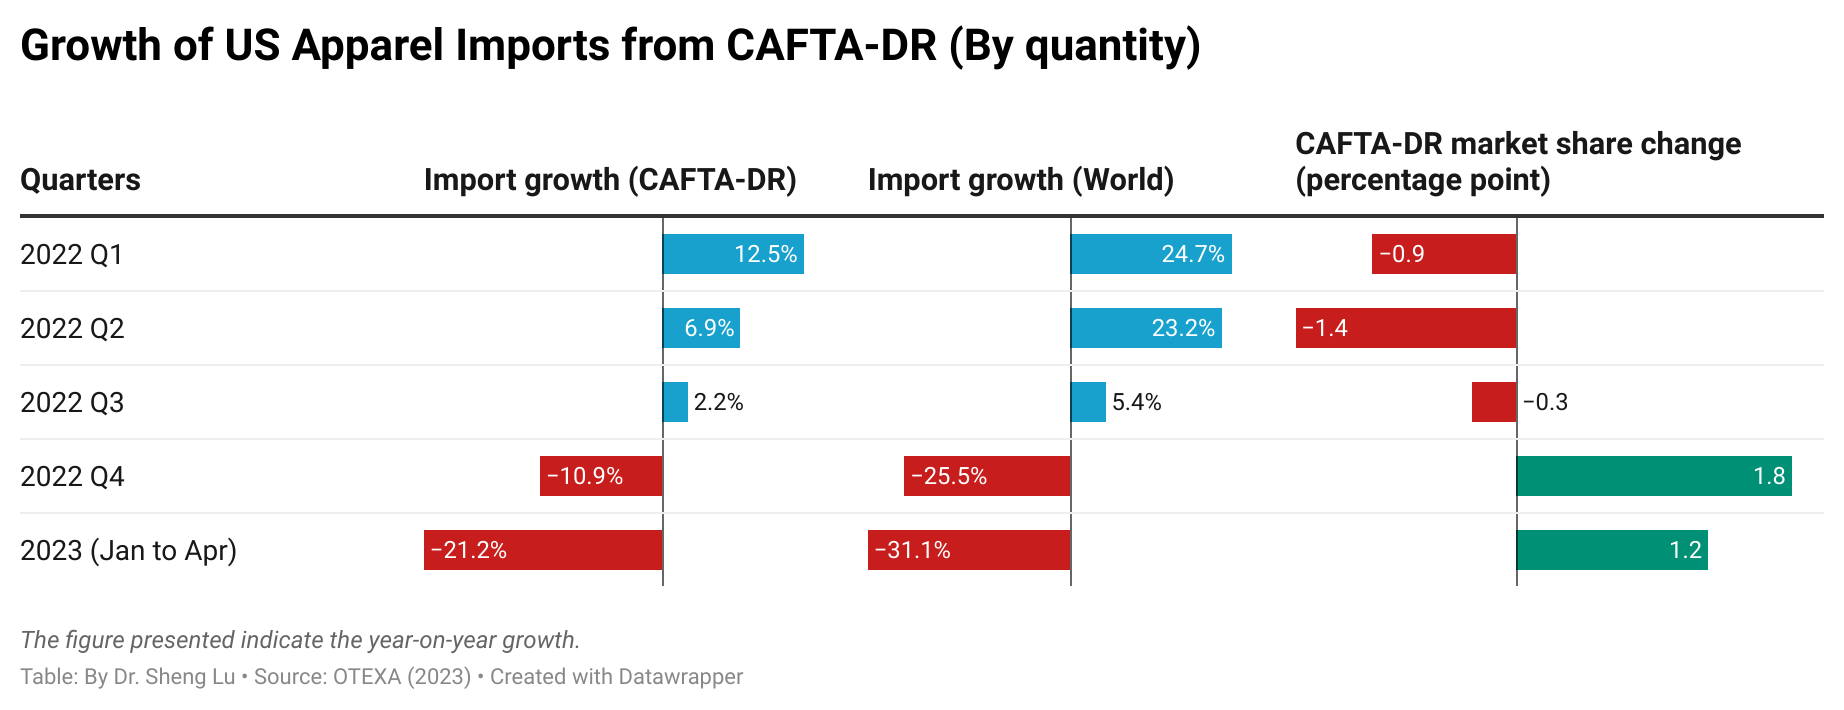
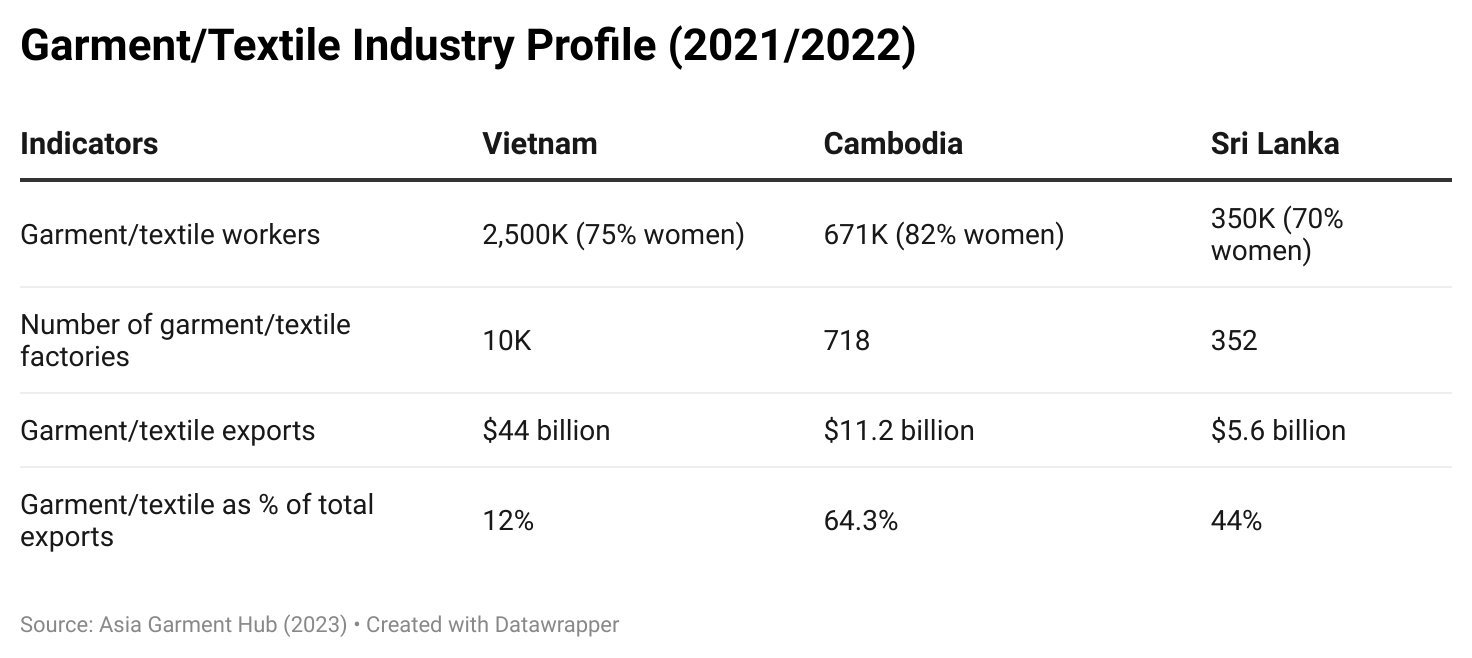


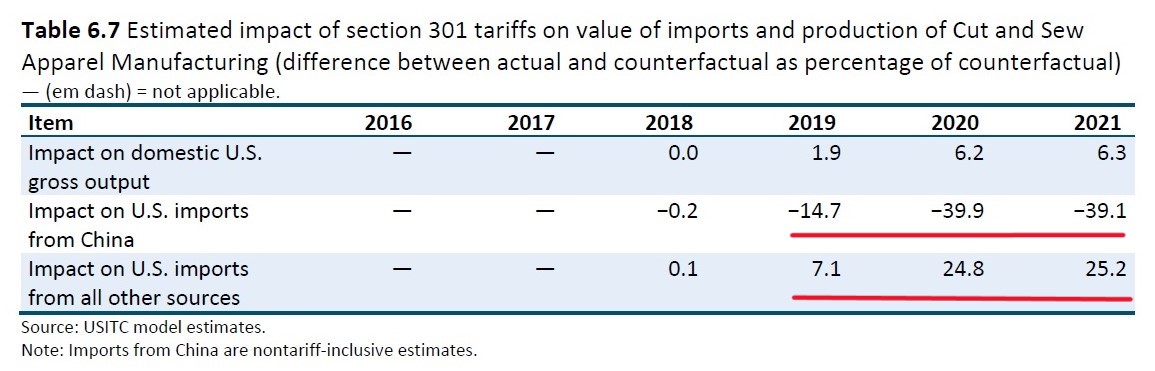
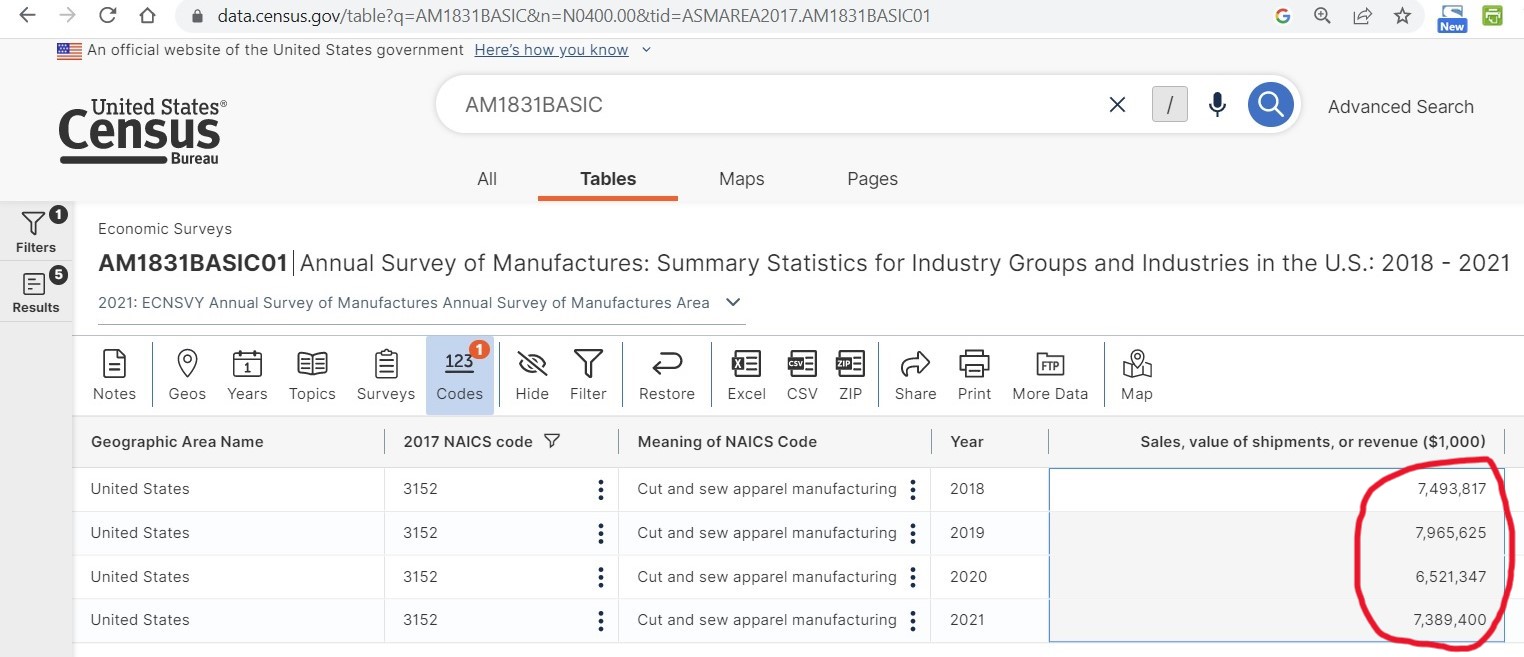


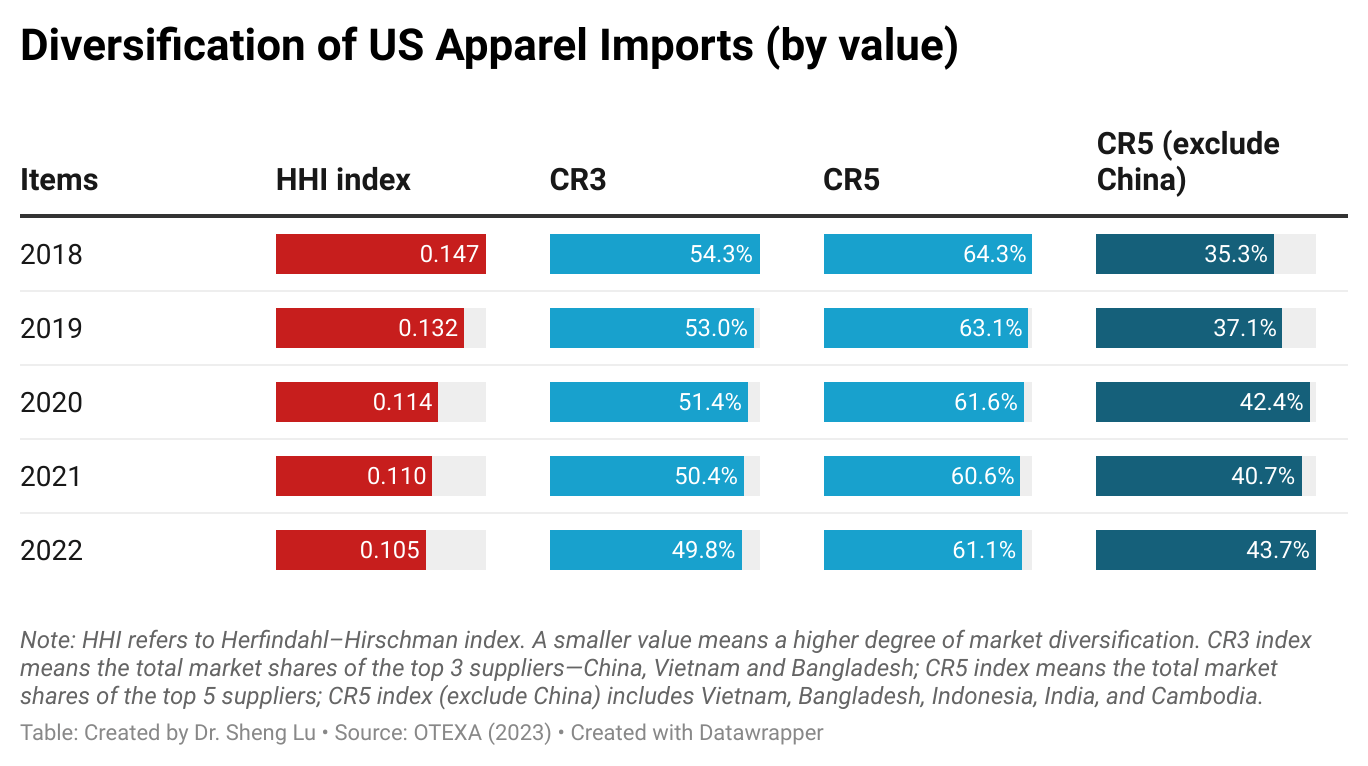

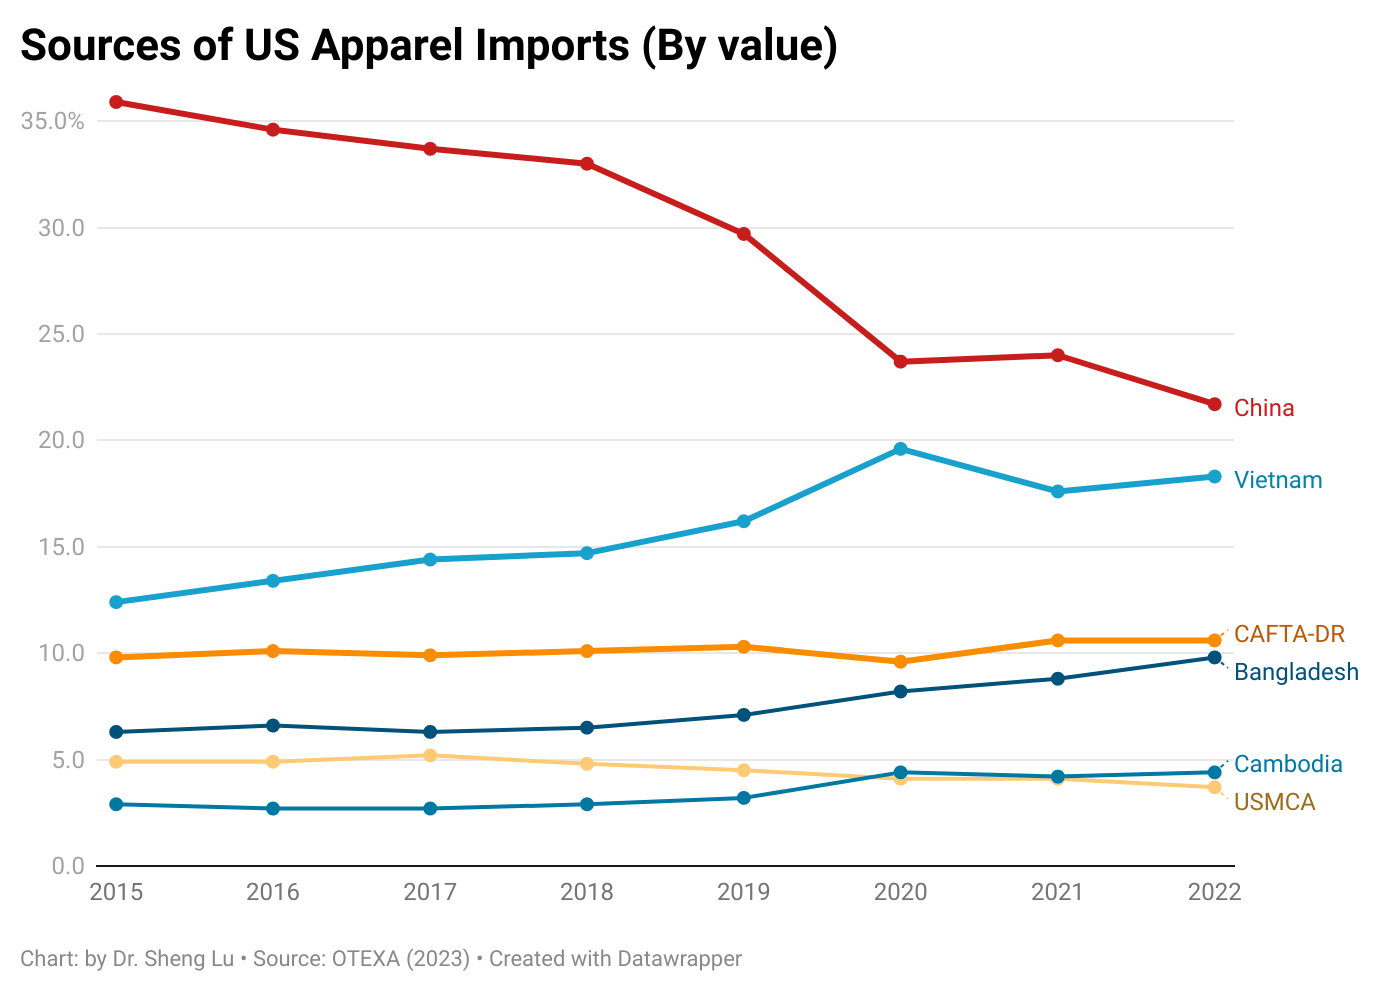
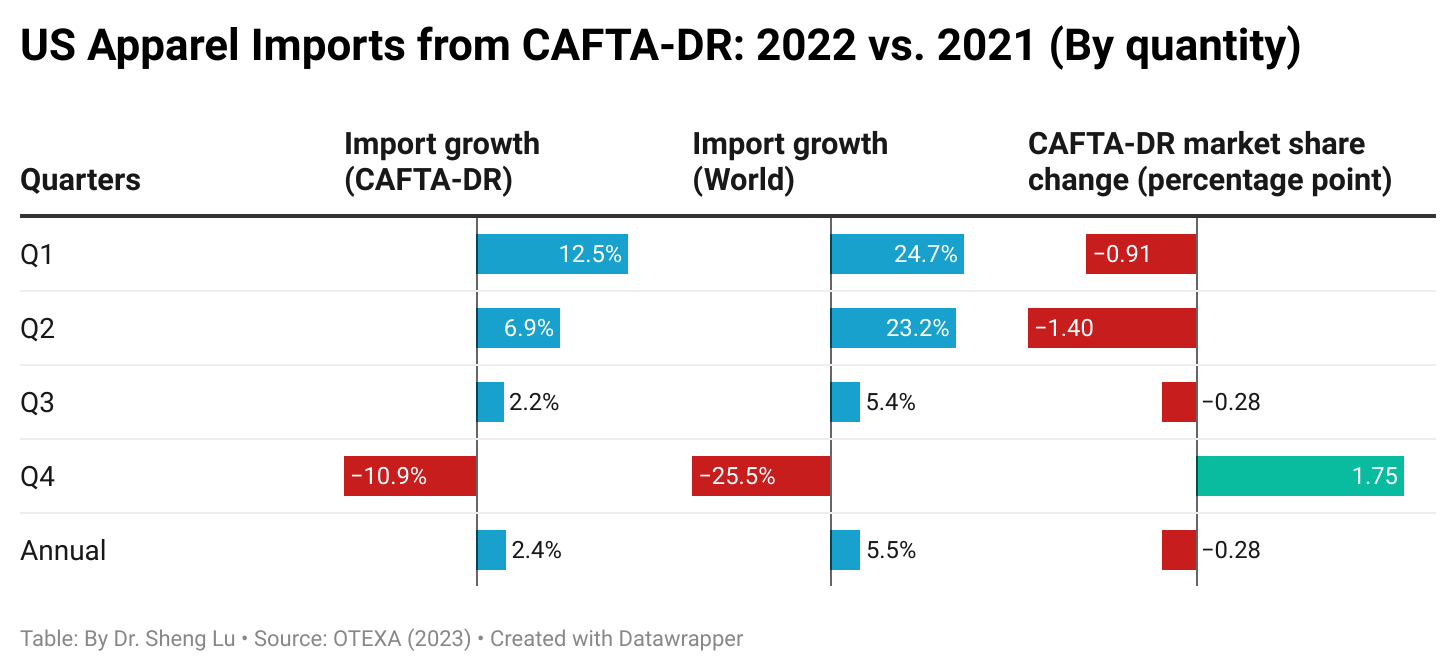
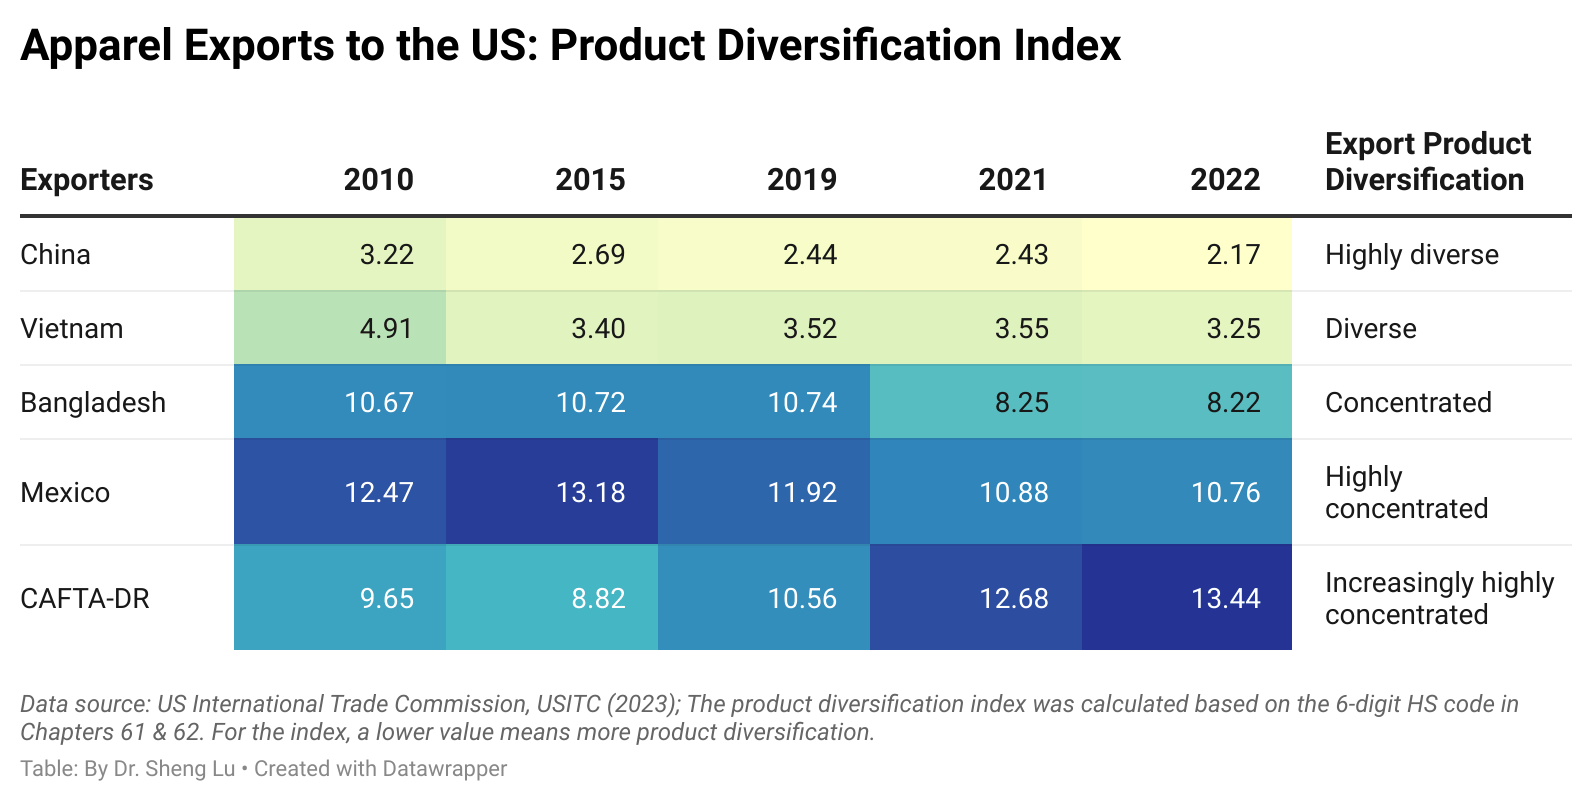
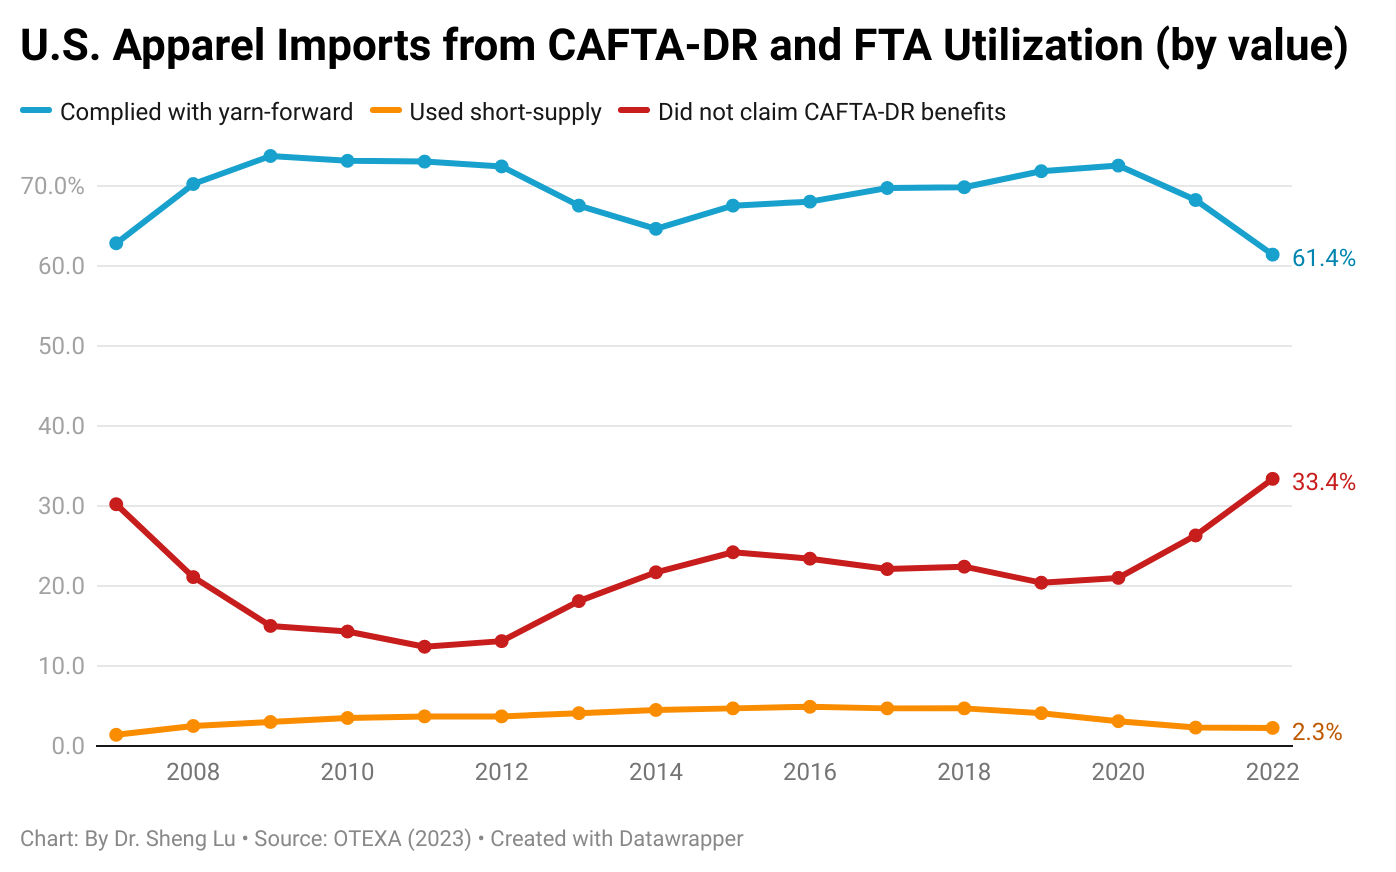
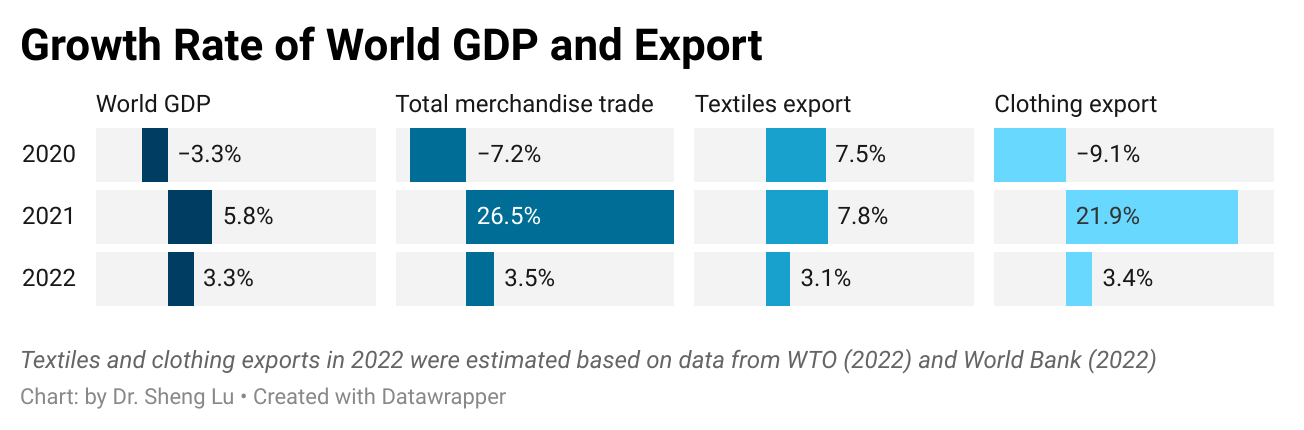

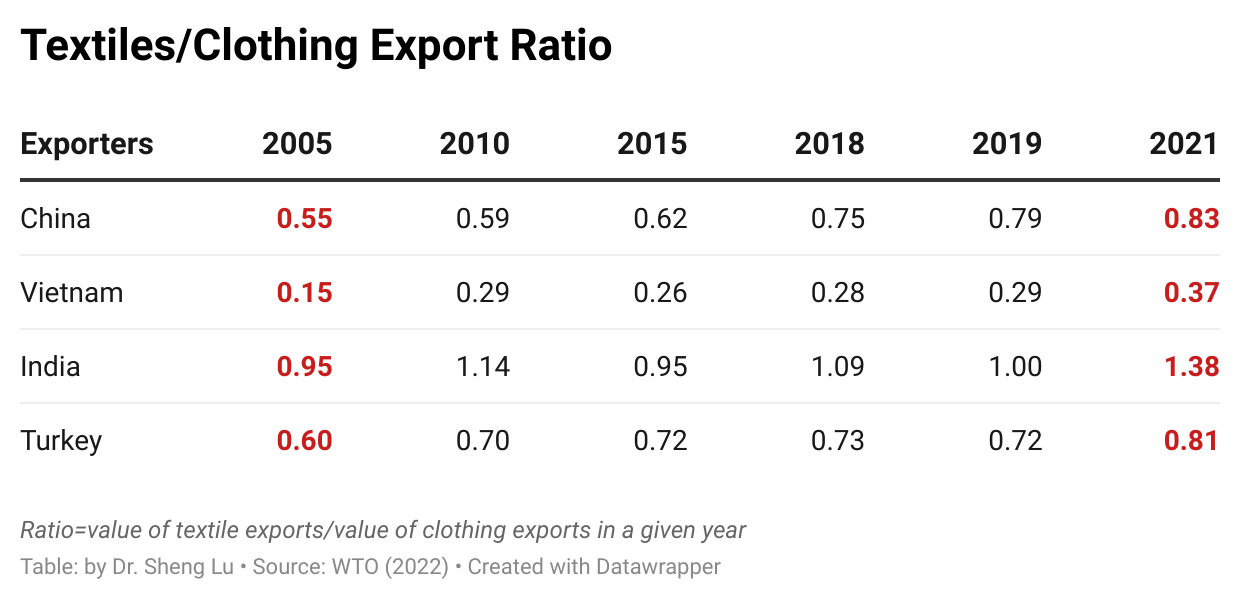


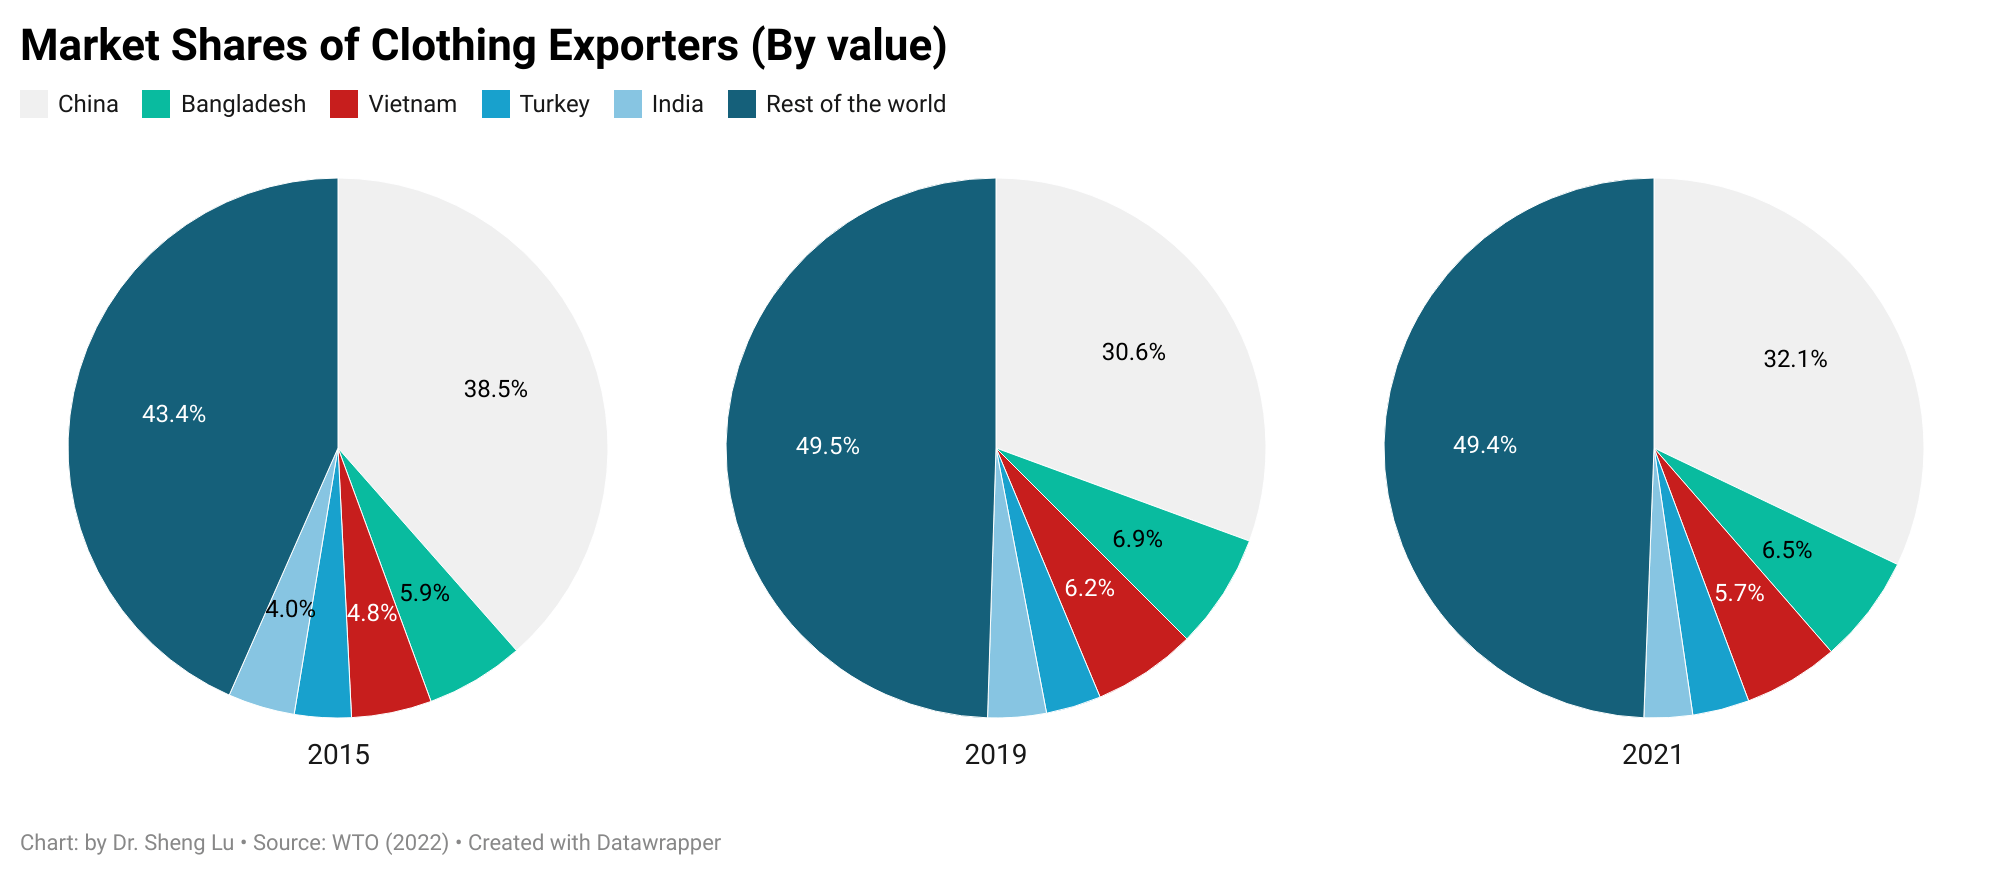

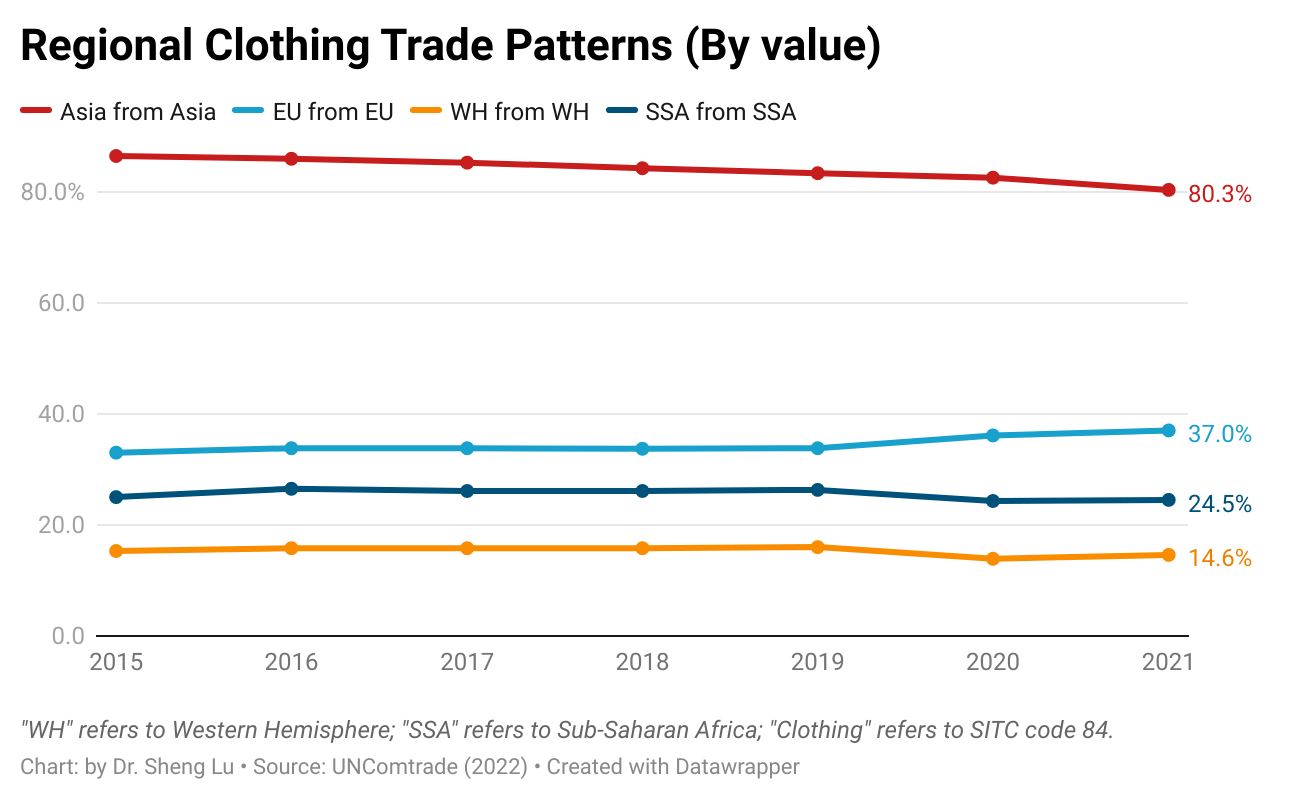
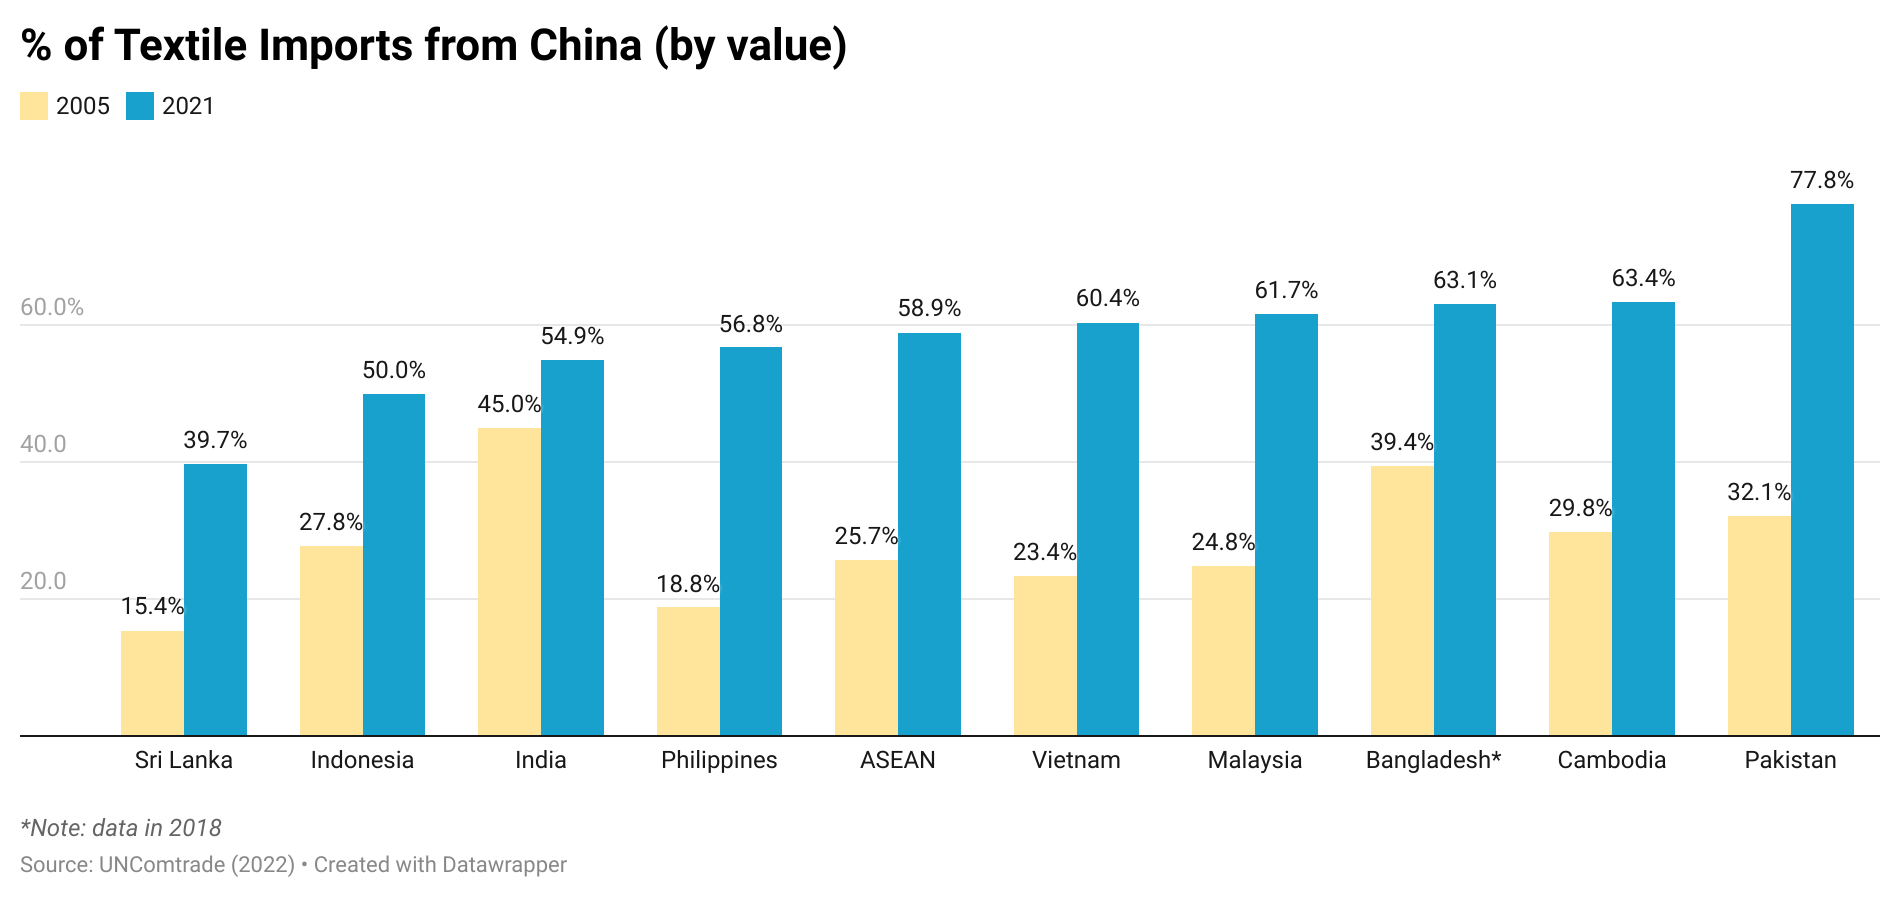


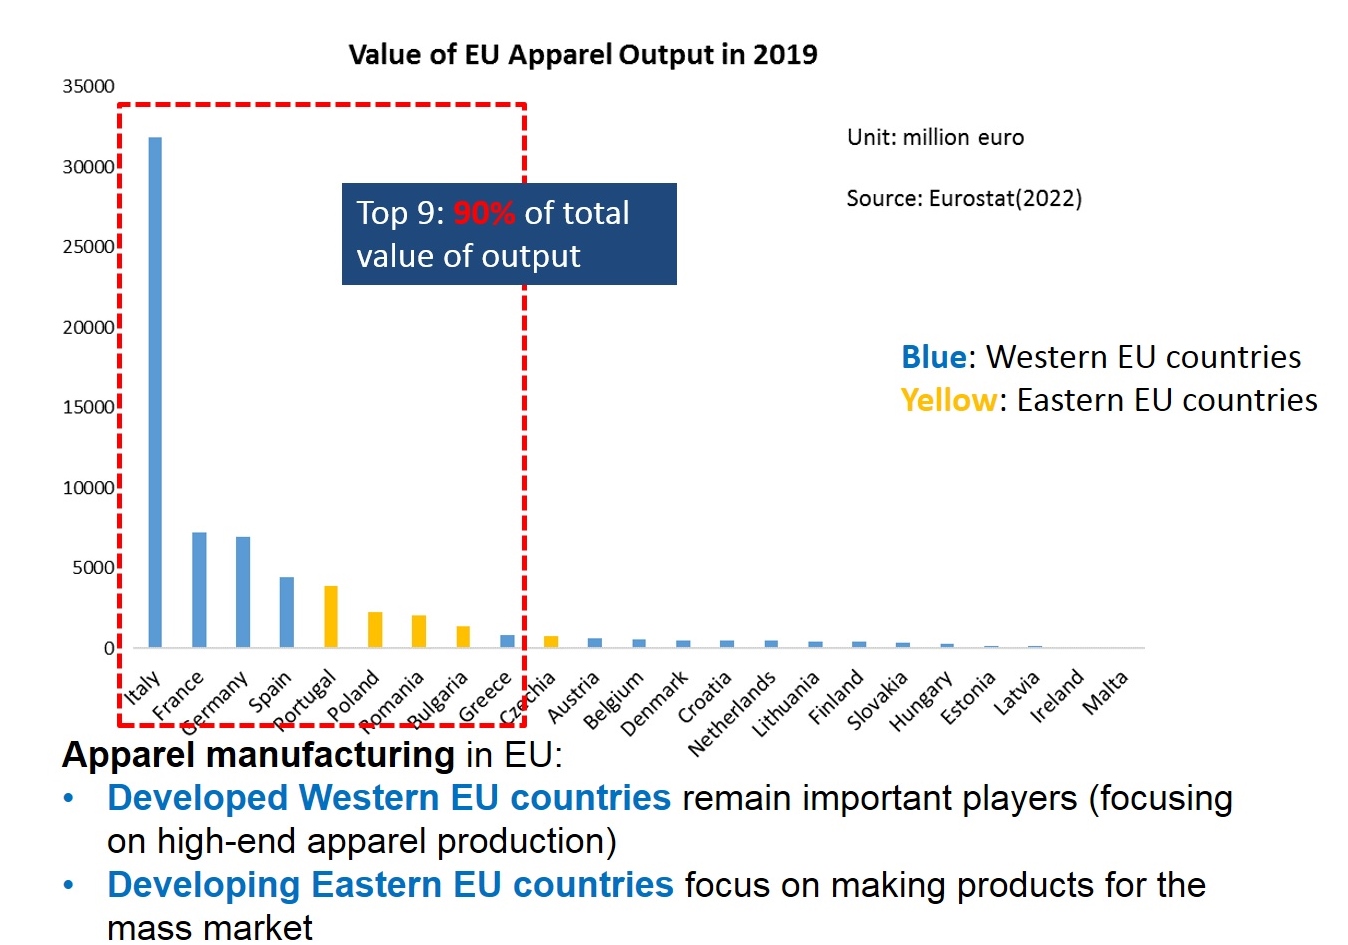
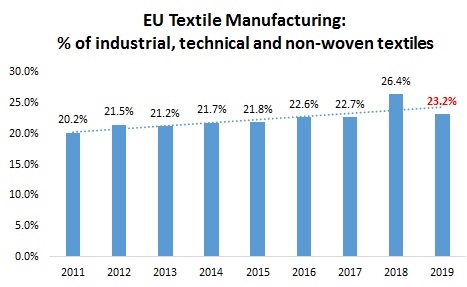

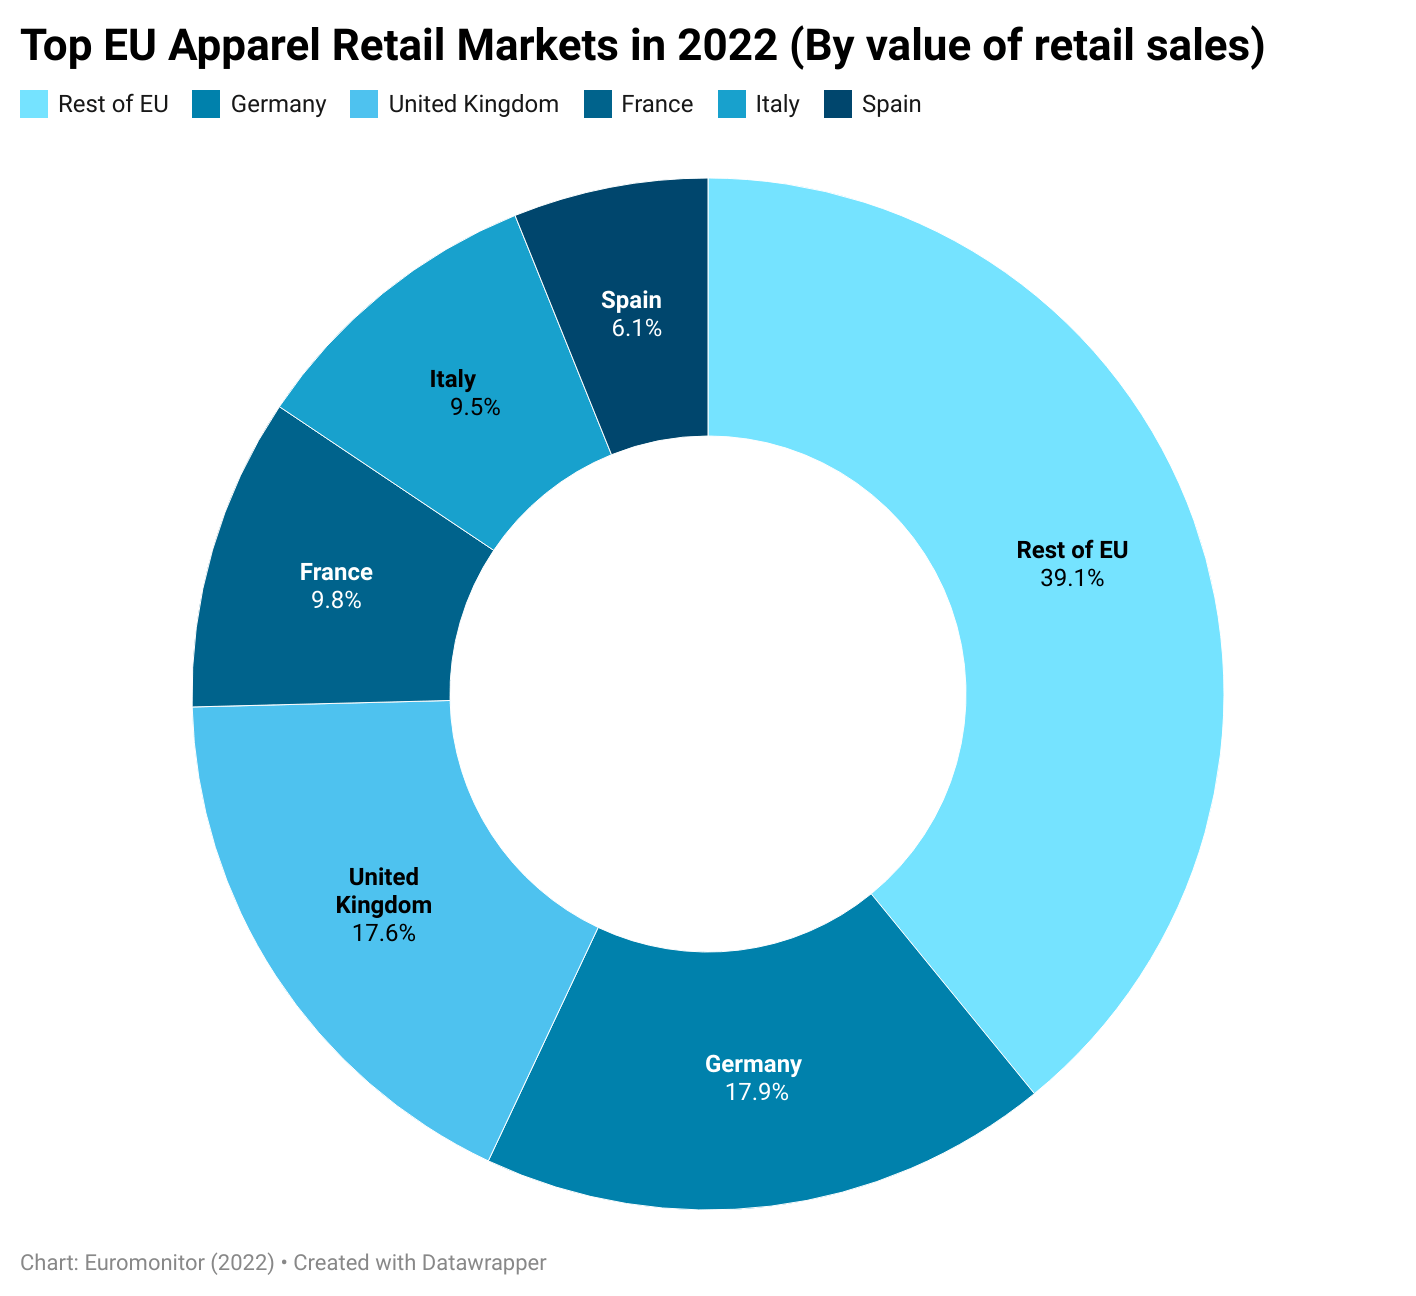
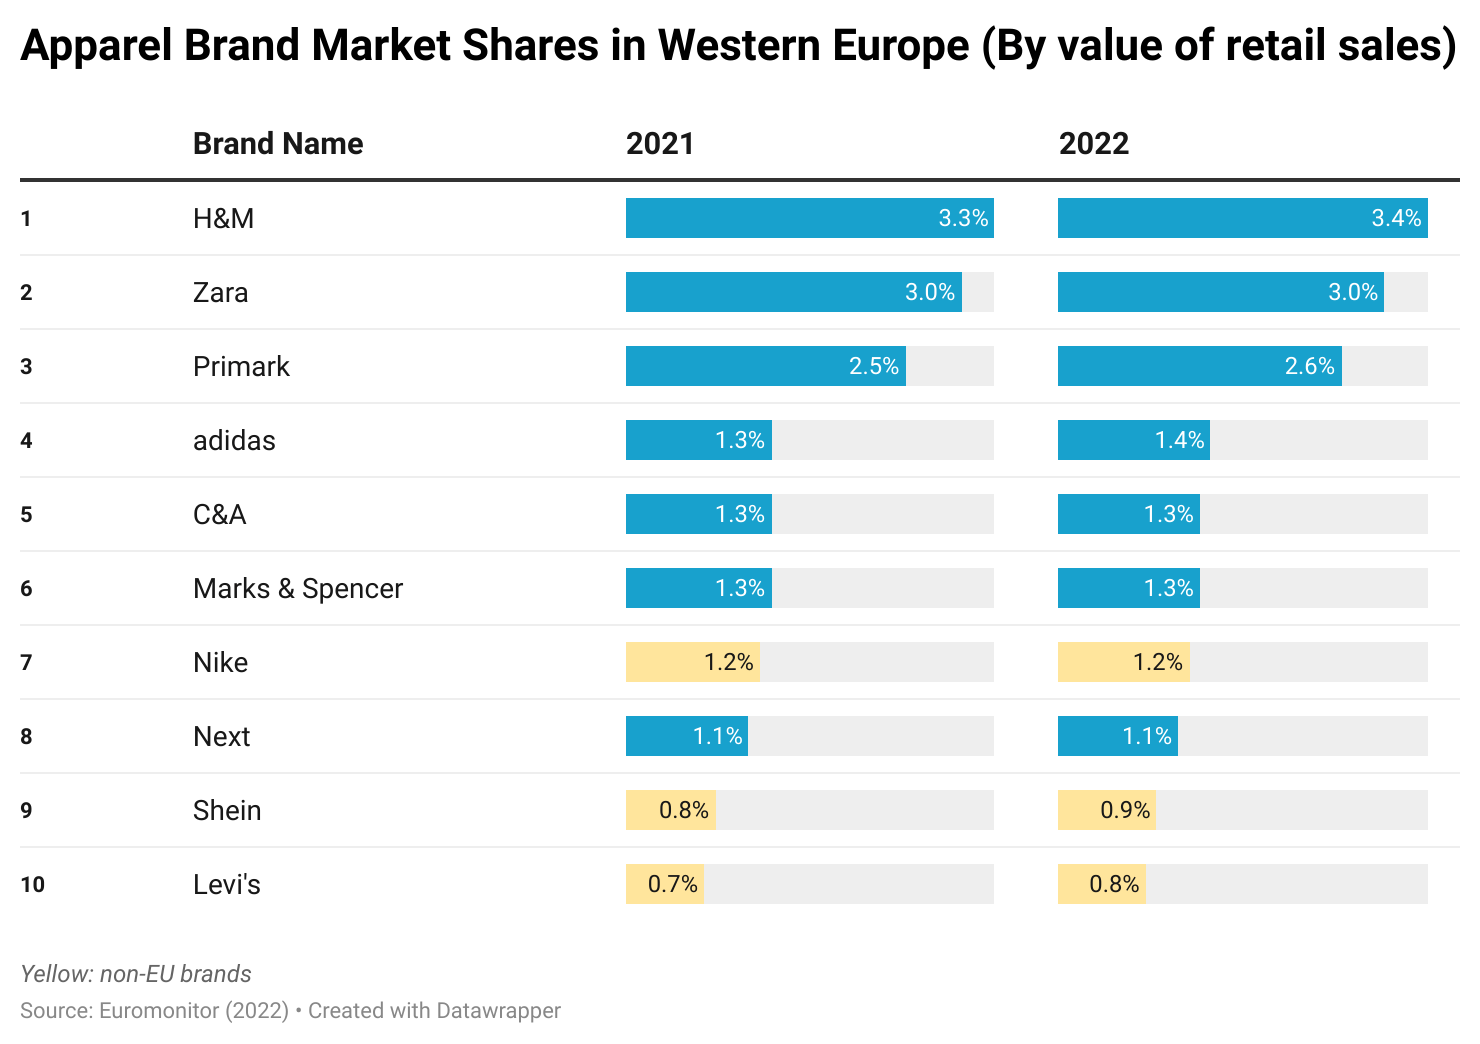

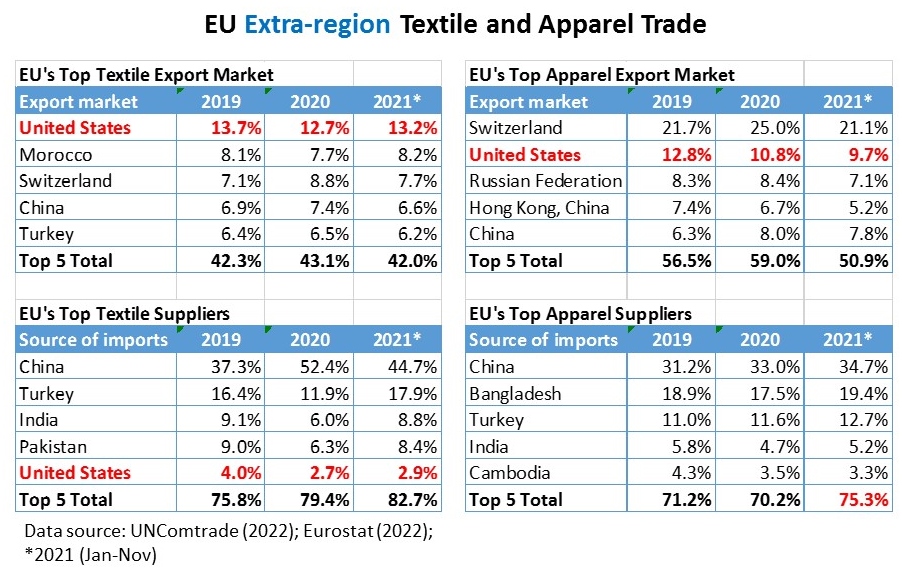
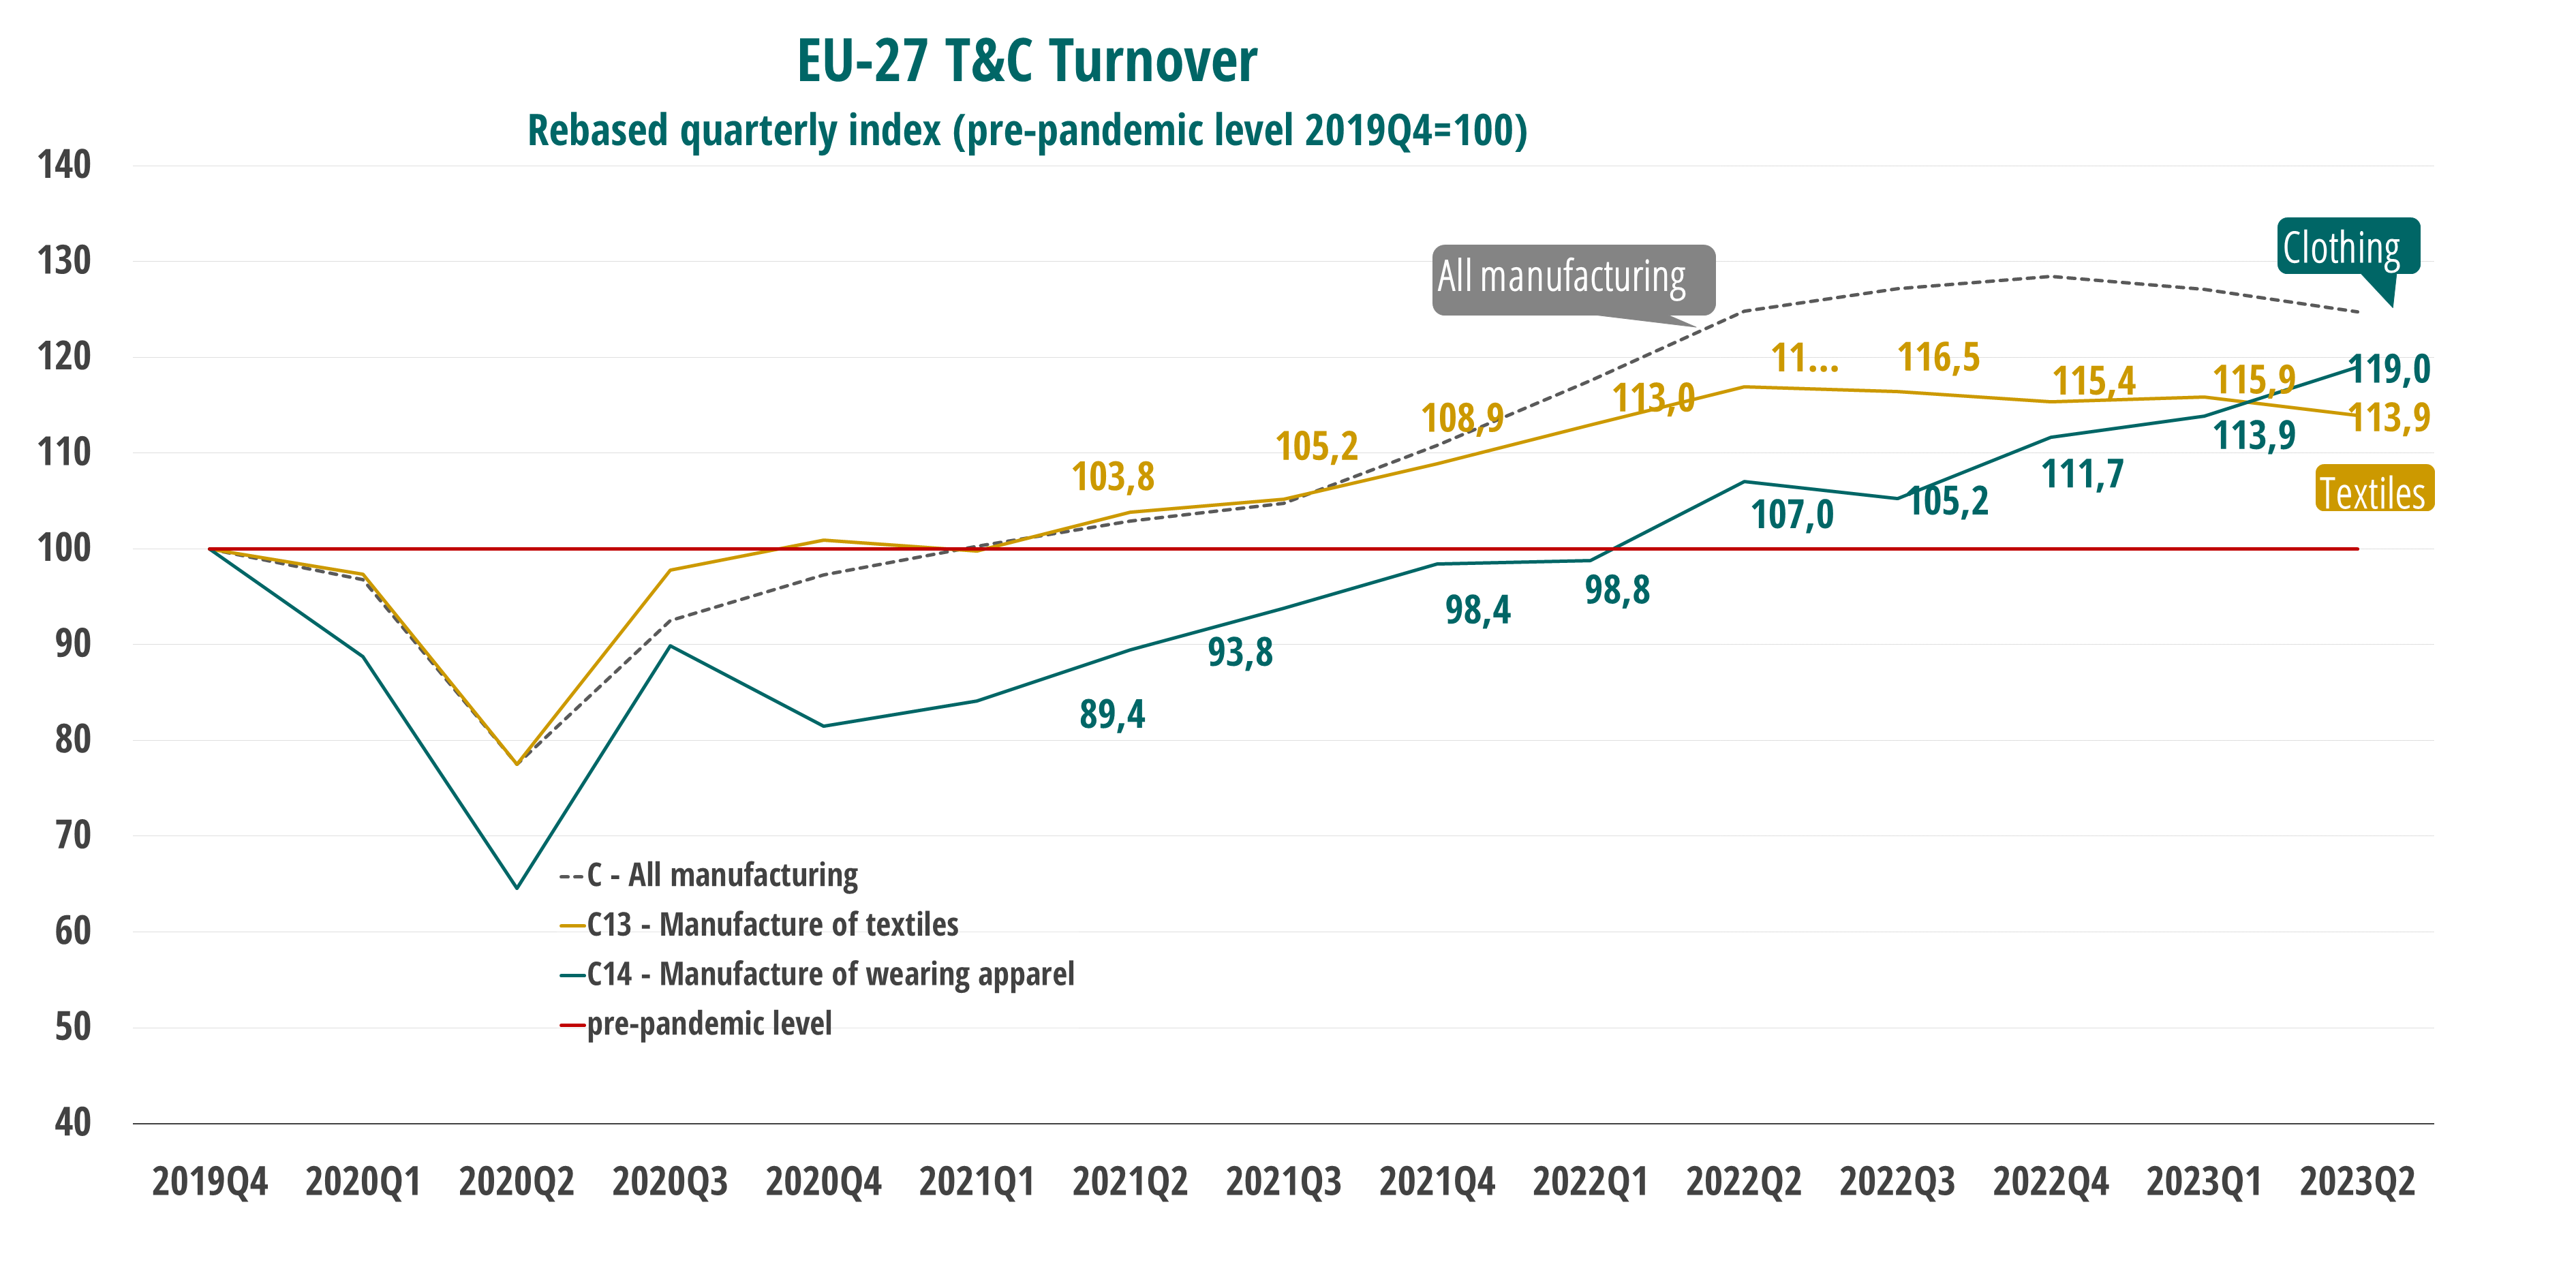
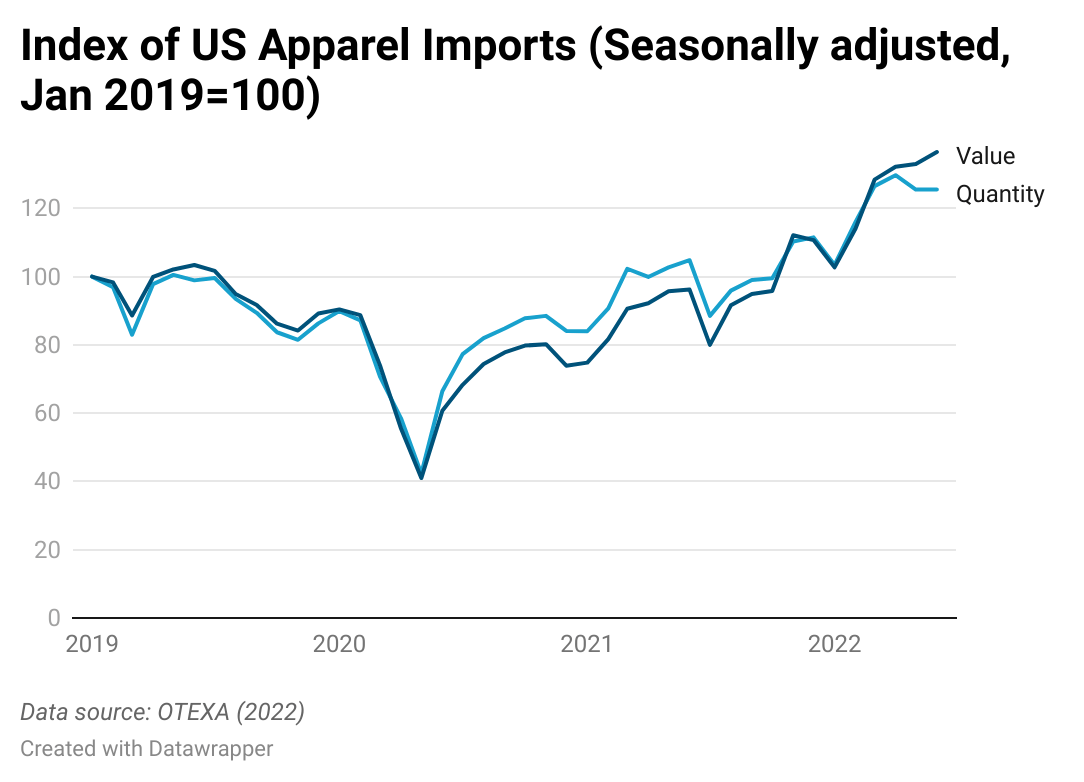

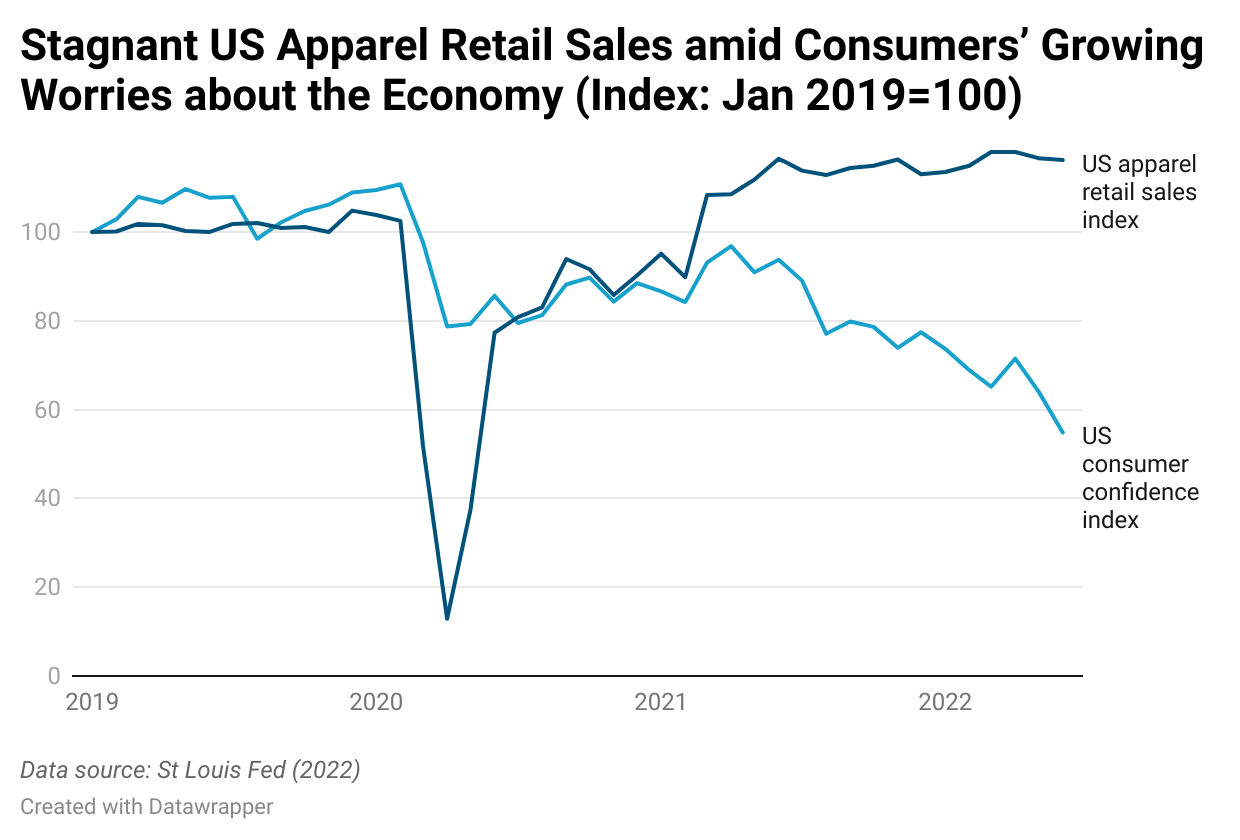
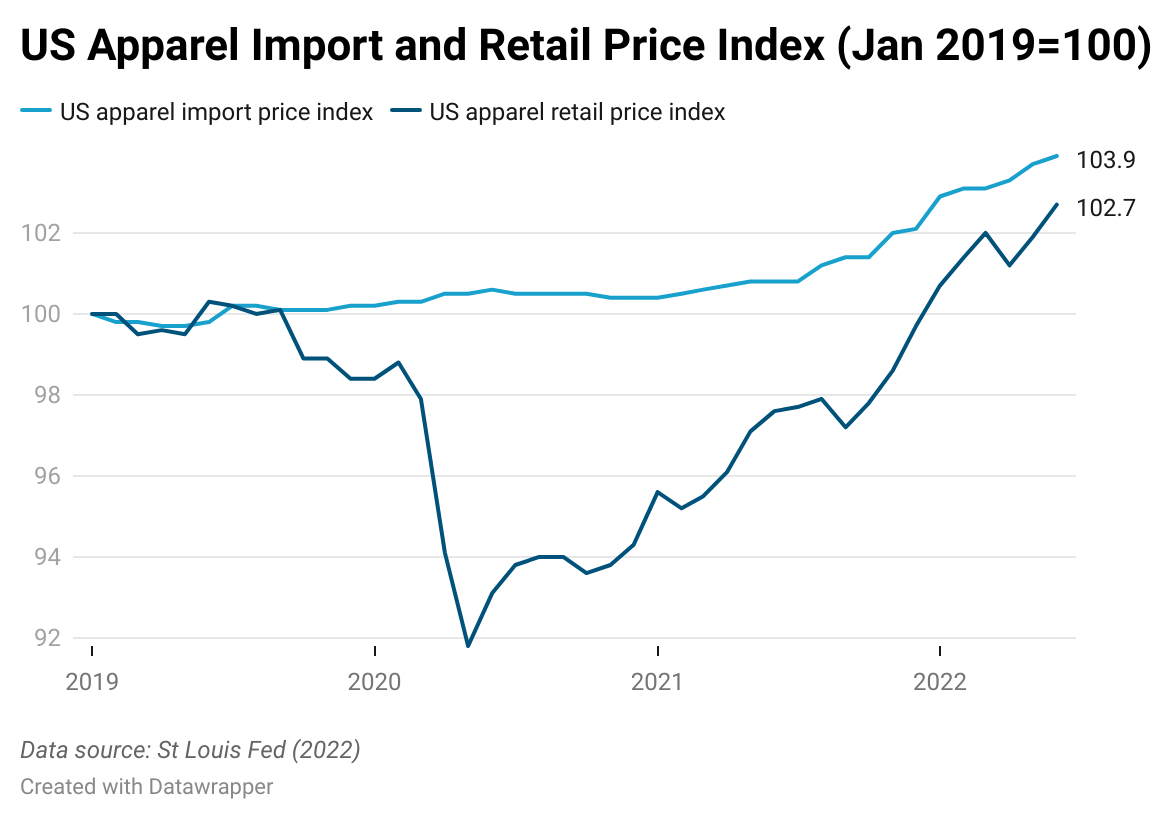
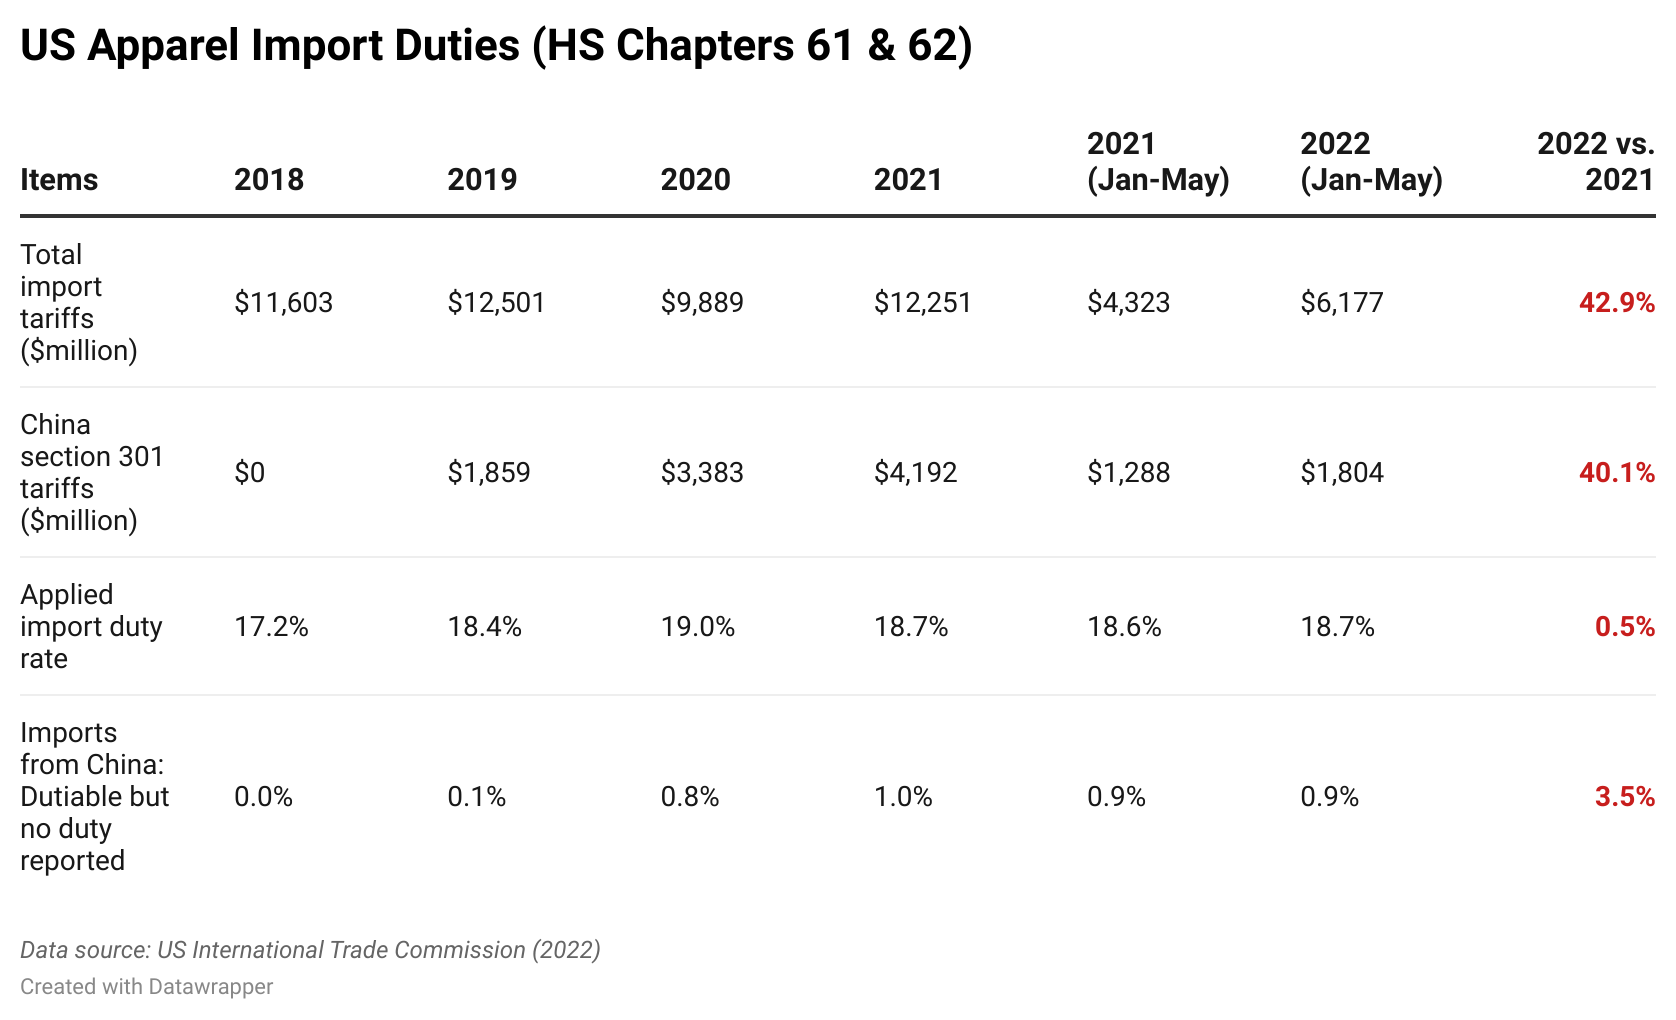
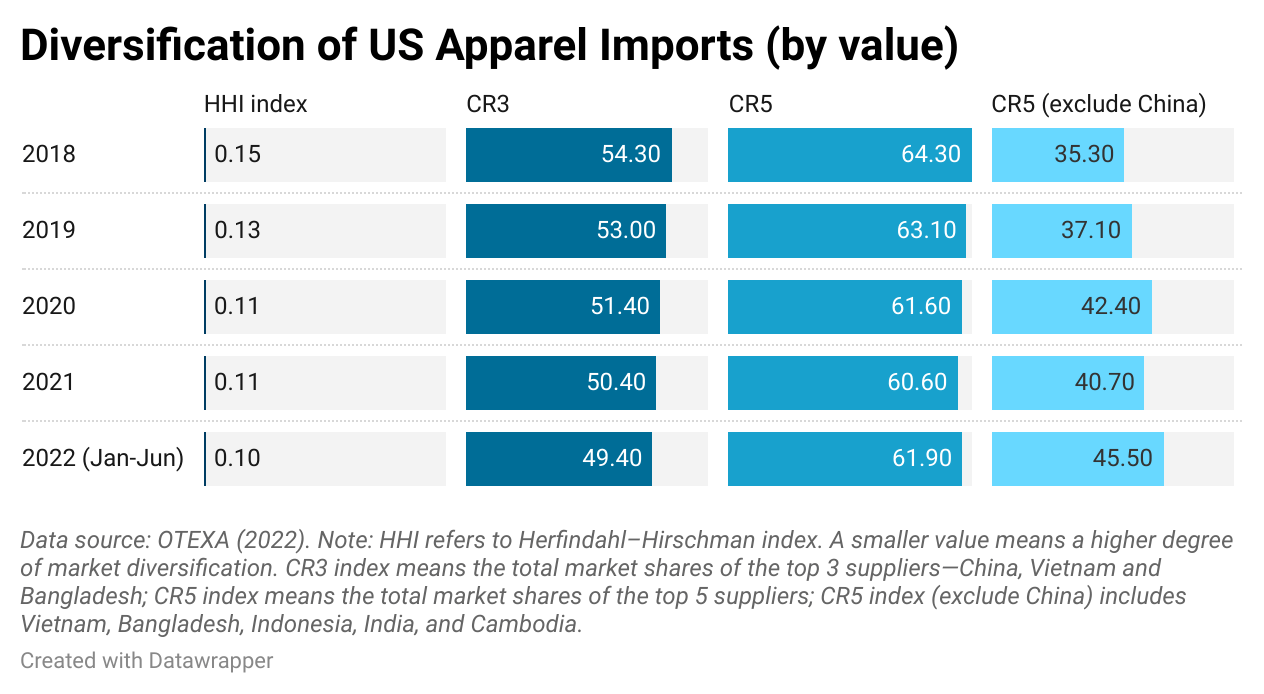
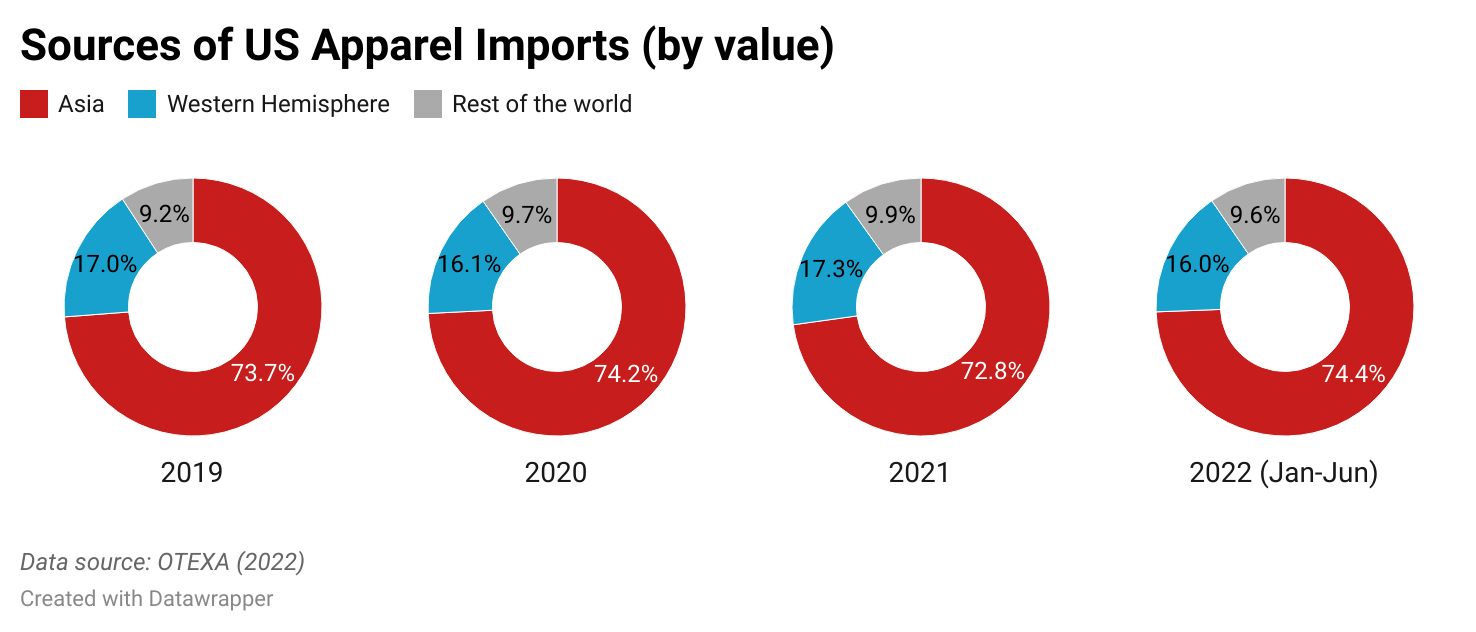
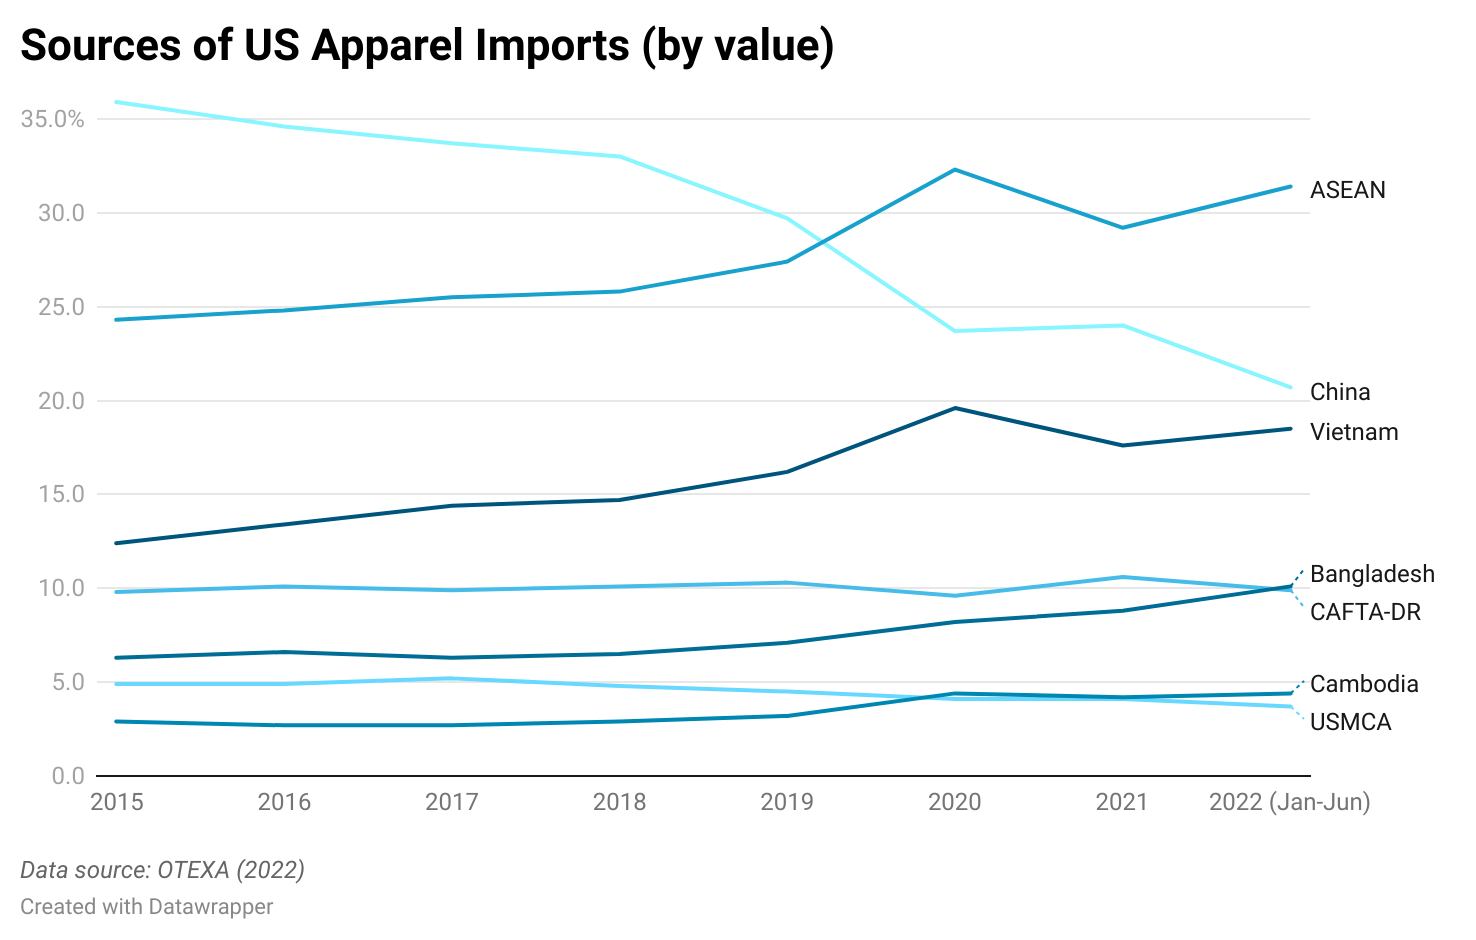

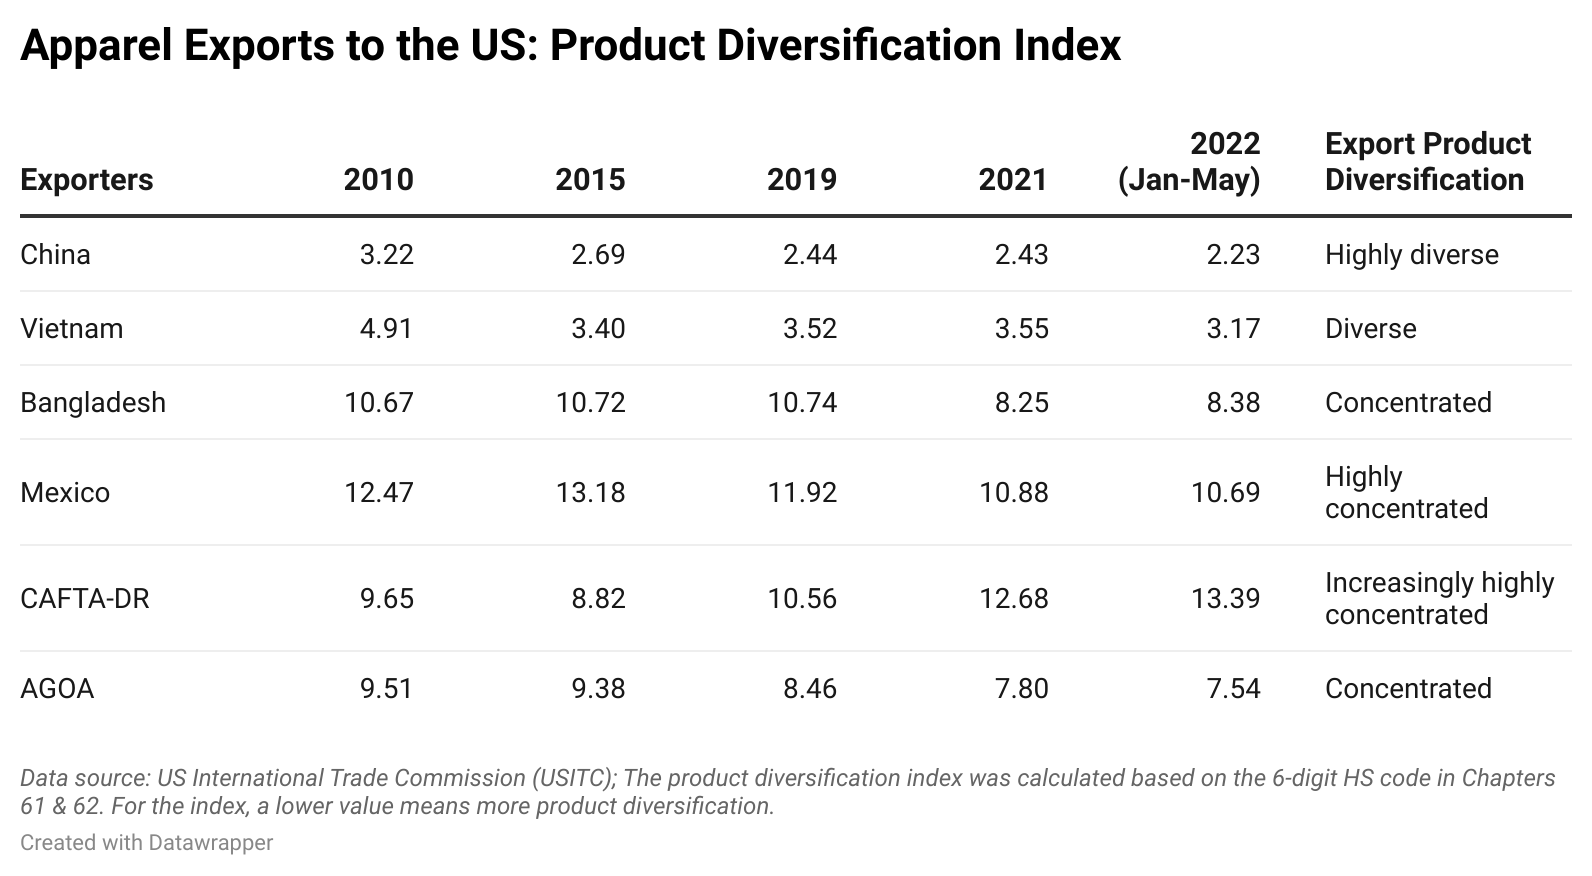
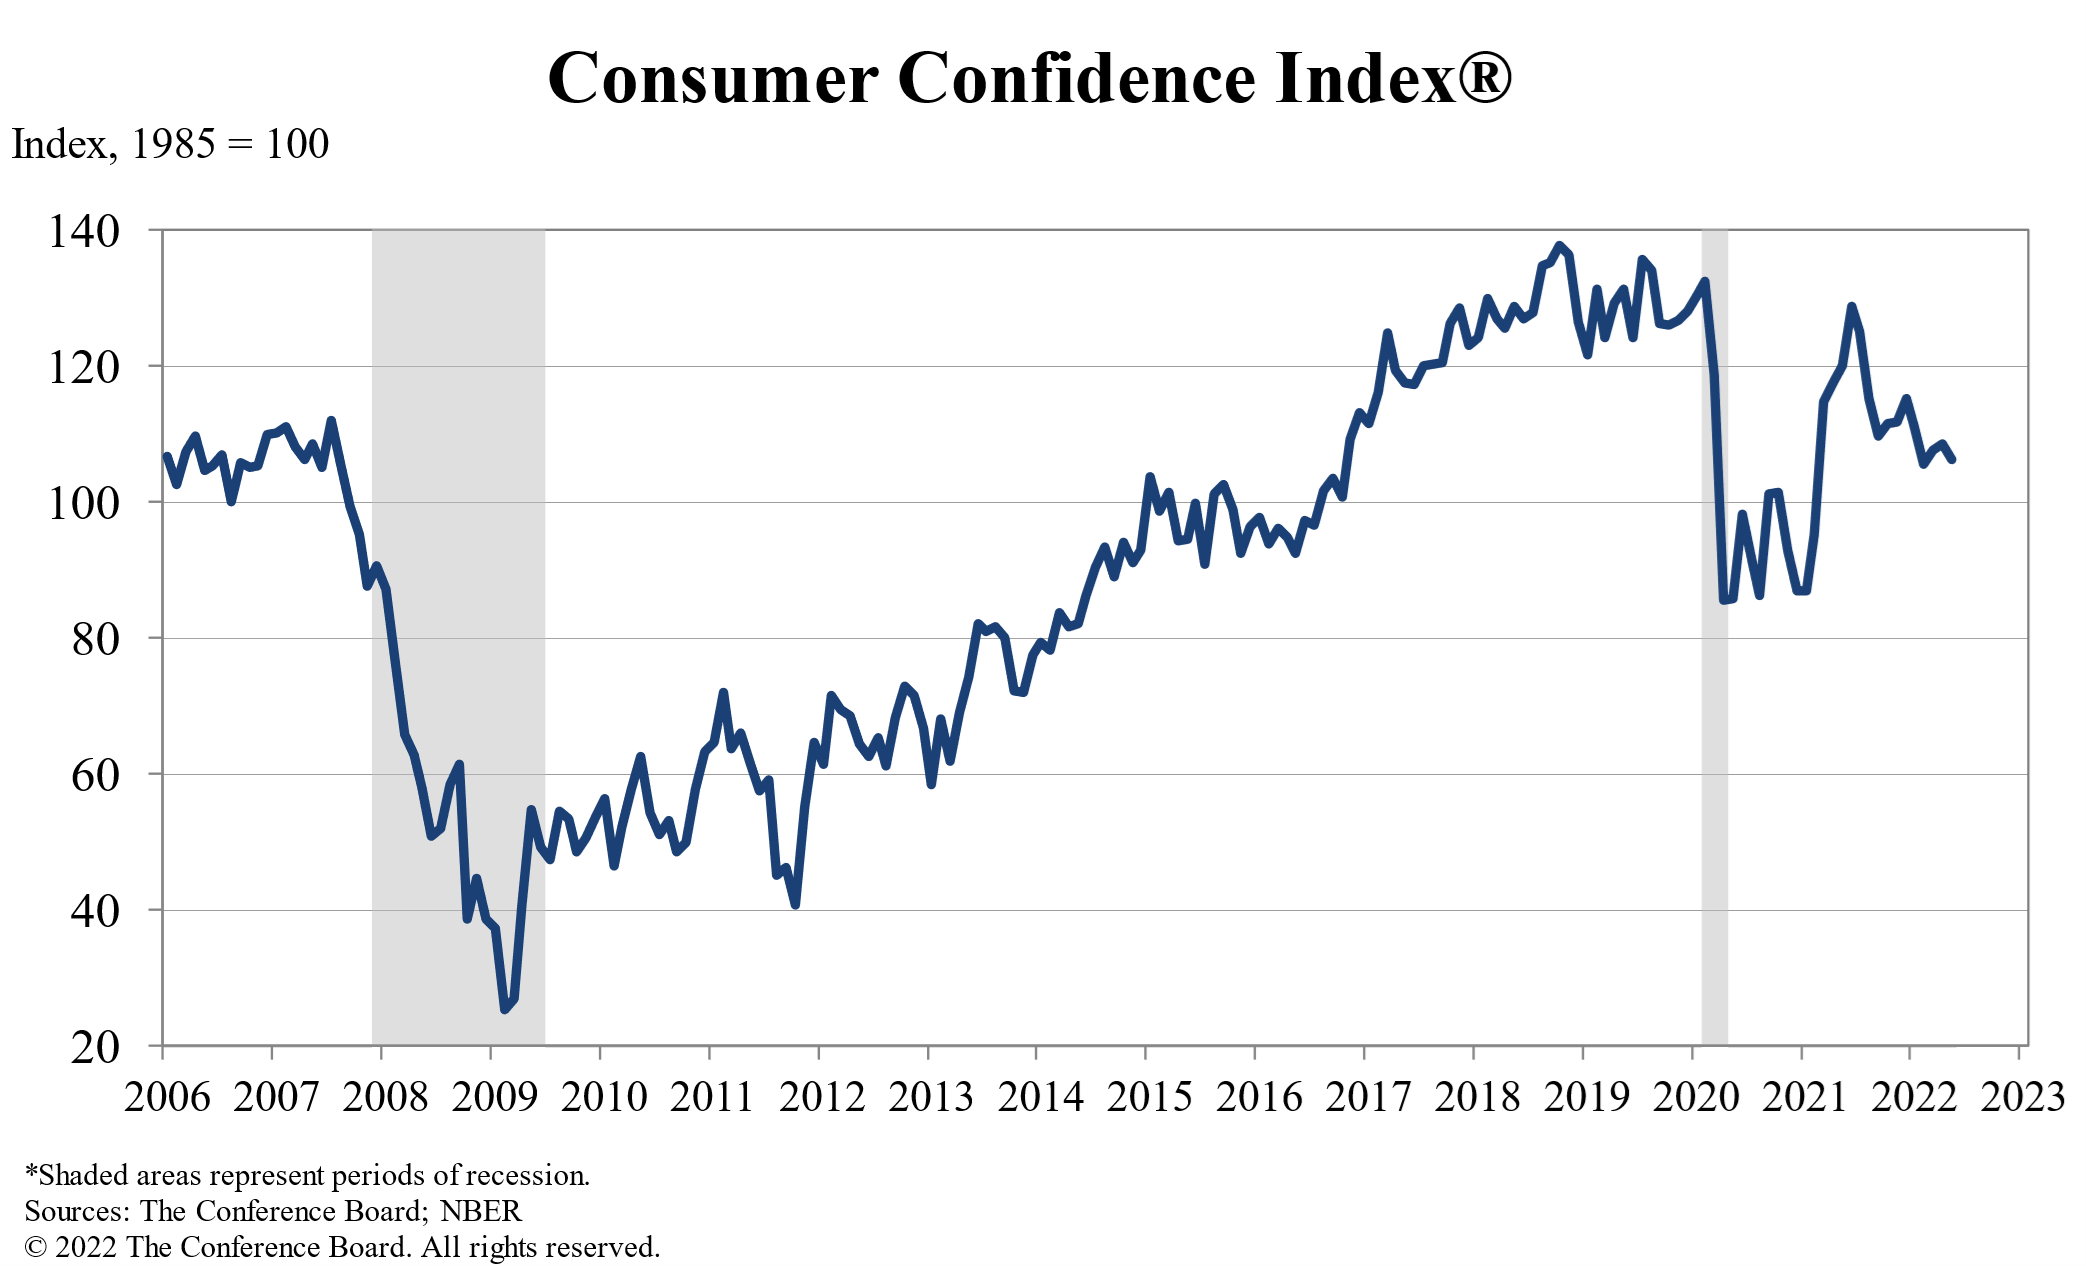


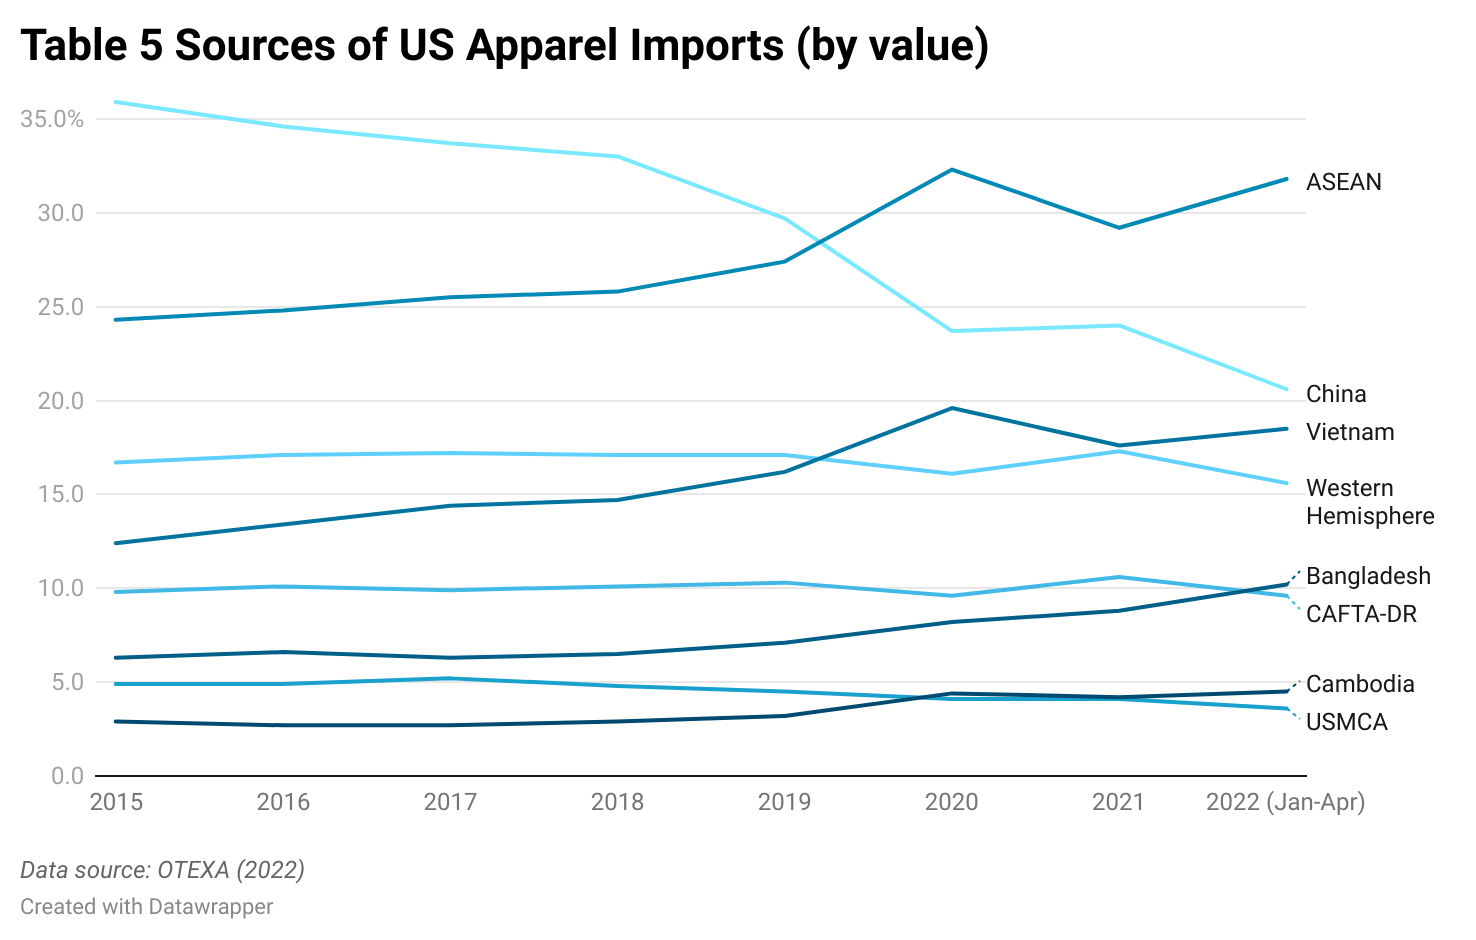
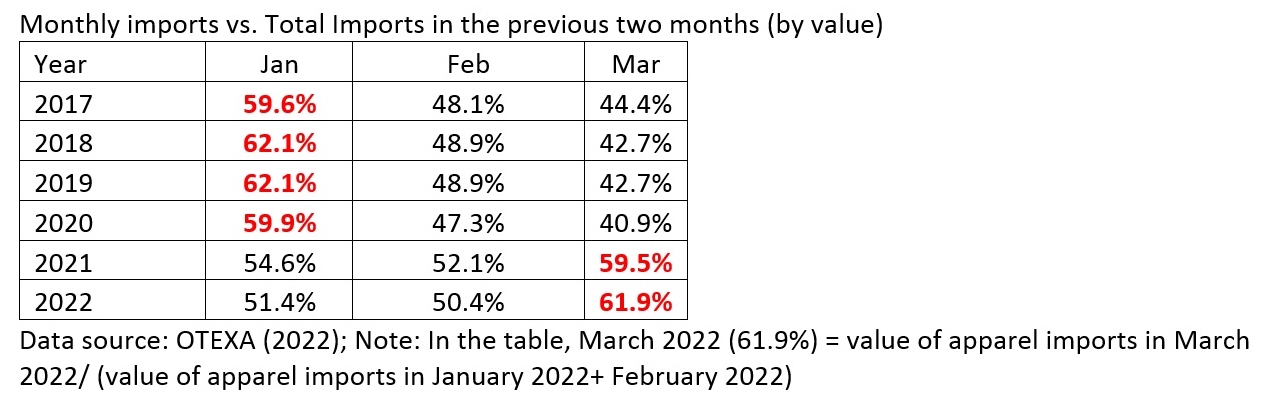

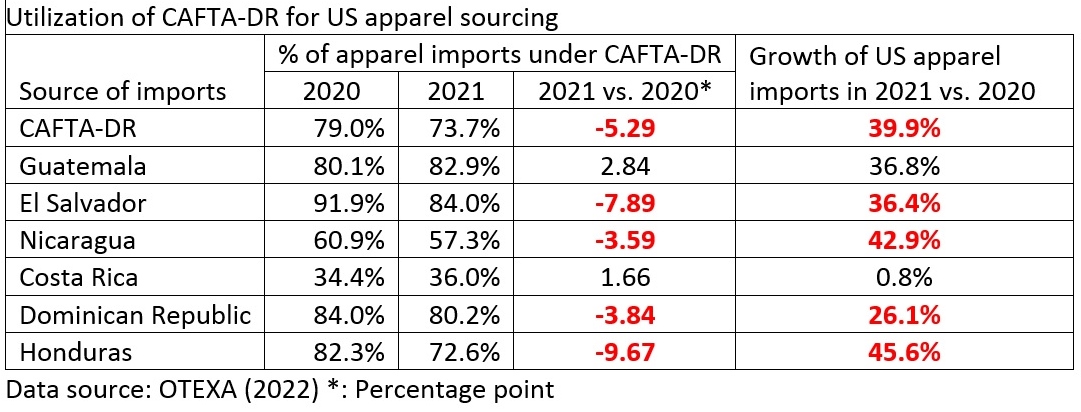

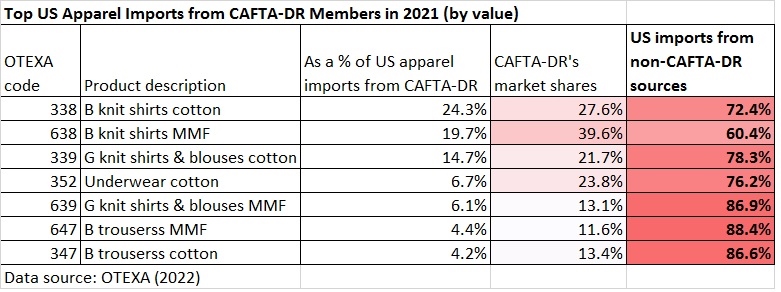

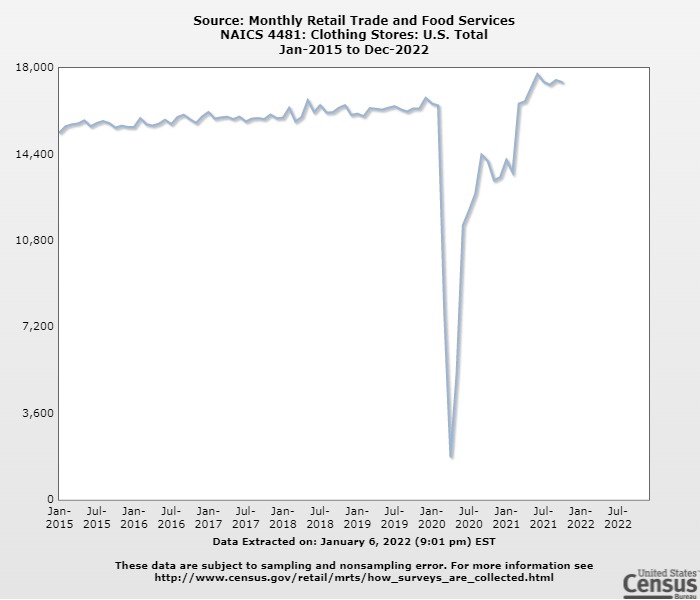
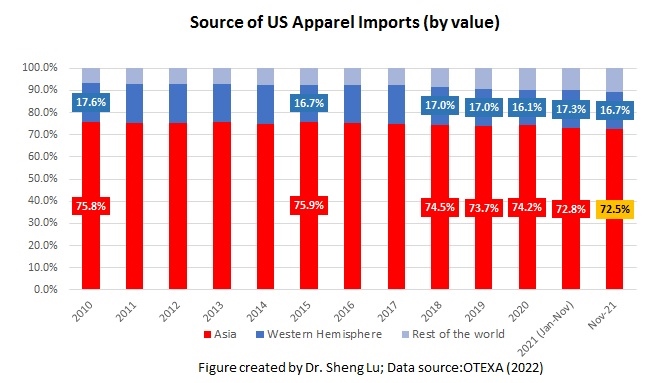


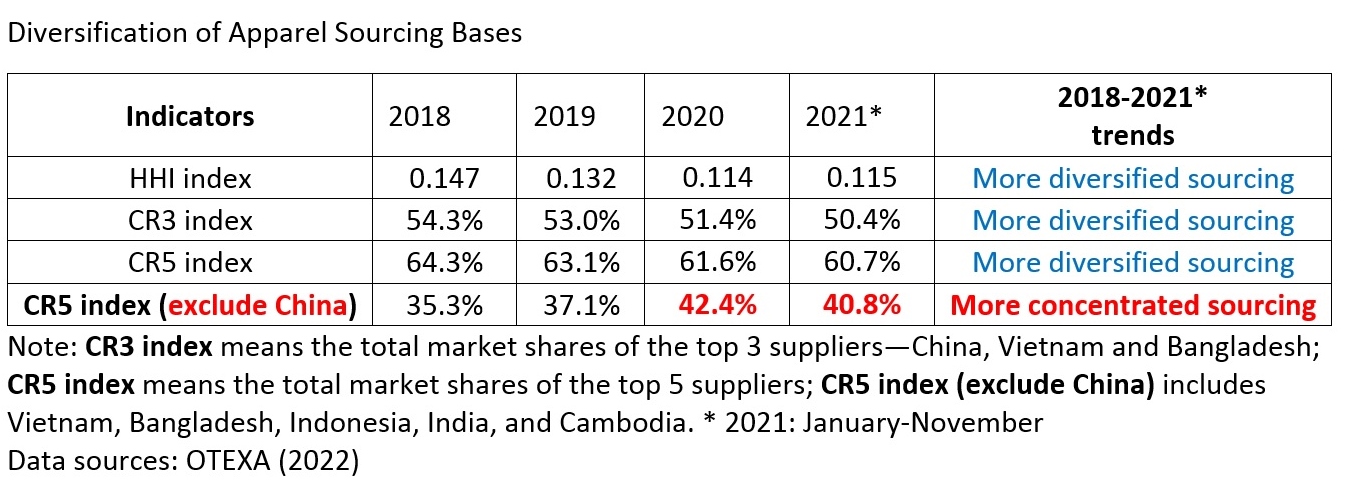


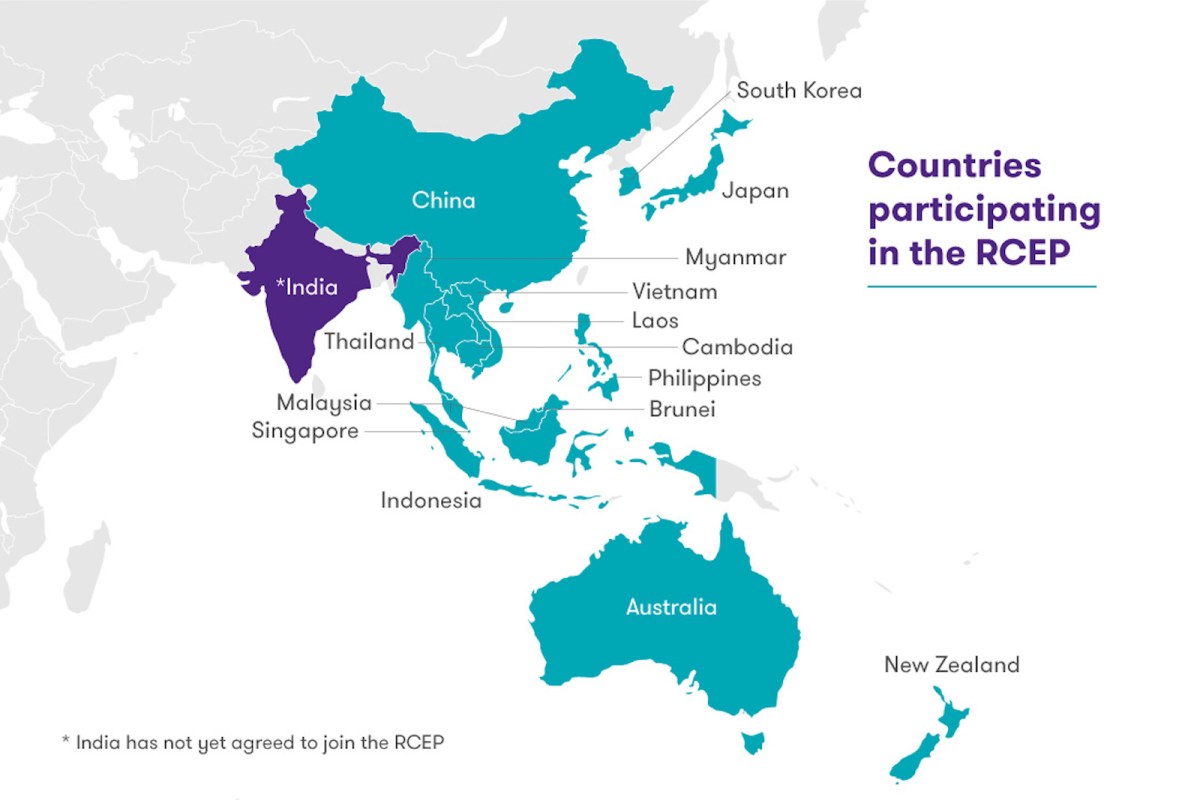

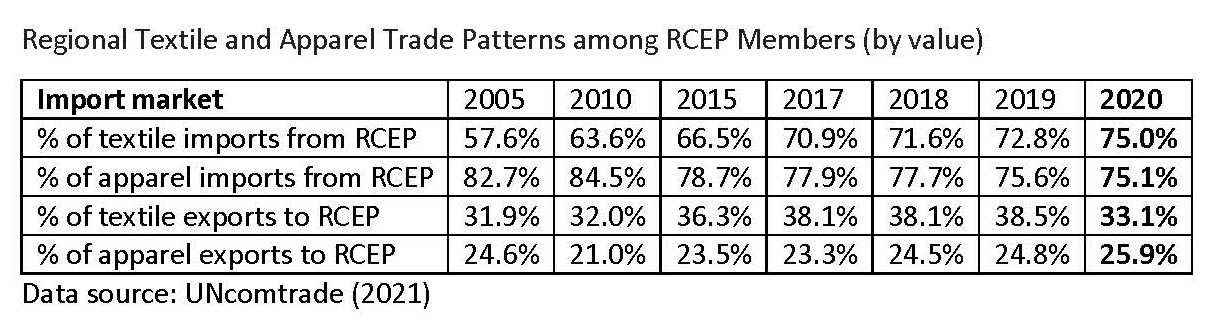
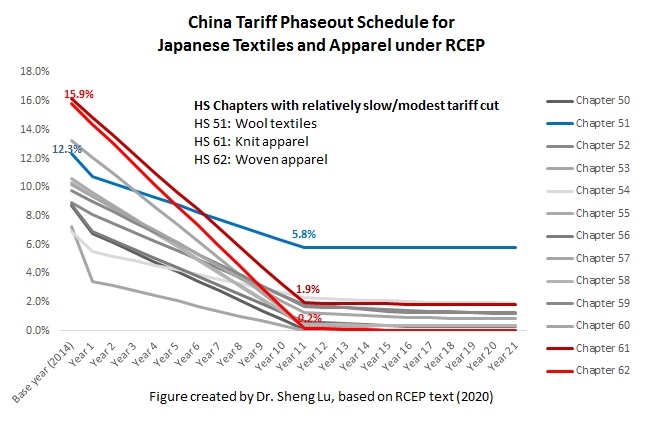
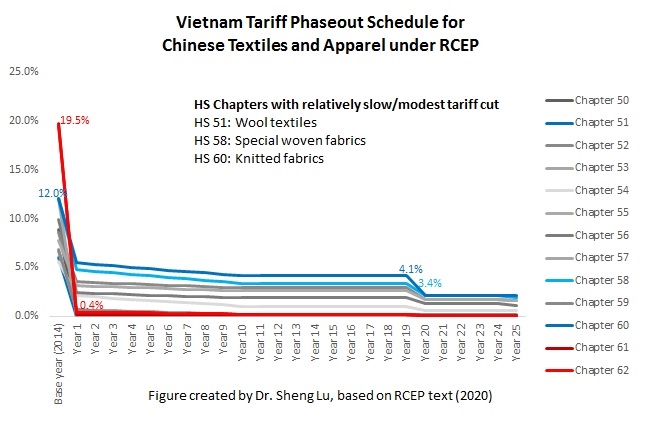


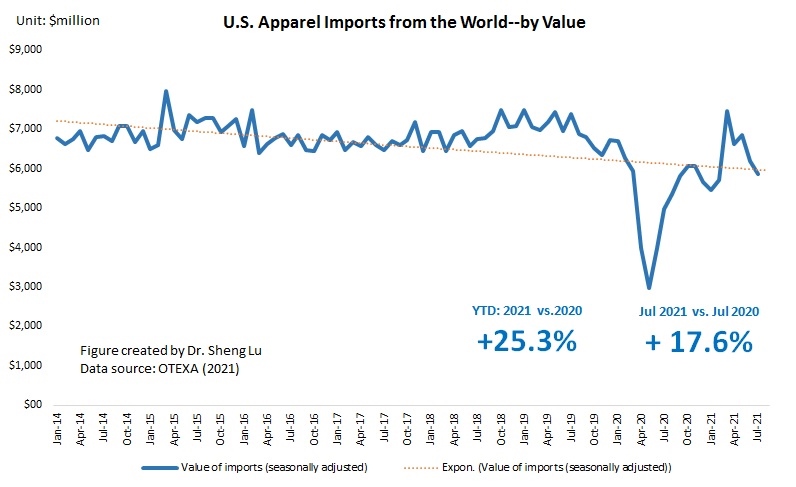
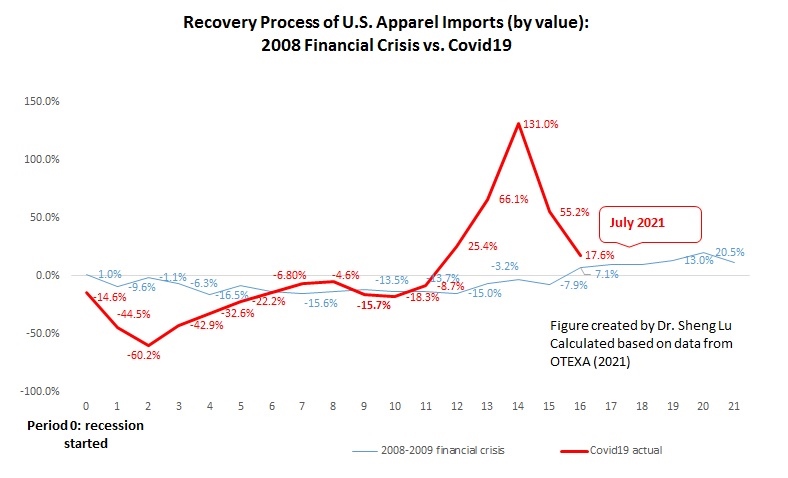
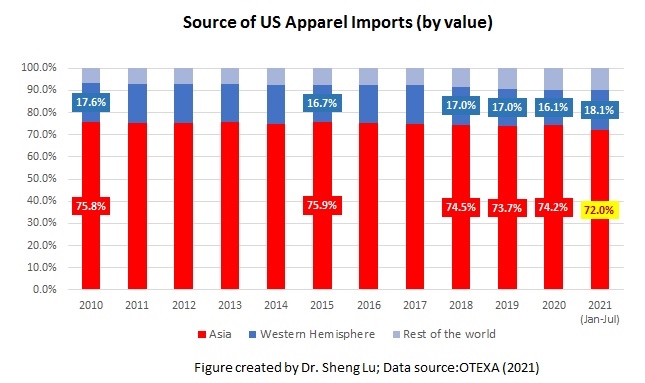
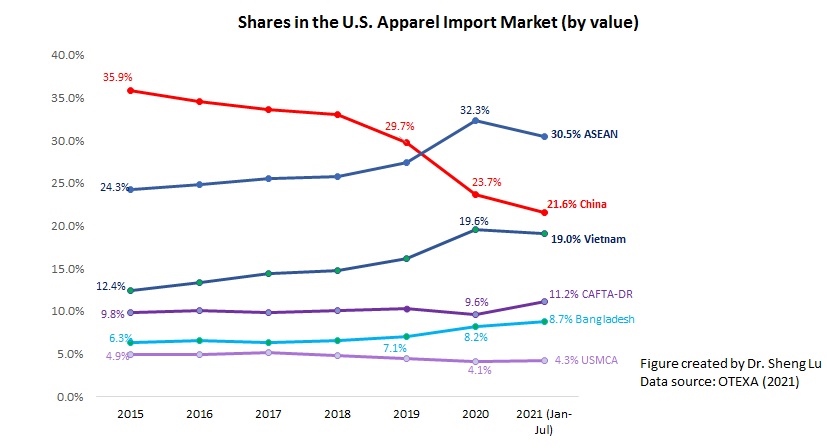


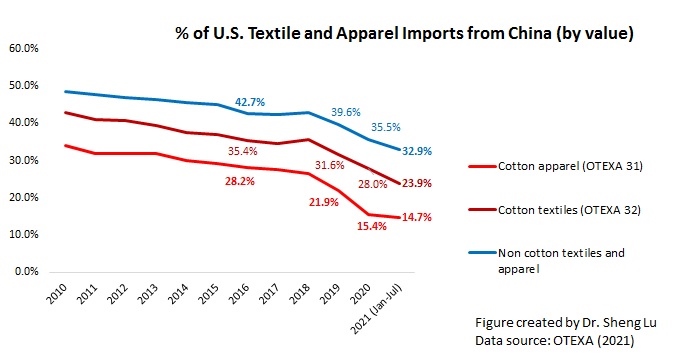
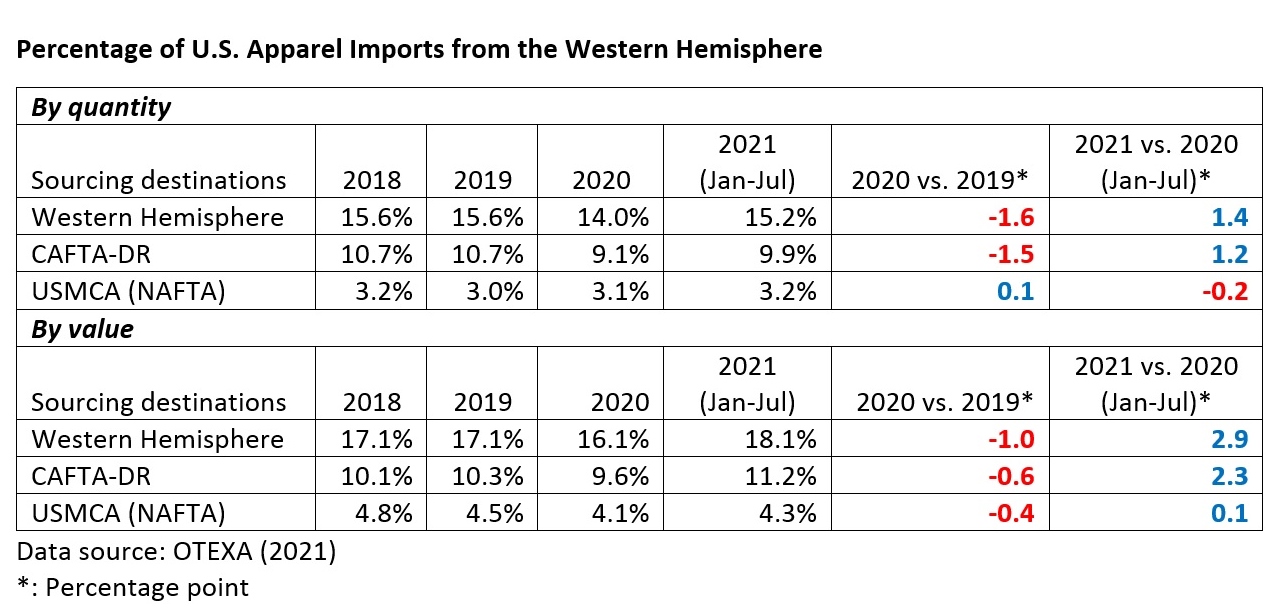
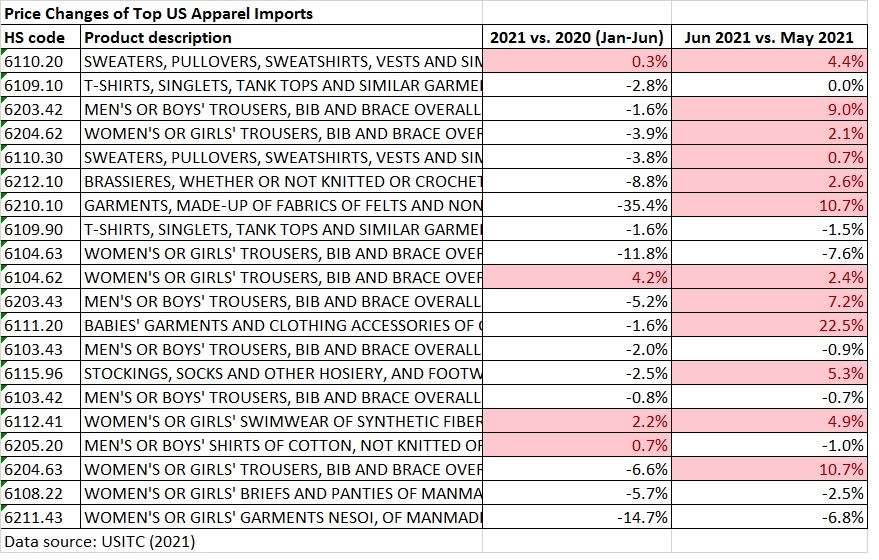


