Demystify the “Made in the USA” Apparel Sourcing Strategy

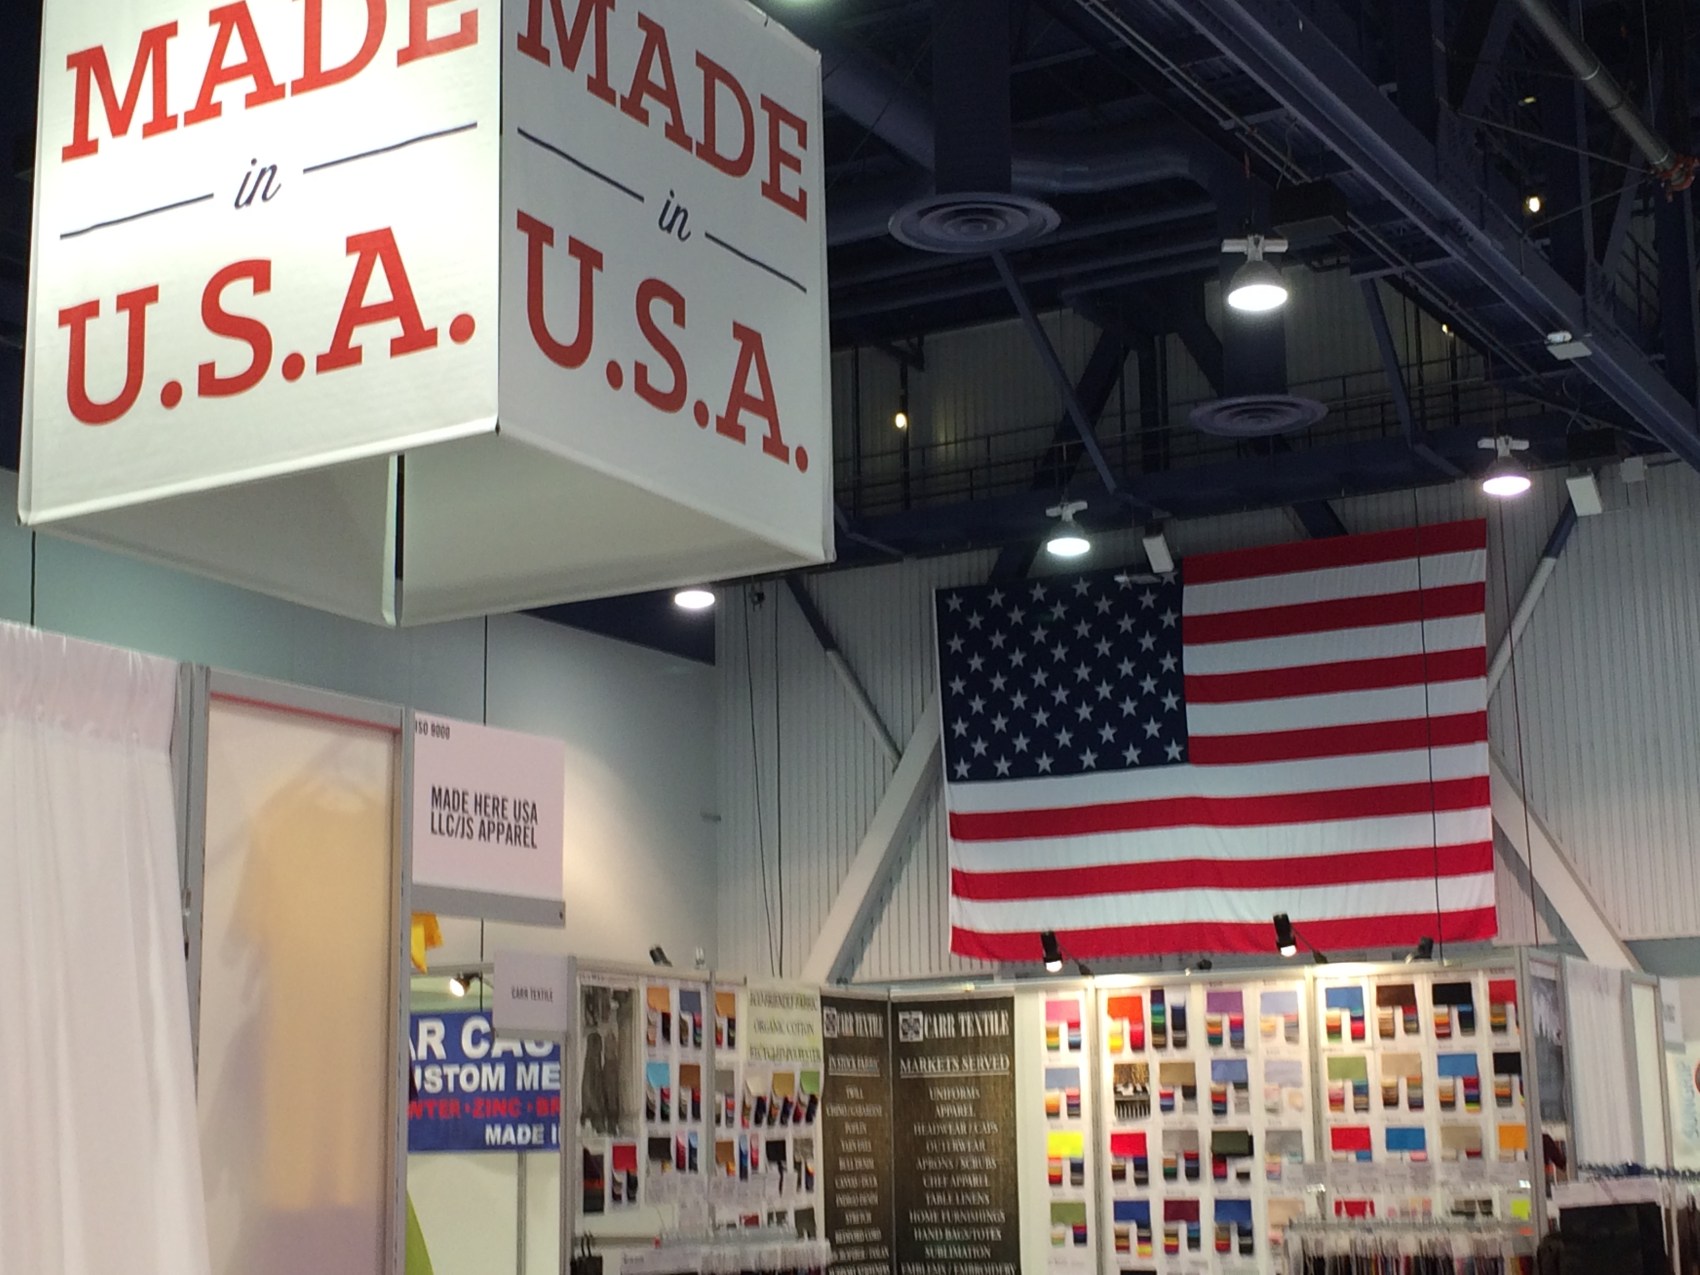
While the majority of apparel consumed in the United States come from overseas, “Made in the USA” is growing in popularity. According to the 2018 U.S. Fashion Industry Benchmarking Study released by the U.S. Fashion Industry Association (USFIA) in July 2018, around 46 percent of surveyed U.S. fashion brands and apparel retailers report currently sourcing “Made in the USA” products, even though local sourcing typically only account for less than 10 percent of these companies’ total sourcing value or volume.  Likewise, the State of Fashion 2019 report published by Business of Fashion (BOF) and McKinsey & Company in November also forecasts that over 20 percent of U.S. fashion companies’ sourcing volume could be from nearshore by 2025, thanks to automation technology and consumers’ increasing demand for speed to market.

However, the detailed practice of the “Made in the USA” apparel sourcing strategy–including who is sourcing, what products are sourced, and what the typical price range of these products remain largely unknown.

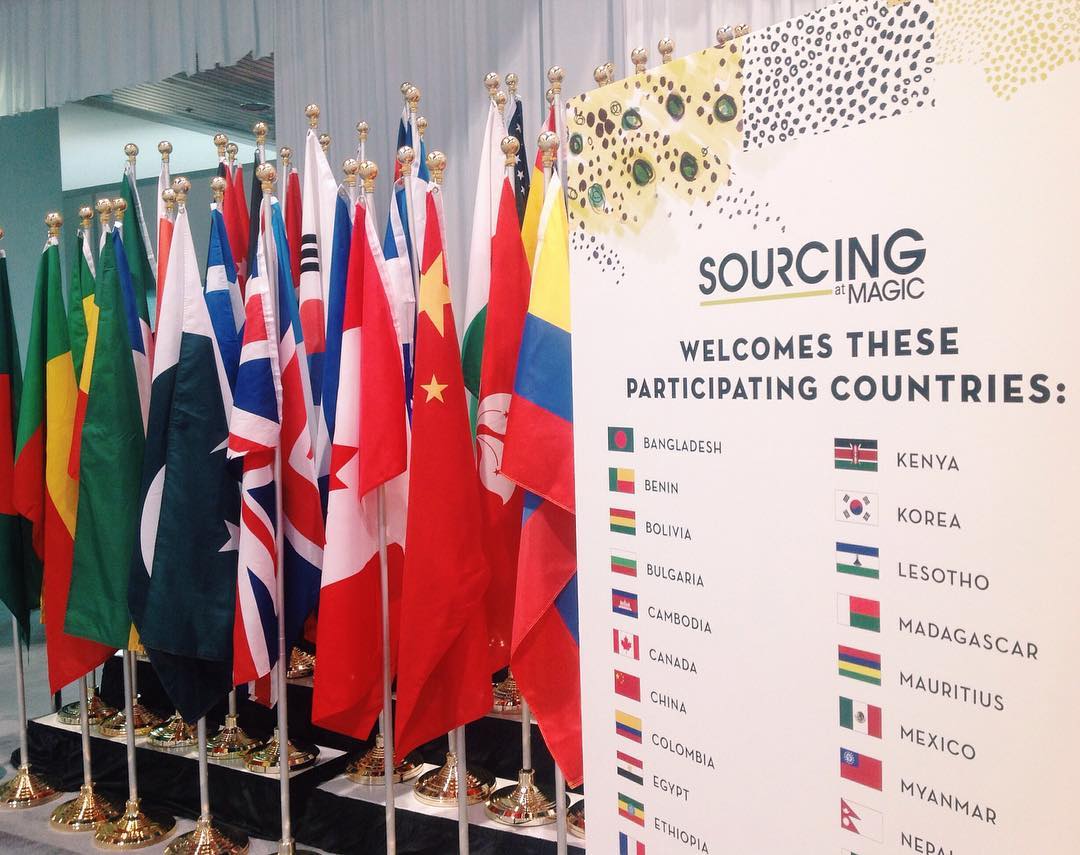
To answer these questions, we recently analyzed the pricing, product assortment and inventory information of over 90,000 fashion retailers and 300,000,000 fashion apparel products at the Stock-Keeping Unit (SKU) level based on EDITED, a big data and business analytics tool developed for the fashion industry. For the research purpose, we selected apparel products newly launched to the U.S. market in the past twelve months (i.e., between 1 December 2017 and 30 November 2018) with “Made in the USA” explicitly mentioned in the product description. Below are the key findings:

First, “Made in the USA” apparel overall are treated as a niche product in U.S. fashion brands and retailers’ sourcing portfolio.

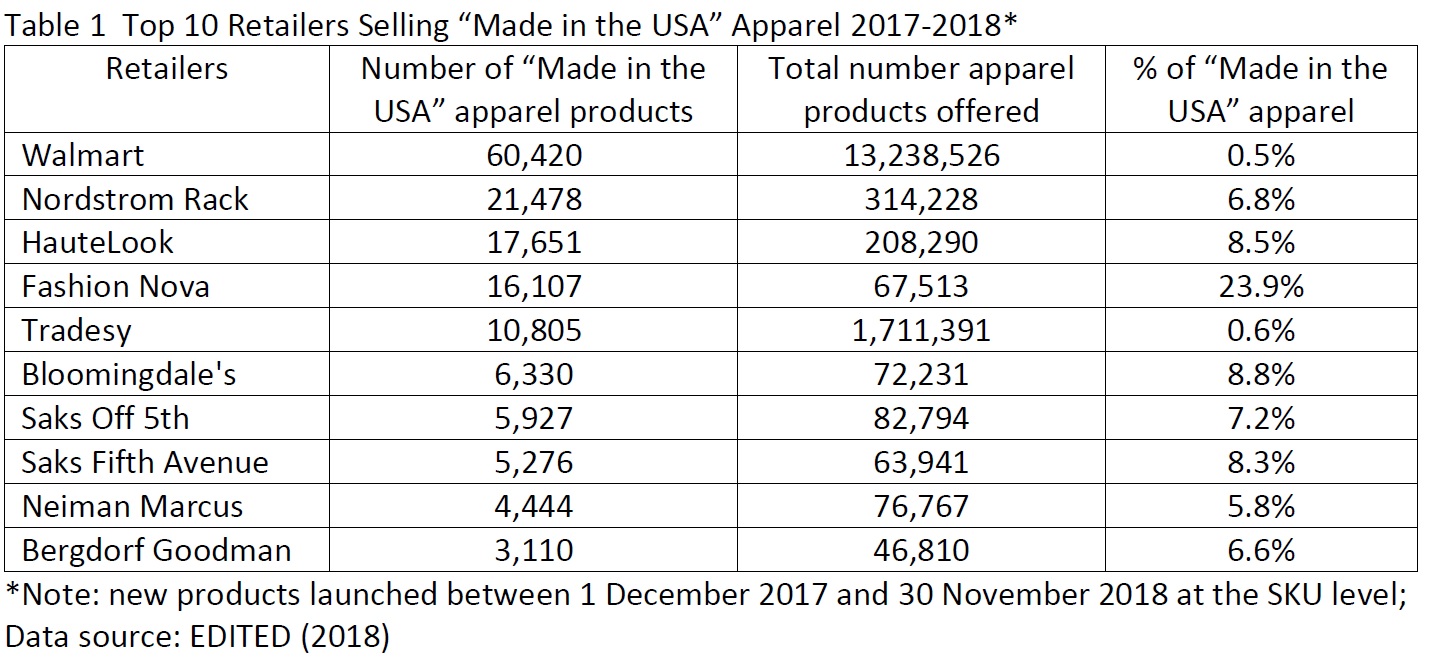
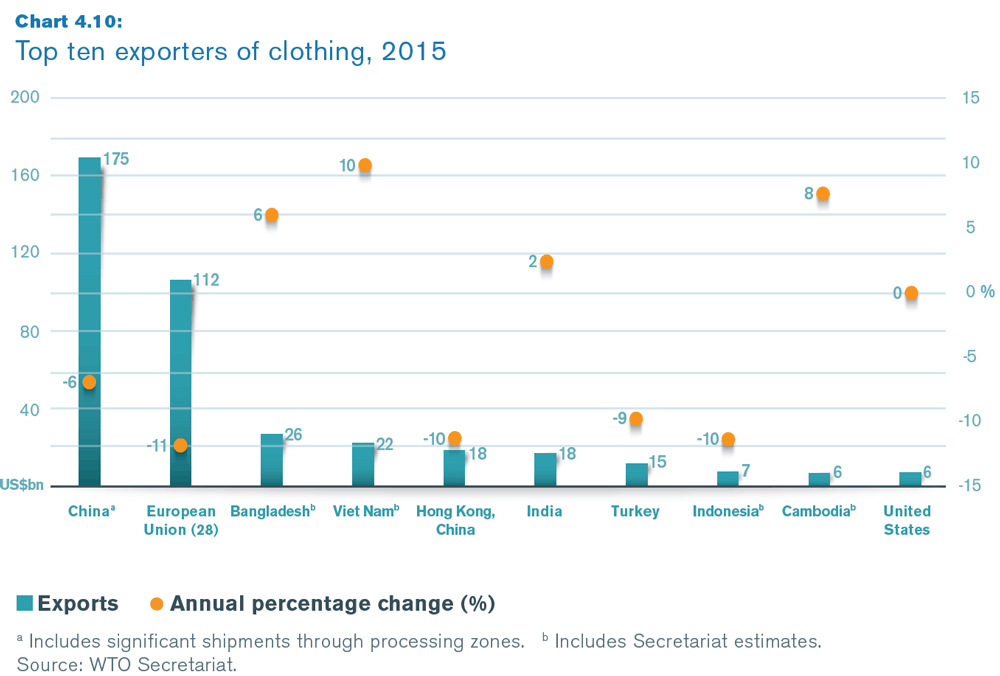
During the 12 months we examined (1 December 2017-30 November 2018), 94 out of the total 348 retailers (or 27 percent) sold “Made in the USA” apparel in the U.S. market. The top 10 sellers list includes BOTH retailers that focus on the value market such as Walmart and relatively high-end department stores such as Bloomingdale and Saks Fifth Avenue. However, even for these top sellers, “Made in the USA” apparel accounted for less than 8 percent of their total product offers on average.

Second, U.S. fashion brands and retailers are most likely to source“Made in the USA” apparel for relatively fashion-oriented items, particularly bottoms (such as skirts, jeans, and trousers), dresses, all-in-ones (such as playsuits and dungarees), swimwear and suits-sets.

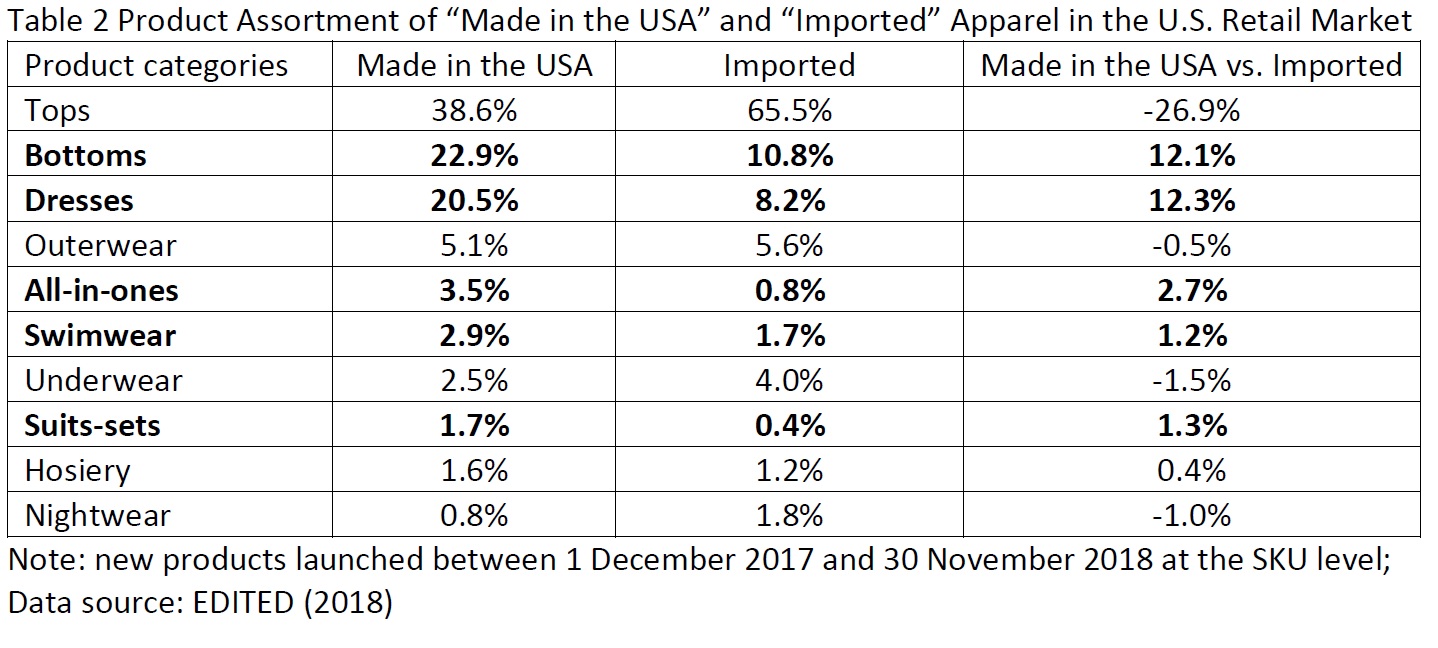
The competitive edge for these product categories in the retail market, in general, increasingly depends on unique designs, high product quality, and speed to market, which makes sourcing from the United States commercially beneficial. In comparison, imported products are more concentrated on basic fashion items often competing on price in the U.S. retail market, including tops (such as T-shirt and polo shirt), underwear, and nightwear.

It is also interesting to note that “Made in the USA” apparel were predominately women’s wear (92 percent), whereas imported clothing adopted a more balanced gender combination (63 percent women’s wear and 37 percent men’s wear). Because the fashion trends for women’s wear usually are shorter-lived and harder to predict, this result once again indicates that seeking quick response and shorter lead time for stylish and trendy items could be an important incentive for local sourcing by U.S. fashion brands and retailers.

Third, consistent with the common perception, “Made in the USA” apparel overall are pricier than imported ones in the U.S. retail market.

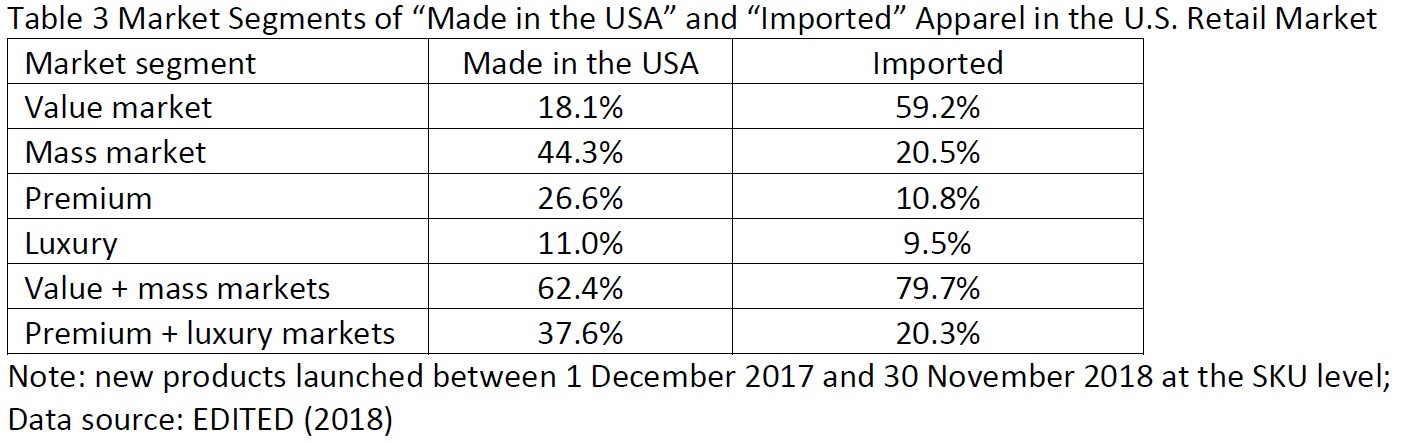
Taking the U.S. apparel retail market as a whole, close to 40 percent of “Made in the USA” offering in the past 12 months targeted the premium or luxury market, compared with only 20 percent of imported products.  In contrast, as few as 18 percent of “Made in the USA” offering were in the value market, which, however, accounted for approximately 60 percent of all imported apparel sold in the U.S. market. In totality, it seems U.S. fashion brands and retailers are purposefully targeting “Made in the USA” apparel for less price-sensitive segments of the market to balance the high domestic production cost.

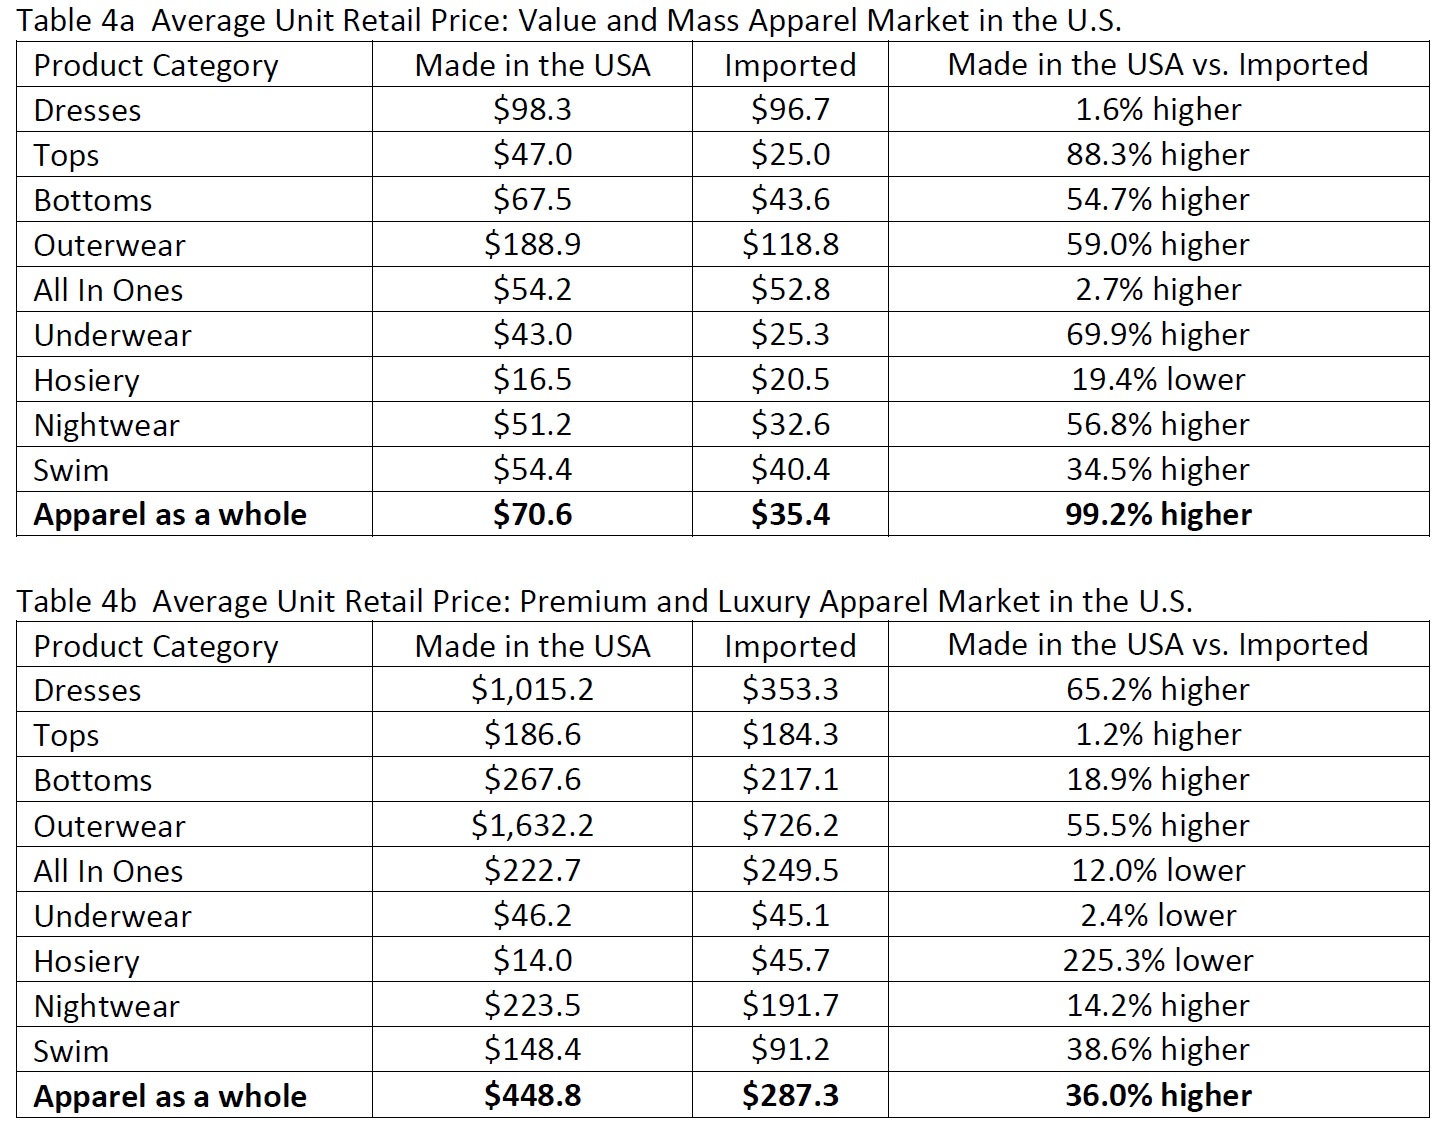
On the other hand, when examining U.S. fashion brands and retailers’ pricing strategy at the product level, “Made in the USA” clothing was still priced much higher than imported ones for almost all major apparel categories, except hosiery. Notably, in the past 12 months, the average unit retail price of “Made in the USA” clothing was 99.2 percent higher than imported ones in the value and mass market and 36.0 percent higher in the premium and luxury market. This interesting phenomenon supports the arguments that U.S. consumers somehow are willing to pay a premium price for products with the “Made in the USA” label.  

Additionally, during the past 12 months, around 46.3 percent of “Made in the USA” apparel were sold at a discount compared with more than 54.6 percent of imported ones. The advantage of proximity to the market, which makes speedy replenishment for in-season items possible, is an important factor behind the more successful control of markdowns for “Made in the USA” products. For example, data shows that U.S. fashion brands and retailers replenished approximately 12.7 percent of their “Made in the USA” offering in the past 12 months but only 2.8 percent of imported clothing.

In conclusion, the findings of this study concur with the view that “Made in the USA” apparel are still relevant today. Meanwhile, it does not seem to be the case that “Made in the USA” apparel and imported ones are necessarily competing with each other in the U.S. retail market. With apparel sourcing increasingly requiring striking a balance among various factors ranging from cost, flexibility, compliance to speed to market, it is hopeful that “Made in the USA” apparel will continue to have its unique role to play in U.S. fashion brands and retailers’ merchandising and sourcing strategies.

By Sheng Lu

Evolving Sourcing Strategies of U.S. Apparel Companies

The full article is available HERE

To better understand companies’ latest sourcing practices, we recently examined the detailed sourcing portfolios of the 50 largest U.S.-based apparel companies ranked by the Apparel Magazine. Specifically, we conducted a content analysis of each company’s publicly released annual reports and their financial statements from 2014 to 2017 (the latest information available), with a focus on the following two research questions: 1) How have the sourcing strategies of U.S. apparel companies evolved? 2) How have the evolving sourcing strategies affected companies’ financial performance? Here are the key findings:

First, U.S. apparel companies overall adopt a diverse sourcing base. Among the 50 companies we examined, on average they sourced from over 20 different countries or regions using more than 200 vendors in 2017. These results echo the findings of the 2018 U.S. Fashion Industry Benchmarking Study released by the U.S. Fashion Industry Association (USFIA) in July. Based on a survey of nearly 30 executives from leading U.S. fashion brands and apparel retailers, the study also found companies with more than 1,000 employees typically source from more than ten different countries and regions. Also, larger companies, in general, adopt a more diverse sourcing base than smaller ones.

Second, while U.S. apparel companies are actively seeking new sourcing bases, many of them are reducing either the number of countries they source from or the number of vendors they work with. Specifically, among the top 50 U.S. apparel companies examined, around 28 percent increased the number of countries or regions they use as sourcing bases between 2014 and 2017. However, over the same period, 52 percent chose to consolidate their existing sources base, but on a small scale. Likewise, among the top 50 U.S. apparel companies examined, approximately half reduced the number of vendors they use between 2014 and 2017, compared with 33 percent that chose to source from more vendors.

Third, for risk control purposes, most U.S. apparel companies avoid relying too much on any single vendor; however, some companies have begun to allocate more sourcing orders to its largest vendors. The top 50 U.S. apparel companies we examined on average assigned no more than 10 percent of their total sourcing value or volumes to any single vendor in 2017. This practice suggests that minimizing supply chain risks is a critical consideration of U.S. apparel companies’ sourcing strategy. Nevertheless, between 2014 and 2017, around 45 percent of apparel companies we examined raised the cap slightly.

Fourth, regarding the financial implications of the adjustment of sourcing strategies, companies that diversified their sourcing bases between 2014 and 2017, in general, were able to reduce sourcing cost and improve gross margin. In comparison, U.S. apparel companies we examined that consolidated their sourcing base between 2014 and 2017 suffered a slight decline in their gross margin percentage.

On the other hand, however, there was no clear pattern between a company’s choice of sourcing strategy and their net profit margin. While multiple factors could come into play, one possible explanation for the results is that that either diversifying or considering the sourcing base would incur additional management cost for the company.

Recommended citation: Luetje, J., & Lu, S. (2018).How do apparel sourcing shifts impact the bottom line?. Just-Style. Retrieved from https://www.just-style.com/analysis/how-do-apparel-sourcing-shifts-impact-the-bottom-line_id134604.aspx

Patterns of Canada’s Apparel Sourcing and Trade

canada sourcing.jpg

The full article is available HERE

Key findings:

First, Canada is one of the largest and fastest growing apparel import markets in the world. Data from the UN Comtrade show that the value of Canada’s apparel imports totaled $10.7bn in 2017, which ranked the fifth in the world, only after the European Union (EU), the United States, Japan, and Hong Kong.

Second, the Asian region as a whole is the dominant apparel supplier for Canada. Measured in value, as much as 80.9 percent of Canada’s apparel imports in 2017 came from Asia. Specifically, China (40.6 percent), Bangladesh (11.1 percent), Cambodia (8.1 percent) and Vietnam (7.7 percent) were the top individual supplier for Canada in 2017, and all of them are located in Asia. Meanwhile, Canadian apparel companies are gradually diversifying their sourcing base: the Herfindahl Index (HHI), a commonly adopted measure of market concentration, declined from 0.3 in 2010 to 0.19 in 2017.

Third, the NAFTA-region remains an important apparel-sourcing base for Canada, but its overall influence is in decline. Measured in value, the United States and Mexico were the 6th and 9th top apparel supplier for Canada in 2017 respectively. However, facing the competition from Asia, the United States and Mexico combined accounted for only 6.4 percent of Canada’s apparel imports in 2017, a significant drop from 9.8 percent back in 2007.

Fourth, free trade agreements and trade preference programs provide duty-saving opportunities for apparel sourcing in Canada. In 2017, Canada applied an average tariff rate of 17.1 percent on imports of knitted apparel (HS Chapter 61) and 15.9 percent on woven apparel (HS chapter 62). As of August 2018, Canada has 17 free trade agreements (FTAs) and trade preference programs (TPAs) in force, offering preferential or duty-free market access to Canada. Traditionally, a substantial portion of Canada’s FTA partners come from the Western Hemisphere, such as Chile, Costa Rica, Colombia, Peru, Honduras, and Panama. However, in recent years, Canada has been actively negotiating and reaching new FTAs with countries in Asia (such as South Korea, India, and Japan) and Europe (including the European Union and Ukraine). 

Compared with the United States, in general, Canada adopts more liberal rules of origin (RoO) for apparel products. Quite a few Canada FTAs allow companies to source yarns or even fabrics from anywhere in the world – with the finished products still enjoying duty-free treatment when exported to Canada.

[comment for this blog post is closed]

WTO Reports World Textile and Apparel Trade in 2017

Statistical review of world textile and apparel trade in 2018 is now available

Figure 1Figure 2

According to the newly released World Trade Statistical Review 2018 by the World Trade Organization (WTO), the current dollar value of world textiles (SITC 65) and apparel (SITC 84) exports totaled $296.1bn and $454.5bn respectively in 2017, increased by 4.2% and 2.8% from a year earlier. This is the first time since 2015 that the value of world textile and apparel exports enjoyed a growth.

Textiles and apparel are not alone. Driven by rising demand for imports globally, the current dollar value of world merchandise exports also grew by 4.7% in 2017–its most robust growth in six years, to reach $17.43 trillion. Particularly, the ratio of trade growth to GDP growth finally returned to its historic average of 1.5, compared to the much lower 1.0 ratio recorded in the years following the 2008 financial crisis.

China, European Union (EU28), and India remained the world’s top three exporters of textiles in 2017. Altogether, these top three accounted for 66.3% of world textile exports in 2017, up from 65.9% in 2016. All the top three also enjoyed a faster-than-average export growth in 2017, including 5.0% of China, 5.8% of EU(28) and 5.9% of India. The United States remained the world’s fourth top textile exporter in 2017, accounting for 4.6 percent of the shares, the same as a year earlier.

Regarding apparel, China, the European Union (EU28), Bangladesh and Vietnam unshakably remained the world’s top four largest exporters in 2017. Altogether, these top four accounted for as much as 75.8% of world market shares in 2017, which was higher than 74.3% a year earlier and a substantial increase from 68.3% back in 2007.

Continuing with the emerging trend in recent years, China is exporting less apparel and more textiles to the world. Notably, China’s market shares in world apparel exports fell from its peak—38.8% in 2014 to a record low of 34.9% in 2017. Meanwhile, China accounted for 37.1% of world textile exports in 2017, which was a new record high. It is important to recognize that China is playing an increasingly critical role as a textile supplier for many apparel-exporting countries in Asia. Measured by value, 47% of Bangladesh’s textile imports came from China in 2017, up from 39% in 2005. We observe similar trends in Cambodia (up from 30% to 65 %), Vietnam (up from 23 % to 50 %), Pakistan (up from 32 % to 71 %), Malaysia (up from 25 % to 54 %), Indonesia (up from 28 % to 46 %), Philippines (up from 19 % to 41 %) and Sri Lanka (up from 15 % to 39 %) over the same period.

Figure 3

Figure 4

Additional readings: 
Lu, S. (2018). Changing trends in world textile and apparel trade. Just-Style.
Lu, S. (2018). How regional supply chains are shaping world textile and apparel trade. Just-Style.

2018 U.S. Fashion Industry Benchmarking Study Released

The 2019 U.S. Fashion Industry Benchmarking Study is now availablecover

The report can be downloaded from HERE

Key findings of this year’s study:

Business challenges facing U.S. fashion companies: Protectionism is the top challenge for the U.S. fashion industry in 2018. More companies worry about increases in production or sourcing cost, too. For the second year in a row, “protectionist trade policy agenda in the United States” ranks the top challenge for U.S. fashion companies in 2018.

Industry outlook: Despite concerns about trade policy and cost, executives are more confident about the five-year outlook for the U.S. fashion industry in 2018 than they were a year ago, although confidence has not fully recovered to the level seen in 2015 and 2016. In addition, 100 percent of respondents say they plan to hire more employees in the next five years, compared with 80-85 percent in previous studies; market analysts, data scientists, sustainability/compliance related specialists or managers, and supply chain specialists are expected to be the most in-demand.

U.S. fashion companies’ sourcing strategy: When it comes to sourcing, diversification is key for many companies.

  • Most respondents continue to maintain a diverse sourcing base, with 60.7 percent currently sourcing from 10+ different countries or regions, up from 57.6 percent in 2017.
  • Larger companies, in general, continue to be more diversified than smaller companies.
  • Reflecting the U.S. fashion industry’s growing global reach, respondents report sourcing from as many as 51 countries or regions in 2018, the same as in 2017. Asia as a whole continues to take the lead as the dominant sourcing region. Meanwhile, with the growing importance of speed-to-market and flexibility, the Western Hemisphere is becoming an indispensable sourcing base.
  • Keeping a relatively diverse sourcing base will remain a key element of U.S. fashion companies’ sourcing strategy. Nearly 80 percent of respondents plan to source from the same number of countries, or more countries, in the next two years. However, respondents are equally divided on whether to increase or decrease the number of suppliers they will work with.
  • China plus Vietnam plus Many” has become an ever more popular sourcing model among respondents. And this model is evolving as companies further diversify their China production. In particular, China now typically accounts for only 11-30 percent of companies’ total sourcing value or volume, compared with 30-50 percent in the past.
  • Although China’s position as the top sourcing destination is unshakable, companies are actively seeking alternatives to “Made in China.” This does not seem to be due to concerns about cost, but rather the worries about the escalating U.S.-China trade tensions.
  • Benefiting from the diversification away from China, Vietnam and Bangladesh are expected to play a bigger role as apparel suppliers for the U.S. market in the near future.

Rules of origin and the utilization of trade agreements for sourcing: Rules of origin, and exceptions to the rules of origin, significantly impact whether companies use free trade agreements (FTAs) and trade preference programs for sourcing.

  • While FTAs and trade preference programs remain largely underutilized by U.S. fashion companies, more companies are using NAFTA (65 percent), CAFTA-DR (58 percent) and AGOA (50 percent) than in the past two years.
  • Still, it’s concerning that companies often do not claim the duty-free benefits when sourcing from countries with FTAs or preference programs. Companies say this is primarily due to the strict rules of origin.
  • Exceptions to the “yarn-forward” rules of origin, including tariff preference levels (TPLs), commercial availability/short supply lists, and cumulation, are priorities for respondents; 48 percent say they currently use these mechanisms for sourcing. These exceptions provide critical flexibilities that make companies more likely to use FTAs and source from FTA regions.

NAFTA: U.S. fashion companies call for a further reduction of trade barriers and urge trade negotiators to “do no harm” to NAFTA, the most-utilized free trade agreement by respondents.

  • Respondents predominantly support initiatives to eliminate trade barriers of all kinds, from high tariffs to overcomplicated documentation requirements, to restrictive rules of origin in NAFTA and future free trade agreements.
  • More than half of respondents explicitly say NAFTA is important to their business—and they have grave concerns about the uncertain future of the agreement.

Sourcing in sustainable and socially compliant ways: Overall, U.S. fashion companies are making more commitments to sustainability and social responsibility.

  • 85 percent of respondents plan to allocate more resources for sustainability and social compliance in the next two years, in areas including providing training to suppliers and internal employees, adding more employees, and working more closely with third-party certification programs on sustainability and social compliance. However, the availability of operational budget remains the primary hurdle for companies that want to do more.
  • 100 percent of respondents map their supply chains (i.e., keep records of name, location, and function of suppliers), up from 90 percent in 2017. Over 80 percent of respondents track not only Tier 1 suppliers (i.e., factory where the final product is assembled), but also Tier 2 suppliers (i.e., subcontractors or major component suppliers, such as fabrics). However, it’s less common for companies to map Tier 3 (i.e., yarn spinners, finding and trimming suppliers) and Tier 4 suppliers (i.e., raw materials suppliers, such as cattle/pig hides, rubber, cotton, wool, goose down, minerals/metals and chemicals).
  • 100 percent of respondents audit their suppliers for issues including building safety, fire safety, and treatment of workers. The vast majority of respondents (96 percent) currently use third-party certification programs to audit, with both announced and unannounced audits.

The US Fashion Industry Benchmarking Study from 2014 to 2017 can be downloaded from HERE

Sourcing Strategy of Leading U.S. Fashion Brands and Apparel Retailers (updated in May 2018)

Competition in the U.S. Apparel Import Market (Updated March 2018)

market shares in the US (2017)_Page_2market shares in the US (2017)_Page_3CAFTA-DRNAFTA

North Korea’s Apparel Exports: Four Things to Know

NK1

First, apparel (defined by HS Chapters 61 & 62) is one of the top categories of North Korea’s merchandise exports. Statistics from the International Trade Center (ITC) show that of North Korea’s total US$2,339.9 million merchandise exports in 2016, US$564.7 million (or 19.4%) were apparel.

NK2

Second, apparel is also one of the fastest-growing categories of North Korea’s exports over the past decade. From 2003 to 2016, the value of North Korea’s apparel exports surged by 416%, compared to only 171% increase of other products over the same period.

NK3

NK4.jpg

Third, over 99.4% of North Korea’s apparel exports went to China in 2016. Notably, back in 2003, China only accounted for 49.7% of North Korea’s apparel exports. However, apparel exports from North Korea to China received two substantial boosts just in the past ten years: one in 2009 (the year when UN resolution 1874 was adopted) and another in 2013 (the year when UN resolution 2087 was adopted).

Fourth, interesting enough, North Korea’s apparel exports predominantly concentrate on men and women’s overcoats (HS 6201 and 6202) as well as suits, jackets, and blazers (HS 6203 and 6204). This is a notable difference from most other developing countries, such as Bangladesh, Vietnam, and Cambodia whose apparel exports usually focus on more basic items like shirts and trousers.  

by Sheng Lu

Extended readings:

Disclaimer: All blog posts on this site are for FASH455 educational purposes only and they are nonpolitical and nonpartisan in nature. No blog post has the intention to favor or oppose any particular public policy, nor shall be interpreted in that way.

US Textile and Apparel Industry Associations Comment on NAFTA Renegotiation

This week, several leading U.S. textile and apparel industry associations submitted their comments to the Office of the United States Trade Representative (USTR) regarding the renegotiation objectives of the North American Free Trade Agreement (NAFTA). Below is a summary of these organizations’ viewpoints based on their submissions:

NAFTA renegotiation

Appendix: Submitted written comments

Market Size of the Global Textile and Apparel Industry: 2015 to 2020

The updated data is available: Market Size of the Global Textile and Apparel Industry: 2016 to 2021/2022

Textile Mills Market

textile

The textile mills market includes yarns and fabrics. The market value includes domestic production plus imports minus exports, all valued at manufacturer prices.

The value of the global textile mills market totaled $667.5 billion in 2015 (around 83.1% were fabrics and 16.9% were yarns), up 1.5% from a year earlier. The compound annual growth rate of the market was 4.4% between 2011–15. Asia-Pacific accounted for 54.6% of the global textile mills market value in 2015 and Europe accounted for a further 20.6% of the market.

The global textile mills market is forecast to reach $842.6 billion in value in 2020, an increase of 26.2% since 2015. The compound annual growth rate of the market in the period 2015–20 is predicted to be 4.8%.

Apparel market

apparel

The apparel market covers all clothing except leather, footwear, and knitted items as well as other technical, household, and made-up products. The market value includes domestic production plus imports minus exports, all valued at manufacturer prices.

The value of the global apparel market totaled $842.7 billion in 2016 (estimated), up 5.5% from a year earlier. The compound annual growth rate of the market was 5.2% between 2012–16. Asia-Pacific accounted for 60.7% of the global apparel market value in 2016 and Europe accounted for a further 15.0% of the market.

The global apparel market is forecast to reach $1,004.6 billion in value in 2021, an increase of 19.2% since 2016. The compound annual growth rate of the market in the period 2015–20 is predicted to be 3.6%.

Apparel retail market

retail

The apparel retail industry consists of the sale of all menswear, womenswear and childrenswear. The industry value is calculated at retail selling price (RSP), and includes all taxes and duties.

The value of the global apparel retail market totaled $1,254.1 billion in 2015 (52.9% womenswear, 31.2% menswear and 15.9% childrenswear), up 4.8% from a year earlier. The compound annual growth rate of the market was 4.5% between 2011–15. Asia-Pacific accounted for 36.8% of the global apparel retail market in 2015, followed by Europe (27.8%) and the United States (24.0%).

The global apparel retail market is forecast to reach $1,652 billion in value in 2020, an increase of 31.8% since 2015. The compound annual growth rate of the market in the period 2015–20 is predicted to be 5.7%.

Data source: MarketLine (2017)

What Will Happen to the U.S. Textile and Apparel Industry if NAFTA Is Gone?

References and tables_Page_1.jpg

References and tables_Page_2

Since its taking effect in 1995, NAFTA, a trade deal between the United States, Mexico, and Canada, has raised heated debate regarding its impact on the U.S. economy. President Trump has repeatedly derided NAFTA, describing it as “very, very bad” for U.S. companies and workers, and he promised during his campaign that he would remove the United States from the trade agreement if he could not negotiate improvements.

The U.S. textile and apparel (T&A) industry is a critical stakeholder of the potential policy change, because of its deep involvement in the regional T&A supply chain established by the NAFTA. Particularly, over the past decades, trade creation effect of the NAFTA has significantly facilitated the formation of a regional T&A supply chain among its members. Within this supply chain, the United States typically exports textiles to Mexico, which turns imported yarns and fabrics into apparel and then exports finished apparel back to the United and Canada for consumption.

So what will happen to the U.S. T&A industry if NAFTA no longer exists? Here is what I find*:

figure 1

First, results show that ending the NAFTA will significantly hurt U.S. textile exports. Specifically, the annual U.S. textile exports to Mexico and Canada will sharply decline by $2,081 million (down 47.7%) and $351 million (down 14%) respectively compared to the base year level in 2015.Although U.S. textile exports to other members of the Central America Free Trade Agreement (CAFTA-DR), will slightly increase by $42 million (up 1.5%), the potential gains will be far less than the loss of exports to the NAFTA region.

2

Second, results show that ending the NAFTA will significantly reduce U.S. apparel imports from the NAFTA region. Specifically, annual U.S. apparel imports from Mexico and Canada will sharply decrease by $1,610 million (down 45.3%) and $916 million (down 154.2%) respectively compared to the base year level in 2015 (H2 is supported). However, ending the NAFTA would do little to curb the total U.S. apparel imports, largely because U.S. companies will simply switch to importing more apparel from other suppliers such as China and Vietnam.

3

Third, ending NAFTA will further undercut textile and apparel manufacturing in the United States rather than bring back “Made in the USA.” Specifically, annual U.S. textile and apparel manufacturing will decline by $1,923 million (down 12.8%) and $308 million (down 3.0%) respectively compared to the base year level in 2015 (H3 is supported). Weaker demand from the NAFTA region is the primary reason why U.S. T&A manufacturing will suffer a decline.

These findings have several important implications. On the one hand, the results suggest that the U.S. T&A will be a big loser if the NAFTA no longer exists. Particularly, ending the agreement will put the regional T&A supply chain in jeopardy and make the U.S. textile industry lose its single largest export market—Mexico. On the other hand, findings of the study confirm that in an almost perfectly competitive market like apparel, raising tariff rate is bound to result in trade diversion. With so many alternative suppliers out there, understandably, ending the NAFTA will NOT increase demand for T&A “Made in the USA,” nor create more manufacturing jobs in the sector. Rather, Asian textile and apparel suppliers will take away market shares from Mexico and ironically benefit most from NAFTA’s dismantlement.

*Note: The study is based on the computable general equilibrium (CGE) model developed by the Global Trade Analysis Project (GTAP). Data of the analysis came from the latest GTAP9 database, which includes trade and production data of 57 sectors in 140 countries in 2015 as the base year. For the purpose of the study, we assume that if NAFTA no longer exists, the tariff rate applied for T&A traded between NAFTA members will increase from zero to the normal duty rate (i.e. the Most-Favored-Nation duty rate) in respective countries.

by Sheng Lu

Outlook 2017: Apparel Industry Issues in the Year Ahead

outlook

In January 2017, Just-Style consulted a panel of industry leaders and scholars in its Outlook 2017–Apparel Industry Issues in the Year Ahead management briefing. Below is my contribution to the report. Welcome for any suggestions and comments.

1: What do you see as the biggest challenges – and opportunities – facing the apparel industry in 2017, and why?

I see the uncertainty in the global economy will pose one of the biggest challenges facing the apparel industry in 2017. Apparel business is buyer-driven. A great number of studies have suggested that economic growth is by far the most effective and reliable predictive factor for apparel consumption. Unfortunately, it seems apparel companies have to deal with another year of economic volatility and weak demand in 2017. For example, according to the latest International Monetary Fund (IMF) forecast released in October 2016, global economic growth in 2017 is projected to only recover to 3.4 percent from 3.1 percent in 2016. There is no particular excitement among major apparel consumption markets either: outlook of the U.S. economy in 2017 is complicated by the strong U.S dollar, the Federal Reserve’s monetary policy as well as the uncertain trade and tax policy to be adopted by the new Trump administration; Economic growth in the EU region next year will continue to be hindered by the unknown fallout from UK’s referendum on leaving the EU, pervasive geopolitical uncertainties, high unemployment rates and the rising protectionist tendencies; Japan’s economic growth is projected to be as low as 1.0 percent in 2017 according to the Organization for Economic Co-operation and Development (OECD); And China’s economic growth in 2017 could slow again to 6.5 percent, which would be the slowest pace in more than 25 years. Reflecting the trend, we might see a stagnant growth or even a decline of global textile and apparel trade in 2017 as well.

Nevertheless, companies’ continuous investments on technology and innovation will create exciting new opportunities for the apparel industry. Particularly, growing areas in the apparel industry such as 3D printing, wearable technology, digital prototyping and e-commerce have made many “non-traditional” players now interested in fashion, including technology giants like Google and Apple. I think we can expect the apparel industry to become even more modern and high-tech driven in the years to come. The changing nature of the apparel industry will also increase demand for talents from an ever more diversified educational background, such as engineering, physical therapy and business analytics.

2: What’s happening with sourcing? How is the sourcing landscape likely to shift in 2017, and what strategies can help apparel firms and their suppliers to stay ahead?

One observation from me is that textile and apparel (T&A) supply chain is becoming more regional-based. For example, data from the World Trade Organization (WTO) shows that 91.4 percent of textiles imported by Asian countries in 2015 came from other Asian countries, up from 86.6 percent in 2008. This suggests that Asian countries togetherare building a more integrated T&A supply chain. Likewise, in 2015 close to 90 percent of apparel exported by North, South and Central American countries went to the United States and Canada and 81 percent of apparel exported by EU countries went to other EU countries too. To be noted, all of these three major T&A supply chains are facilitated by respective free trade agreements in the region such as the North American Free Trade Agreement (NAFTA), ASEAN–China Free Trade Area (ACFTA) and of course the common market enjoyed by the EU members. On the other hand, fashion brands and apparel retailers often use the Western-Hemisphere supply chain and EU-based supply chain as a supplement to the Asia-based supply chain for more fashion-oriented or time-sensitive items. I think such a dual-track sourcing strategy will continue in 2017.

Related, I think supply chain management will play a growing important role helping apparel companies control sourcing cost, improve speed to market and better meet consumers’ demand in 2017. An interesting phenomenon revealed by the 2016 U.S. Fashion Industry Benchmarking Study released by the U.S. Fashion Industry Association is that around 30 percent of respondents say they plan to consolidate rather than diversify their sourcing base in the next 2 years. As one respondent commented, “(Our) focus right now is really finding efficiencies and maximizing productivity in the supply chain. While we won’t necessarily move out of any countries, we are consolidating the base within regions.”

Last but not least, I think in 2017 apparel companies will continue to give more weight to sustainability and social responsibility in their sourcing decisions. Building a more transparent and sustainable supply chain is an irreversible trend in the apparel industry. 

3: What should apparel firms be doing now if they want to remain competitive into the future? What will separate the winners from the losers?

To remain competitive into the future, apparel companies need to be prepared to change and be willing to try something new. Indeed, revolution is coming for the apparel industry, including the way products are made and sourced (example: 3D printing and various digital manufacturing tools), how consumers shop (example: the see-now-buy-now trend) and where and how to sell (example: the booming e-commerce and omni-channel retailing). In the past, small and medium sized companies (SME) were regarded more vulnerable than big players in the apparel industry for business survival.  However, nowadays, without embracing the spirit of innovation and entrepreneurship, even large companies can quickly become “dinosaurs” and find their business struggling. 

4: What keeps you awake at night? Is there anything else you think the apparel industry should be keeping a close eye on in the year ahead? Do you expect 2017 to be better than 2016, and why?

One thing that keeps me awake at night as a professor is what needs to be changed or updated in our curriculum to better prepare our students for the needs of the apparel industry. Fashion programs like us directly prepare future professionals for the fashion apparel industry. This also means we are not immune to the big shift in the industry either. For example, our course offerings currently include textile science, product development, merchandising, branding and sourcing and trade. But in addition to these conventional topics, what else should be added to the curriculum? What new skill setsor knowledge points will be highly expected by the apparel industry for our students in the future? Personally I think talent training is a critical area that the apparel industry and our fashion educational programs can and should form closer partnership. And the outcomes will be mutual beneficial too.

Trade policy is another area that keeps me awake at night. Trade policy matters for the apparel industry because it affects the quantity, price and availability of products in the market. Specifically, in 2017 I will be watching closely about the following trade agendas: 1) the WTO Trade Facilitation Agreement (TFA), which is nearing entering into force. TFA aims to make customs and border procedures easier, speed up the passage of goods between countries and lower cost of trade.

2) negotiation of the Regional Comprehensive Economic Partnership (RCEP). In 2015, the sixteen RCEP members altogether exported $369 billion worth of textile and apparel (50% of world share) and imported $124 billion (34% of world share). Since the Trans-Pacific Partnership (TPP) won’t be implemented anytime soon, RCEP has the potential to influence and reshape the T&A supply chain in the Asia-Pacific region.

3) a possible revision of the North American Free Trade Agreement (NAFTA). NAFTA is a critical factor facilitating and maintaining the Western-Hemisphere textile and apparel supply chain. A recent study of mine shows that ending the NAFTA would significantly hurt apparel manufacturing in Mexico and textile manufacturing in the United States, largely because apparel “Made in Mexico” today often contains yarns and fabrics “Made in USA”.

4) Trans-Pacific Partnership (TPP) and Trans-Atlantic Trade and Investment Partnership (T-TIP). Although many people think these two agreements are dead, I disagree. TPP and T-TIP are NOT conventional free trade agreements (FTAs) that deal with tariffs and non-tariff barriers only. Just like why we need traffic rules, TPP and T-TIP address our needs to update international trade regulations on 21st century trade agendas such as digital trade, state-owned enterprises, labor and environmental standards, small and medium sized enterprises and trade related investment. On the other hand, both TPP and T-TIP still have a solid and broad supporting base, which includes the fashion apparel industry. If trade politics is why TPP and T-TIP are in trouble, for the same reason, we should expect a reversal of the fate of these two agreements when time arrives. Plus, we should never underestimate the creativity and wisdom of trade policymakers.

Sheng Lu

New USCBC Study Suggests Overall Positive Impacts of China on the US economy

oe-cover_0

Although the trade relationship with China is often blamed for causing job losses in the United States, a new study prepared for the U.S.-China Business Council (USCBC) by Oxford Economics suggests overall positive impacts of China on the US economy. According to the study:

  • China has grown to become the third-largest destination for American goods and services, only after Mexico and Canada. China purchased $165 billion in goods and services from the United States in 2015, representing 7.3 percent of all US exports and about 1 percent of total US economic output. By 2030, US exports to China are projected to rise to more than $520 billion annually.
  • The US-China trade relationship supports roughly 2.6 million jobs in the United States. Specifically, US exports to China directly and indirectly supported 8 million new jobs in 2015.
  • The reported gross US trade deficit with China is overstated and somehow misleading. As China has become an integral part of the global manufacturing supply chain, much of its exports are comprised of foreign-produced components delivered for final assembly in China. If the value of these imported components is subtracted from China’s exports, the US trade deficit with China is reduced by half, to about 1 percent of GDP—about the same as the US trade deficit with the European Union.
  • Additionally, “Made in China” lowered prices in the United States for consumer goods. As estimated, US consumer prices are 1 percent – 1.5 percent lower because of Chinese imports–trade with China saved each American household up to $850 in 2015. Given the fact that hourly labor costs in the textile industry were $2.65 in China in 2014 compared with $17.71 in the United States, the report argues that replacing Chinese imports of textiles and clothing with US manufactured products would significantly raise US consumer prices.

uscbcjob2017.jpg

uscbcjob20172

In terms of the textile and apparel (T&A) sector, the report suggests that:

  • The rising U.S. import from China mostly represents China’s displacement of imports from other countries and regions: China has been squeezing out traditional apparel manufacturers such as Mexico, Hong Kong, and Taiwan.
  • Meanwhile, textile and apparel manufacturing is one of the very few sectors that observe a paralleled pattern of rising imports from China and declining gross value added in the United States since 2000. In comparison, over the same period other sectors that experienced the most rapid growth in Chinese imports are also the sectors where US businesses have seen the strongest growth.

The report can be downloaded from HERE.

Apparel Sourcing in 2017: Results from the Just-Style State of Sourcing Survey

sourcing-560x400

The latest Just-Style State of Sourcing Survey conducted in December 2016 suggests a few trends of apparel sourcing in 2017:

  • Exchange rate volatility and rising raw material and labor costs are among the top concerns for apparel sourcing in 2017. Around 69% of survey respondents expect overall sourcing costs to rise in 2017, compared with 54.5% in last year’s survey. The fluctuating exchange rate, buyer’s expectation for higher quality of products and complex compliance requirements are among the major factors driving up the sourcing cost.
  • Apparel companies expect more uncertainties regarding the political and policy environment in 2017. Specific concerns for apparel companies include trade policy under Trump’s Administration, possible renegotiation of trade agreements such as the North American Free Trade Agreement (NAFTA) and Trump’s threats to impose a 45% punitive tariff on US textile and apparel imports from China. Respondents say the uncertainties make it challenging for companies to do strategic planning in advance
  • Sourcing will play an increasingly important role helping companies achieve strategic goals. It is highly expected that sourcing can contribute to meeting the fast-evolving demands of omni-channel retailing, consumers’ expectations for a more convenient shopping experience, as well as greater product innovation across all sales channels. A few respondents say they will use process and productivity improvement and closer collaboration with key suppliers to try to achieve these goals and mitigate any sourcing cost increases.   
  • Sourcing destinations may continue to slightly adjust in 2017. Specifically, 72.1% of respondents say they are looking for alternative source of supply in 2017 compared with 69.2% last year. Popular emerging sourcing destinations include Central America and the United States, EU, UK, Vietnam, Bangladesh, Indonesia and Kenya. However, the survey also confirms that China‘s dominance as the top apparel supplier is unlikely to change anytime soon – with a rise in the number of respondents looking to increase orders from the country in the upcoming year.

Respondents of the survey include manufacturers (29%), importers, agents or sourcing office executives (23%), retailers (12%), fiber, yarn, or fabric suppliers (11%), consulting, research, government, trade institute, NGO and university fields (14%) and software suppliers (2.6%).

Full report of the survey is available HERE.

Made in the USA Textiles and Apparel:Facts and Future

The presentation is the outcome of Jillian Luetje‘s honor project in FASH455 (Fall 2016). In the project, Jillian explored the facts and future of “Made in USA” textile and apparel based on her research of existing literature and interviews with U.S. trade officials. The presentation intends to help the audience (especially those new to the area of textile and apparel trade and trade policy) have a basic understanding of the topic.  

Key findings:

  • Textile and apparel manufacturing in the USA is NOT totally gone.
  • The U.S. textile industry in particular relies on the Western Hemisphere supply chain and related free trade agreements
  • Made in the USA apparel is not going to increase any time soon.

Welcome for any comments and suggestions!

Outlook for Trade Policy in the Trump Administration and Impact on the Textile and Apparel Industry: A Summary of Views from Experts

bn-qb709_1001tr_m_20161002000431

TPP is in trouble, but NOT dead

David Spooner, Partner at Barnes & Thornburg LLP, Former Chief Textile & Apparel Negotiator at the Office of the U.S. Trade Representative, and Former Assistant Secretary of Commerce for Import Administration: “it will be a tough road to pass it (the Trans-Pacific Partnership, TPP) during the Trump Administration…However, there may be opportunities for the (fashion) industry if Trump brings new faces to the Office of the U.S. Trade Representative (USTR) and takes a fresh look at trade agreements.” Source: https://www.usfashionindustry.com/news/off-the-cuff-newsletter/2803-recap-28th-apparel-importers-trade-transportation-conference

Jeffrey J. Schott, Senior Fellow of the Peterson Institute for International Economics: “What’s the future for TPP? Most likely, Trump will simply not implement it. Without US participation, the pact cannot definitively enter into force. It’s death by malign neglect.” “But the 11 other TPP countries may not sit idly on the sidelines waiting for US ratification. Instead, they could agree among themselves to extend the TPP benefits to each other on a provisional basis, leaving the door open for US participation in the future. If the United States subsequently ratifies the TPP, the pact would then enter into force on a permanent basis.” Source: https://piie.com/blogs/trade-investment-policy-watch/tpp-could-go-forward-without-united-states

Steve Warner, President/CEO BeaverLake6 Group LLC, former President and CEO of the Industrial Fabrics Association International (IFAI): “TPP was dead going forward. TPP isn’t actually bad for the technical textiles industry except in a few instances. The real bad culprit, though, is the passage of the Trade Promotion Authority (TPA), which I opposed when it was being hotly debated in 2015. TPA gave no wiggle room for lawmakers to make even slight changes in the TPP when it was presented by the Obama administration that could at least mollify a representative’s constituents. You couldn’t just like parts of the agreement; you had to like all of it. Thus, you were either with it entirely or have to go against it. It proved to be safer to go against it. As for T-TIP, it was going to be a tough deal to conclude when the European Union insisted a primary objective for them was the elimination of the Berry Amendment protection for US domestic manufacturers” Source: http://www.beaverlake6.com/in-my-opinion/

Face uncertainties but with hope

Michael Singer, vice president of customs compliance at Macy’s and chairman of the U.S. Fashion Industry Association (USFIA): “I do see some opportunities believe it or not, and I had to struggle really hard to come up with something positive. From the regulatory basis, there may be an opportunity for some easing of government laws and mandates.” “One of the key issues we now face is how the administration and Congress will handle trade issues in 2017… We all know how important trade and the access to world markets is in our ability to provide our customers the choices and products they expected, and yet there is no doubt the protectionist sentiment in our country is at historic levels. USFIA will be doing our best to make sure that this remains a top priority and we clearly communicate the importance and benefit of trade to U.S. consumers and the U.S. economy.” Source: http://wwd.com/business-news/government-trade/donald-trump-on-trade-taxes-and-regulations-10702130/

 Julia Hughes, President of the U.S. Fashion Industry Association (USFIA): “A lot of folks were surprised by the (election) outcome… We can see we have our work cut out for us…We’re going to be dealing with a lot of unknowns even with the continuation of a Republican Congress.” Source: http://www.just-style.com/analysis/tpp-is-not-going-to-happen-in-a-trump-administration_id129272.aspx

Daniel J. Ikenson, director of Cato’s Herbert A. Stiefel Center for Trade Policy Studies: “If he (Trump) is able to expand and diversify the pool of people advising him, there is a reasonable chance that President Trump’s actions will be less bellicose than his rhetoric has been. After all, as someone who wants to make America “great again,” President-elect Trump will want the policies implemented by his administration to help grow the economy. Trade agreements have succeeded in that regard and, in addition to the TPP, there are plenty of countries and regions willing to partner, including the European Union and the United Kingdom (separately), and plenty of alternative negotiating platforms for accomplishing trade and investment liberalization. ” Source: https://www.cato.org/blog/shifting-gears-contemplate-trumps-trade-policies

David Spooner, Partner at Barnes & Thornburg LLP, Former Chief Textile & Apparel Negotiator at the Office of the U.S. Trade Representative, and Former Assistant Secretary of Commerce for Import Administration: “I think there’s some opportunity in a Trump administration…Assuming chaos provides opportunities, and if Trump brings in new faces to USTR, it might give us an opportunity to do new things in trade. We’ve been screwed by the yarn-forward rule for decades. Maybe there’s an opportunity to do things, even if it’s around the margins.” Source: https://sourcingjournalonline.com/tpp-ttip-wont-happen-trump-administration/

Robert Antoshak, managing director at Olah Inc.: “First, (Trump) he’ll let TPP, the Trans-Pacific Partnership) just wither on the vine. It’s pretty easy to kill TPP by doing nothing; Congress hasn’t voted on it yet. Next, he may activate the escape clause in NAFTA (the North American Free Trade Agreement with Canada and Mexico), which gives signatories a six-month window to exit the agreement. During that time, he could use an exit for political gain in the media – imagine the headlines about the US pulling out of NAFTA – but in reality, he could use the time to renegotiate portions of the agreement. And then there’s T-TIP, the Transatlantic Trade and Investment Partnership free trade deal with the EU. Personally, I’m going to keep a close eye on relations between the White House and 10 Downing Street. The commonalities between the forces supporting Brexit and Trump are all too similar. Why negotiate with all of the EU, when it may be more politically expedient for Trump to negotiate a separate economic-trade deal with Theresa May?” “I am confident that he (Trump) will attempt to alter the global hierarchy. One way of changing the system will be to focus on trade. He can make tactical adjustments to trade policy that will not only give him the front-page news he craves, but will enact the kind of systemic change upon which he ran for president.” Source: http://www.just-style.com/comment/trump-trade-policy-who-knows-what-hell-do_id129295.aspx

US-China Trade War? Keep a close watch

Augustine Tantillo, president and chief executive officer of the National Council of Textile Organizations (NCTO): “(I) would be surprised if Trump does not take some steps to crack down on currency devaluation, particularly as it relates to China.” Source: http://wwd.com/business-news/government-trade/donald-trump-on-trade-taxes-and-regulations-10702130/

 Chad Bown, Senior Fellow of the Peterson Institute for International Economics: “What he (Trump) has said is that they (China) manipulate their currency and he has threatened to impose tariffs upwards of 45%. The concerns with doing that is that we (USA) do have a trade agreement with 163 other economies of the world, the WTO. China is a part of that and by doing that (imposing tariffs upwards of 45%) unilaterally, would be violating our commitments, legal commitments to our trading partners under that deal and China would be authorized and probably would retaliate and strike back and probably do the same thing against the United States which would mean U.S. companies and exporters that make goods and agricultural products, and send those to China would suffer as a retaliatory response.” Source: https://www.c-span.org/video/?417891-3/washington-journal-chad-bown-trade-policy-trump-administration

Textile and apparel industry needs NAFTA 

Steve Lamar, executive vice president for the American Apparel & Footwear Association(AAFA): “It is well established that CAFTA and NAFTA are critical for the U.S. textile and apparel industry. The things we have continued to argue is how to find ways to make it better… NAFTA was negotiated when there were no other free-trade agreements and the world was surrounded by quotas and rules of origin that catered to the United States. But the industry has evolved.” “Trump will renegotiate NAFTA and is only threatening to abrogate the free-trade accord… Trump likes to build up leverage to get the best possible deal, and he can view trade with that same lens.” Source: https://www.apparelnews.net/news/2016/nov/17/how-would-end-nafta-affect-la-apparel-industry/

Augustine Tantillo, president and chief executive officer of the National Council of Textile Organizations (NCTO): “there will be a ‘level of caution,’ when it comes to renegotiating NAFTA. This agreement has been in place for a while and it would be clearly disruptive to simply walk away from it at this point.” Source: http://wwd.com/business-news/government-trade/donald-trump-on-trade-taxes-and-regulations-10702130/

Leonie Barrie, Managing editor of Just-Style: “Will a Trump administration revisit NAFTA? Such a prospect is a concerning one because NAFTA’s free trade framework with Mexico has been at the heart of many sourcing strategies in North America. The US exported $6.5bn of apparel and textiles to Mexico last year and, in turn, Mexico shipped $4.2bn to the US. Earlier this year executives told just-style that if Trump went ahead with threats to build a 3,200-kilometre fence on the Mexican-American border to stem immigration, it could cut $2.2bn or 20% of the $11bn in US-Mexican textiles and apparel trade in its first year.” Source: http://www.just-style.com/comment/what-might-a-trump-presidency-mean-for-apparel_id129260.aspx

Please feel free to respond to any comments above or leave your thoughts.

The Future of the Asia-Pacific Region as a Textile and Apparel Sourcing Destination: Discussion Questions Proposed by FASH455

asia-pacific-economy-v7

#1 How have US importers/retailers/fashion brands which source from China reacted to China’s rising labor cost in recent years? Any specific examples of companies’ practices and strategies?

#2 It is widely reported that China’s labor cost has been rising quickly in recent years (around 14% annually between 2010 and 2014). But trade data didn’t show a significant drop of China’s textile and apparel exports to the US. Why is that?

#3 Why do you think people have a conception of China being a “highly reliable” sourcing destination for textile and apparel? What is China’s unique competitiveness?

#4 Many domestic and foreign firms have started investing in textile/fiber factories in Vietnam because of the yarn forward rules of origin in TPP. Would it be in the United States’ best interest to become one of these investors? Why or why not?

#5 In the class we discussed the “flying geese model” and the phenomenon of “Factory Asia”. Particularly, Asian countries are forming an ever more integrated textile and apparel supply chain—for example, apparel manufacturers in Asia are gradually using more textile inputs made in Asia rather than made outside the region. Does it mean that the United States has no role to play in Asia-based textile and apparel supply chain? Will the TPP make a difference?

#6 Should US allow China to join the TPP? Why or why not? If China joins the TPP, what will be the implications for the pattern of textile and apparel trade in the Asia-Pacific region?

 #7 What is the relationship between the Regional Comprehensive Economic Partnership (RCEP) and the Trans-Pacific Partnership (TPP)? Alternatives? Competitors? Friends? Foes? Why are there so many different free trade agreements (FTA) in the same region?

Please feel free to share your thoughts and recommend any additional articles/readings/resources relevant to the discussion. Please mention the question # in your reply.


Debate on the Trans-Pacific Partnership and the Textile and Apparel Industry: Questions from FASH455

comm-tpp-map-05272016-lg

#1 Overall, do you think the Trans-Pacific Partnership (TPP) reflect the commercial interests of the U.S. textile industry and/or U.S. apparel industry? Why?

#2 We know that the U.S. textile industry (such as NCTO) strongly supports a strict yarn-forward RoO in TPP whereas apparel retailers and fashion brands (such as USFIA and AAFA) say the yarn-forward style RoO is outdated and unworkable for apparel companies’ global apparel supply chain.  If you were U.S. policymakers, what would you do to “balance” these two conflicting arguments?

#3 Research shows that many free trade agreements enacted in the United States are with a very low utilization rate. Will TPP face the same fate? Why or why not?

#4 It is said that TPP has the strongest protections for workers of any trade agreement in history, requiring all TPP Parties to adopt and maintain in their laws and practices the fundamental labor rights as recognized by the International Labor Organization (ILO). But why do most U.S. labor unions still oppose the agreement?

#5 Will TPP exert a negative impact on the Western Hemisphere supply chain? Why or why not? How should apparel manufacturers in the NAFTA and CAFTA-DR region respond to the potential impact of TPP, especially the intensified competition from Vietnam?

Please feel free to share your thoughts and recommend any additional articles/readings/resources relevant to the discussion. Please mention the question # in your reply.

Statistics: Global Apparel Market 2016-2020

Updated statistics: Global Apparel Market 2018-2022

market-value

growth

market-size

market-share

Data source: Euromonitor Passport (2016)

Related: Market Size of the Global Textile and Apparel Industry: 2015 to 2020

China’s 13th Five-Year Plan for Its Textile and Apparel Industry: Key Numbers

chinas-13th-five-year-planBy Sheng Lu

Pattern of U.S. Textile and Apparel Imports (Updated: September 2016)

textile and apparel imports 2015

U.S. textile and apparel imports enjoy steady growth from 2000 to 2015. Specifically, the value of U.S. textile imports reached $26,763 million in 2015, up 4.2 percent from 2014 and 85.1 percent from 2000. The value of U.S. apparel imports reached $85,165 million in 2015, up 4.1 percent from 2014 and 48.8 percent from 2000.  It is forecasted that the value of U.S. textile and apparel imports could reach $27,355 million (up 2.2 percent) and $85,719 million (up 0.7 percent) respectively in 2016.

product structure

Because the United States is no longer a major apparel manufacturer but one of the largest apparel consumption markets in the world, apparel products accounted for 76.1 percent of total U.S. textile and apparel imports in 2015, followed by made-up textiles (16.9 percent), fabrics (5.8 percent) and yarns (1.3 percent).

top supplier

In terms of source of products, U.S. imported apparel from as many as 150 countries in 2015. However, Herfindahl index reached 0.15 for knitted apparel (HS chapter 61) and 0.18 for woven apparel (HS chapter 62) in 2015, suggesting this is a market with a high concentration of supplying countries. Specifically, all top apparel suppliers to the United States in 2015 (by value) are developing countries and most of them are located in Asia, including China (35.9 percent), Vietnam (12.4 percent), Bangladesh (6.3 percent), Indonesia (5.8 percent), India (4.3 percent) and Mexico (4.2 percent).

price

U.S. textile and apparel imports are also becoming even cheaper. For example, U.S. apparel imports in 2015 on average was only 85.7 percent of the price in 1990 and the price of imported fabrics cut almost by half over the same period.

fast growing categories

From 2013 to 2015, the fastest growing textile and apparel import categories unusually include several fabric products, such as blue denim (OTEXA code 225, up 74.8%), Cheesecloths (OTEXA code 226, up 74.3%) and woven fabrics (OTEXA code 611, up 49.3%).  It is likely that the growing business of apparel “Made in USA” has led to an increased demand for imported fabrics.  

growth rate

Additionally, U.S. apparel imports overall mirror the pattern of apparel retail sales in the U.S. market. This reflects the fact that the performance of the U.S. economy is the leading factor shaping the size of demand for imported apparel. It is also interesting to note that the value of U.S. apparel imports grew at a faster rate than the value of U.S. apparel retail sales in 2015 (4.1 percent v.s. 1.7 percent), suggesting import penetration ratio (i.e. the percentage of apparel consumed in the United States that is supplied by imports) continues to rise.

Data source: Office of Textiles and Apparel (OTEXA), U.S. Department of Commerce

by Sheng Lu

2016 August Sourcing at Magic Debriefing

FullSizeRender.jpg

New landscape of sourcing

  • Sourcing is turning from regional to global. In the past, U.S. apparel companies/fashion brands set up regional offices to handle sourcing. Nowadays, companies are building a global infrastructure to develop, source and market their products around world. Global rather than regional sourcing also allows companies to improve sourcing efficiency and reduce total product and distribution cost while maintaining quality of their product and services.
  • U.S. apparel companies/fashion brands are going with fewer but more capable vendors (“super vendors”). For example, executive from a leading U.S. apparel brand said their company has shrunk their sourcing base by 40% in the past few years. At the same time, they now expect their vendors to be able to supply on a global scale, including having multiple manufacturing facilities around the world and being able to provide value added services such as design and product development.
  • Related, sourcing is shifting from cut-make-and trim (CMT) to full package. This is consistent with our findings in the latest USFIA benchmarking study which suggests that vendors are highly expected to have the capacity of supplying raw material.
  • U.S. apparel companies/fashion brands are also investing to build a more partnership-based relationship with vendors— help vendors reduce cost, become more innovative and have the same vision looking at the whole picture of the supply chain. At the same time, U.S. apparel companies/fashion brands see vendors as their “ambassadors” and want to know more about them—what they believe, what they can bring to the table and how they treat their workers.
  • Companies are redefining the role of sourcing in their businesses. Sourcing is no longer treated as a technical function, but an integral part of a company’s overall business strategy.  

 IMG_2041

Made in USA

  • There is a noticeable interest in sourcing textiles and apparel “Made in USA” at Magic. A dozen U.S.-based apparel companies attended the Magic show and their booths attracted a heavy traffic. According to representatives from these companies, U.S. consumers’ increased demand for apparel “Made in USA” has been a strong support for their business growth in recent years.
  • Nevertheless, apparel “Made in USA” often contain imported inputs today. I specifically asked a few vendors where their fabrics come from. All but one company said fabrics were imported because it was so hard to find domestic suppliers, especially for woven fabrics. Interesting enough, some companies feel OK to label their apparel “Made in USA” even though they use imported fabrics. According to them, apparel can be labeled “Made in USA” as long as “domestic content exceeds 60% of the value of the finished product.”
  • At a seminar, some entrepreneurs which make and sell “Made in USA” apparel and accessories said price and production cost remain one of their top business challenges. I asked the panel whether going high-end is the only option for the future of apparel “Made in USA” given the high labor cost in the country. They disagreed—saying technology advancement and design innovation could help reduce production cost. However, all panelists admit they carry some luxury product lines. Additionally, some companies choose to emphasize concepts other than “Made in USA”, such as “hand-made” and “Pride in Seattle”, in order to make their products look more personal to consumers and allow more flexibility in sourcing raw material.

12751249_584173535074689_533837109_n

Updates of sourcing destinations

  • Ethiopia: as I observe, Ethiopia is THE star at this year’s Sourcing at Magic. The country was repeatedly mentioned by panelists at various seminars as a promising and emerging sourcing destination. Several events at the show were also exclusively dedicated to promoting apparel and footwear “Made in Ethiopia”. A couple of reasons why Ethiopia is so “hot”: 1) the ten year extension of AGOA creates a stable market environment encouraging sourcing from Africa and investing in the region (and for sure the duty free access both to the US and EU market).  2) Located in the middle of Africa, Ethiopia is regarded as a hub that has the potential to take a leadership role in integrating the apparel supply chain in the region. 3) It is said that Ethiopian government is very supportive to the development of the local textile industry.  4) Many U.S. fashion companies feel sourcing from Ethiopia involves less risks of trade compliance than sourcing from some Asian countries such as Bangladesh.  
  • China: China unarguably remains the No.1 textile and apparel supplier to the U.S. market—in terms of numbers, around 60% vendors at the Magic show came from China. But I notice that booths of Chinese vendors didn’t have much traffic this time, an interesting signal for sourcing trend in the upcoming season. Nevertheless, while U.S. apparel companies/fashion brands are placing more emphasis on supply chain efficiency, quality of products, speed to market and added value in sourcing, “Made in China” will continue to enjoy many unique advantages over other suppliers. Plus, Chinse factories are actively investing overseas, from Southeast Asian countries to Africa. This makes Chinese factories likely to grow into “super vendors” that western fashion brands/retailers are looking for. To certain extent, macro trade statistics alone may not be able to fully reveal what is going on in apparel sourcing and trade.   
  • Vietnam: Regarding the future of Vietnam as a sourcing destination for U.S. apparel companies/fashion brands, somehow I hear more concerns than excitements at Magic. The uncertainty surrounding the ratification of TPP by the U.S. Congress definitely has made some companies hold back their investment and sourcing plan in Vietnam. Another big concern is Vietnam’s labor shortage and limited manufacturing capacity: apparel factories in Vietnam are already competing with electronic industry for young skilled workers. US companies also have to compete with their EU counterparts for orders in Vietnam. The newly reached EU-Vietnam Free Trade Agreement (EVFTA), which is very likely to be implemented earlier than TPP, provides Vietnam duty free access also to the EU market. And EVFTA adopts a much more flexible rule of origin than TPP, making it easier for Vietnam factories to actually use the agreement.

Sustainability

The awareness of social responsibility and sustainability has much improved: everyone in the industry is talking about them and have a view on them. On a voluntary basis, some companies are making efforts to improve traceability of their products, i.e. to help consumers know exactly where their clothing comes from and what is happening at the upstream of the supply chain. Yet, how to encourage factories to share their information and control tier 2 and tier 3 suppliers remain a challenge. 

by Sheng Lu

Note: Sourcing at Magic is one of the largest and most influential annual textile and apparel sourcing events hosted in the United States. Special thanks to the Center for Global and Areas Studies at the University of Delaware for funding the trip.

Apparel “Made in America” of Imported Fabrics

clinton

Presidential candidate Hillary Clinton recently launched a new website “Made In America: A Buyer’s Guide for Donald Trump”, which highlighted hundreds of U.S. manufacturers for products ranging from men’s ties, suits to furniture. 

Joseph Abboud is one of the companies highlighted by the website for making “Made in America” suites and shirts. But does “Made in America” mean a Joseph Abboud branded suit or shirt is 100% made in the United States from yarns, fabrics to the cut-and-sew process? Not necessarily!

joseph abboud

According to information submitted by Joseph Abboud to the “Made in USA” database managed by the Office of Textiles and Apparel under the U.S. Department of Commerce, some of its products actually are “partially made in U.S.A. with imported fabrics”.

This is evidenced both by Joseph Abboud’s product label and information provided by some retailers which sell Joseph Abboud’s branded products (See pictures below).

joseph-abboud-brown-black-wool-made-in-usa-sport-coat-jacket-big-tall-44xl-fadae0181dabefde4a3e87afdb831478

men

Hamilton Shirts of Houston is another company highlighted by Clinton’s “Made in USA” website. But similar as the case of Joseph Abboud, a Hamilton branded shirt priced at $215-$245 is typically “Hand cut and sewn in the USA. 100% cotton Italian fabric.”

Untitled

Actually, Joseph Abboud is a brand owned by JA Holding, Inc., which was acquired by Tailored Brands for $94.9 million on August 6, 2013. As of June 2016, Tailored Brands also owns the Men’s Wearhouse and Jos. A. Bank.

Like most other US apparel companies/fashion brands today, Tailored Brands commits to global sourcing. In fiscal year 2015, the company “sourced approximately 60% of direct sourced merchandise from Asia (36% from China) while 13% was sourced in the U.S., 12% in Mexico, and 15% was sourced in other regions.” (Source: Tailored Brands Annual Report, 2015)

Tailored Brands uses the factory in New Bedford, MA (the one highlighted by Clinton’s website) to make tailored clothing under the Joseph Abboud label, including designer suits, tuxedos, sport coats and slacks which they sell in Men’s Wearhouse stores as well as Joseph Abboud’s flagship store. Tailor Brands also sells Joseph Abboud branded products in Moores stores, which are made in Canada by a third party.

Related article: Clothing Label Reveals the Global Nature of the Textile and Apparel Industry 

Disclaimer: All blog posts on this site are for FASH455 educational purposes only and they are nonpolitical and nonpartisan in nature. No blog post has the intention to favor or oppose any particular presidential candidate, nor shall be interpreted in that way.

How is China’s Garment Industry Dealing with Rising Labor Costs?

Please feel free to share your views on the following discussion questions based on the video:

China is no longer one of the cheapest places to produce garments. The minimum monthly wages in China have far exceeded those in Bangladesh, India and Cambodia:

  • How are Chinese garment factories coping with the challenges of rising labor cost?
  • Is adopting Taylor’s “scientific management”, i.e. asking skilled workers to do less skilled jobs in a more specialized production line, a smart idea?
  • What is your view on the growing difficulty of hiring and retaining young skilled workers for the garment industry in China?
  • Any other thoughts on the video?

Appendix: State of China’s Apparel Exports in 2015

According to the UNComtrade, China remains the world’s largest apparel exporter in 2015 (37.4% world share for knitted apparel, HS61 and 34.9% for woven apparel, HS62).

61

62From 2011 to 2015, “Made in China” continues to acquire more market shares in some key apparel import markets in the world, including the United States and UK (i.e. China’s apparel exports to these markets grew at a faster rate than these countries’ apparel import growth from the world—bubbles in blue in the figures below). Nevertheless, in some other markets (bubbles in yellow in the figures below), notably Japan and Germany, China is losing market shares to other garment exporters such as Vietnam and Bangladesh.

61 market

62 growth

WTO Reports World Textile and Apparel Trade in 2015

The World Textile and Apparel Trade in 2016 is now available

textile

clothing

According to the newly released World Trade Statistical Review 2016 by the World Trade Organization (WTO), the current dollar value of world textiles (SITC 65) and apparel (SITC 84) exports totaled $291 billion and $445 billion respectively in 2015, but decreased by 7.2 percent and 8.0 percent from a year earlier. This is the first time since the 2009 financial crisis that the value of world textiles and apparel exports grew negatively.

However, textiles and apparel are not alone. The current dollar value of world merchandise exports also declined by 13 percent in 2015,to $16.0 trillion, as export prices fell by 15 percent. In comparison, the volume of world trade grew slowly at a rate of 2.7 percent, which was roughly in line with world GDP growth of 2.4 percent. WTO says that falling prices for oil and other primary commodities, economic slowdown in China, a severe recession in Brazil, strong fluctuations in exchange rates, and financial volatility driven by divergent monetary policies in developed countries are among the major factors that contributed to the weak performance in world trade.

Textile and apparel exports

China, the European Union and India remained the top three exporters of textiles in 2015. Altogether, they accounted for 66.4 percent of world exports. The United States remained the fourth top textile exporter in 2015. The top ten exporters all experienced a decline in the value of their exports in 2015, with the highest declines seen in the European Union (-14 percent) and Turkey (-13 percent). The smallest decline was recorded in China (-2 percent).

Top three exporters of apparel include China, the European Union and Bangladesh. Altogether, they accounted for 70.3 percent of world exports. Among the top ten exporters of apparel, increases in export values were recorded by Vietnam (+10 percent), Cambodia(+8 percent), Bangladesh (+6 percent) and India (+2 percent). The other major exporters saw stagnation in their export values (United States) or recorded a decline (all other top ten economies).

china's market share

Additionally, despite reported rising production cost, China’s market shares in world textile and apparel exports continued to rise in 2015 (see the figure above).

Textile and apparel imports

The European Union, China and the United States were the top three importers of textiles in 2015. However, altogether they accounted for only 37 percent of world imports, down from 52.8 percent in 2000. Because a good proportion of textiles made by developed countries (such as the United States) are exported to developing countries for apparel manufacturing purposes, the pattern reflects the changing dynamics of world apparel manufacturing and exports in recent years.

Because of consumers’ purchasing power (often measured by GDP per capita) and size of the population, the European Union, the United States and Japan remained the top three importers of apparel in 2015. Altogether, they accounted for 59 percent of world imports, but down from 78 percent in 2000. This indicates that import demand from other economies, especially some emerging markets, have been growing faster over the past decade.

world trade 2016

Turning Africa into a Global Textile and Apparel Hub

Before the 2016 Source Africa Trade event in June 2016, CNBC interviewed Tim Armstrong, Investment Promotion Director for the Textile Development Unit at the Ministry of Industry and Trade in Tanzania. Three questions were discussed during the interview:

  • Are free trade agreements/trade preference programs such as the African Growth and Opportunity Act (AGOA) translating into tangible results we can see that help African clothing exporters?
  • What has AGOA extension done to the textile and apparel industry in Africa, particularly in the context of Tanzania? What are the impacts of rules of origin on investment in the region?
  • Can apparel “Made in Africa” compete in the global marketplace when raw material such as yarns and fabrics has to be sourced from elsewhere?

What is your view on these issues?

Vietnam’s Apparel Exports Slow in First Half of 2016

Growth rate of Vietnam

According to Thanh Nien News, Vietnam’s textile and apparel (T&A) exports only increased 5.1 percent to $10.7 billion in the first half of 2016. This was the lowest growth rate since 2010. Data from the General Statistics Office of Vietnam shows that Vietnam’s T&A exports totaled $22.63 million in 2015, up 8.2 percent from a year earlier.

In the U.S. market, apparel imports from Vietnam also see a much slower growth in the first five months of 2016: 4.1% by value (compared with 13.1% on average between 2010 and 2015) and 5.0% by quantity (compared with 11.8% on average between 2010 and 2015).

Vietnam

The new trade data echos the findings in the latest 2016 US Fashion Industry Benchmarking Study. Although Vietnam remains one of the top sourcing destinations, respondents seem to be more conservative about Vietnam’s growth potential in the next two years. Only 4 percent of respondents expect a strong increase of sourcing value or volume from the country, which is a substantial drop from 21.4 percent in the 2015 study.

USITC Studies the Impact of Trade on Manufacturing Jobs in the U.S. Textile and Apparel Industry

job impact of trade

employment in the US T&A industry

In its newly released Economic Impact of Trade Agreement Implemented under Trade Authorities Procedures, 2016 Report, the U.S. International Trade Commission (USITC) provides a quantitative assessment on the impact of trade on manufacturing jobs in the U.S. textile and apparel industry. According to the report:

  • Manufacturing jobs in the U.S. textile and apparel industry have been declining steadily over the past two decades. Between 1998 and 2014, employment in the NAICS 313 (textile mills), NAICS314 (textile product mills) and NAICS 315 (apparel manufacturing) sectors on average decreased annually by 7.6 percent, 4.3 percent and 11.2 percent, respectively.
  • Rising import is found NOT a major factor leading to the decline in employment in the U.S. textile industry (NAICS 313)–as estimated, imports only contributed 0.4 percent of the total 7.6 percent annual employment decline in the U.S. textile industry. Instead, more job losses in the sector are found caused by improved productivity as a result of capitalization & automation (around 4.6 percent annually) and the shrinkage of domestic demand for U.S. made textiles (around 3.5 percent annually) between 1998 and 2014.
  • Rising imports is the top factor contributing to job losses in apparel manufacturing (NAICS 315), however. As estimated by USITC, of the total 11.2 percent annual employment decline in apparel manufacturing, almost all of them is affected by imports (10.8 percent). On the other hand, increased domestic demand for apparel (such as from U.S. consumers) is found positively adding manufacturing jobs by 2 percent annually in the United States from 1998 to 2014.
  • To be noted, USITC did not estimate the impact of trade on employment changes in the retail aspect of the industry. According to the U.S. Bureau of Labor Statistics, approximately 80 percent of jobs in the U.S. textile and apparel industry came from retailers in 2015. These retail-related jobs are typically “non-manufacturing” in nature, such as: fashion designers, merchandisers, buyers, sourcing specialists, supply chain management specialists and marketing analysts.

2016 U.S. Fashion Industry Benchmarking Study Released

The 2018 U.S. Fashion Industry Benchmarking Study is now available
usfia 2016 cover_Page_1

The report can be downloaded from HERE

Key Findings of the study:

I. Business environment and outlook in the U.S. Fashion Industry

  • Overall, respondents remain optimistic about the five-year outlook for the U.S. fashion industry. “Market competition in the United States” is ranked the top business challenge this year, which, for the first time since 2014, exceeds the concerns about “increasing production or sourcing cost.”

II. Sourcing practices in the U.S. fashion industry

  • U.S. fashion companies are more actively seeking alternatives to “Made in China” in 2016, but China’s position as the No.1 sourcing destination seems unlikely to change anytime soon. Meanwhile, sourcing from Vietnam and Bangladesh may continue to grow over the next two years, but at a slower pace.
  • U.S. fashion companies continue to expand their global reach and maintain truly global supply chains. Respondents’ sourcing bases continue to expand, and more countries are considered potential sourcing destinations. However, some companies plan to consolidate their sourcing bases in the next two years to strengthen key supplier relationships and improve efficiency.
  • Today, ethical sourcing and sustainability are given more weight in U.S. fashion companies’ sourcing decisions. Respondents also see unmet compliance (factory, social and/or environmental) standards as the top supply chain risk.

III. Trade policy and the U.S. fashion industry

  • Overall, U.S. fashion companies are very excited about the conclusion of the Trans-Pacific Partnership (TPP) negotiations and they look forward to exploring the benefits after TPP’s implementation.
  • Thanks to the 10-year extension of the African Growth and Opportunity Act (AGOA), U.S. fashion companies have shown more interest in sourcing from the region. In particular, most respondents see the “third-country fabric” provision a critical necessity for their company to source in the AGOA region.
  • Free trade agreements (FTAs) and trade preference programs remain underutilized in 2016 and several FTAs, including NAFTA and CAFTA-DR, are utilized even less than in previous years. U.S. fashion companies also call for further removal of trade barriers, including restrictive rules of origin and remaining high tariffs.

The benchmarking study was conducted between March 2016 and April 2016 based on a survey of 30 executives from leading U.S. fashion and apparel brands, retailers, importers, and wholesalers. In terms of business size, 92 percent of respondents report having more than 500 employees in their companies, while 84 percent of respondents report having more than 1,000 employees, suggesting that the findings well reflect the views of the most influential players in the U.S. fashion industry.

For the benchmarking studies in 2014 and 2015, please visit: https://www.usfashionindustry.com/resources/industry-benchmarking-study

Global Apparel and Footwear Industry (Updated in June 2016)

1

2

The global apparel and footwear industry enjoys a 5 percent value growth in 2015. Asia Pacific remains the world’s largest apparel and footwear market, with market value increased by $30 billion USD in 2015.  In particular, the United States, China and India contributed more than half the absolute increased value.

Market growth in Western Europe remains stagnant in 2015. However, some countries performed better than others. For example, apparel and footwear sales continued to experience significant losses in Greece and Italy with 7 percent and 2 percent declines in 2015, respectively. France didn’t do very well either and size of the French market is expected to contract by $1.5 billion USD by 2020. In comparison, UK, Western Europe’s largest market, posted modest 1 percent growth in 2015. Performance in Germany remained overall stable.

US

The US market continues to perform well with healthy value growth of 4 percent in 2015. However, the performance of key players such as J Crew and Gap, both of which plan to close a significant number of physical stores and lay off employees, highlight the increasingly competitive trading environment. US consumers overall remain cautious and adopt a value- driven approach to buying clothes resulting in a continuous discounting cycle, negatively impacting profit margins and slowing growth for the industry as a whole. From 2013 to 2014, volume growth of apparel sales in the United States exceeded value, primarily due to discounting, the proliferation of fast fashion brands and greater availability of low prices online. However, value growth returned to a more robust position in 2015, as a strengthening economy, improvements in the labor market and rising wages support future growth.

3

Sportswear is maintaining its momentum, increased by 8 percent in market value from 2014 to 2015, faster than any other apparel product categories. Consumers no longer consider sport a task that needs to be checked off on a day-to-day basis but instead it has become a lifestyle. Athleisure remains a heavily prominent trend as more consumers adopt an active and healthy lifestyle, increasing the demand for athletic products that are technically advanced and fashionable. In response to the evolving athleisure trend, major sportswear brands have turned their attention to women’s sports apparel and footwear. With Skechers, Lululemon, Under Armour and Nike reporting growth of 33 percent, 20 percent, 19 percent and 12 percent, respectively, in 2015.

4

Currency weakness, political unrest and tough economic environments continue to result in slowing growth among the emerging markets. However, internet retailing & e-commerce is a spotlight. Apparel and footwear sales through internet retailing grew by 23 percent in 2015 globally and are expected to continue providing impressive growth for apparel brands to 2020. Global mobile internet retailing has grown at a rapid of 92 percent over 2011-2015, highlighting the increasingly vital role mobile is playing within the buying process. Notably, emerging markets are accounting for a significant proportion of growth and are expected to boast a higher market size than developed markets by 2018.

Data source: Euromonitor Passport