Regarding Levi’s “new normal” for apparel sourcing and supply chain management, what is Harmit Singh’s vision? Why or why not do you agree with him?
How could Levi’s digital transformation plans affect its sourcing practices?
What is your evaluation of Levi’s “tailor shop” program?
What is the rationale behind Levi’s “buy better and wear better” initiative?
What is a chief financial officer (CFO)’s role in helping Levi’s achieve its sustainability goals?
Anything else you find interesting/intriguing/new/inspiring from the video and why?
About Levi’s
Levi’s supplier map (source: Open Apparel Registry)
Levi Strauss & Co is a global apparel company rooted in the jeans category. Its brand portfolio consists of Levi’s brand, Levi’s Signature, Dockers, and Denizen. In 2020, Levi’s global sales exceeded $7.1 billion. The United States is Levi’s largest market, accounting for about 41% of its sales in 2020, followed by Mexico. As of June 2021, Levi’s sources its apparel products from around 350 factories located in about 30 countries.
Years before the pandemic, Levi Strauss has begun to reduce its reliance on wholesalers and instead expand its direct-to-consumer (DTC) business. In response to COVID-19, Levi Strauss has increased flexibility and resilience through diversification across geographies, categories, genders, and distribution channels. Levi’s is also well-known as a leader in sustainability, particularly reducing chemical and water use in products.
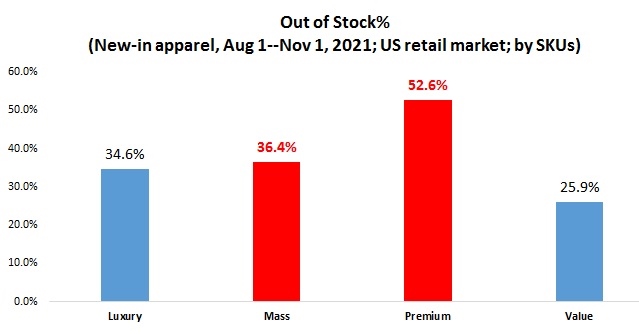
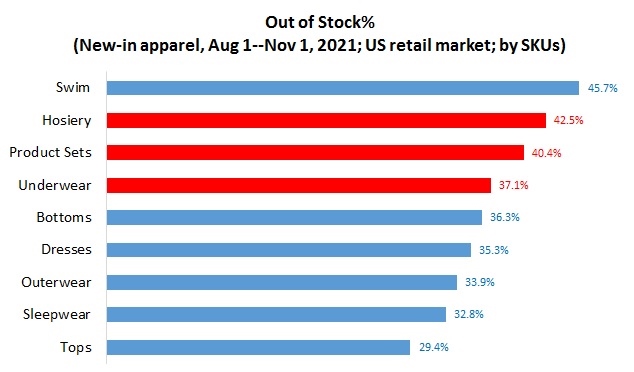
US fashion brands and apparel retailers face the challenge of running out of inventory amid the holiday season and the ongoing shipping crisis. Based on consultation with industry insiders and resources, we take a detailed look at which apparel products are more likely to be out of stock in the US retail market. Several patterns are noteworthy:
First, clothing products targeting the premium and mass market face more significant shortages than luxury or value apparel items in the US. Take clothing items in the premium market, for example. Of those apparel products newly launched to the US retail market from August 1 to November 1, 2021, nearly half of them were already out of stock as of November 10, 2021 (note: measured by SKUs). The increased demand from middle-class US consumers could be among the primary contributing factors.
Second, seasonal products and stable fashion items are more likely to be out of stock. For example, as we are already in the winter season, it is not surprising to see many swimwear products run out of stock. Meanwhile, it is interesting to see stable fashion products like hosiery and underwear also report a relatively high percentage of inventory shortage. The result could be the combined effects of consumers’ robust demand and the shipping delay.
Third, apparel products locally sourced from the US seem to have the lowest out-of-stock rate. Reflecting the shipping crisis, clothing items sourced from Bangladesh and India report a much higher out-of-stock rate. However, a substantial percentage of “made in the USA” apparel was in the category of “T-shirt”, implying switching to domestic sourcing often is not a viable option for US fashion brands and retailers.
Additionally, fast fashion retailers overall report a much lower out-of-stock rate than department stores and specialty clothing stores. This result showcases fast fashion retailers’ competitive advantages in supply chain management, which payoffs in the current challenging business environment.
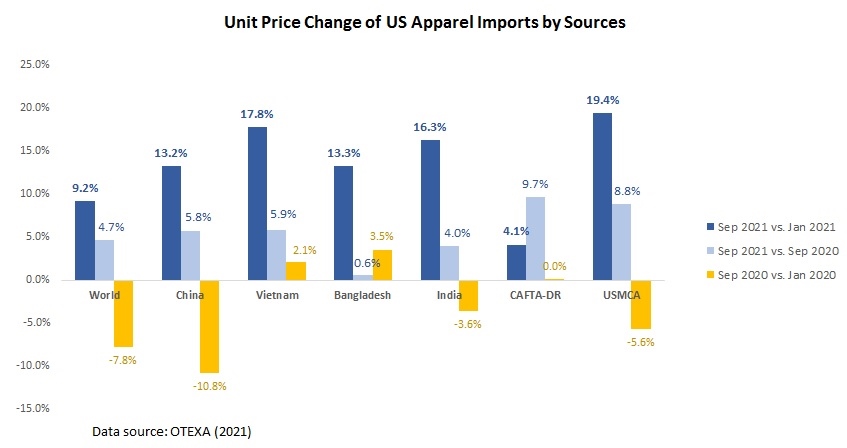
On the other hand, the latest trade data suggests a notable increase in the price of US apparel imports. Notably, the unit price of US apparel imports from almost all leading sources went up by more than 10% from January 2021 to September 2021.
Today, fashion companies consider a long list of factors when deciding where to source their apparel products, ranging from cost, speed to market, flexibility to the risk of social and environmental compliance. While existing studies have identified these major sourcing factors, whether they are treated equally in companies’ apparel sourcing decisions remains mostly unknown. Neither is it clear how fashion companies make a trade-off among these sourcing factors, given no sourcing destination is perfect.
This study aims to quantitatively evaluate the influence of primary sourcing factors on fashion companies’ determination of apparel sourcing destinations. For the study, we collected a detailed evaluation of the world’s 27 largest sourcing destinations in 2019 against 15 specific performance indicators from GlobalData, one of the most popular sourcing analytics tools. The evaluation uses a 5-point rating scale for each performance indicator.
Because some of these 15 performance indicators measure similar items, we first conducted an exploratory factor analysis, which reduced these indicators to five principal sourcing factors based on their correlation matrix scores. These five principal sourcing factors cover the following themes:
Capacity: It covers seven performance indicators that measure a sourcing destination’s capabilities (including flexibility and lead time) of providing apparel products and other value-added services.
Price & Tariff: It covers two performance indicators that measure the financial implications of sourcing from a particular destination, including eligibility for preferential import duties.
Stability: It covers two performance indicators that measure a sourcing destination’s macro-business environment, specifically sourcing-related political and economic climates.
Sustainability: It encompasses all social and environmental compliance issues related to apparel production and sourcing.
Quality: It covers two performance indicators that measure whether a sourcing destination obtains skilled workers and the overall quality of its products.
Next, we calculated the 27 apparel exporting countries’ average scores of these five principal sourcing factors. Based on the results, we further conducted a multiple regression analysis to evaluate the impact of the five principal sourcing factors on the value of these 27 countries’ apparel exports to the U.S., EU, and Asia in 2019, respectively. These three regions combined accounted for more than 80% of world apparel imports that year; however, fashion companies in each area are suggested to have unique sourcing preferences.
First, the result suggests that improving the performance in Stability and Quality can help a country enhance its attractiveness as an apparel sourcing base in the U.S. and Asia markets, but not so much in the EU market.
Second, a higher score for the factor Sustainability does not result in more sourcing orders at the country level in all three markets examined. It seems fashion companies’ current sourcing model does not provide substantial financial rewards encouraging better performance in sustainability. It is also likely that sustainability and compliance are treated more as pre-requisite criteria instead of determining the volume of the sourcing orders.
Third, the impact of Price & Tariff and Capacity on the value of apparel imports is not statistically significant in any of the three markets examined. This result does NOT necessarily mean price and production capacity is irrelevant. Instead, the result implies that fashion companies’ sourcing decision today is not merely about “chasing the lowest price.” Meanwhile, due to concerns about supply chain risks, even the most “economically competitive” sourcing destination won’t receive all the sourcing orders.
The findings of the study suggest that fashion companies’ sourcing decisions today appear to be more complicated and subtle than what is revealed by the existing literature and the public perception. Notably, the findings present different views from previous studies regarding how sourcing cost and sustainability affect fashion companies’ selection of sourcing destinations.
The findings also call our attention to the significant impact of non-economic factors on companies’ sourcing decisions, particularly the perceived political risks. This result explained why fashion companies had quickly reacted to the recent forced labor concerns in Xinjiang, China, and the military coup in Myanmar and halted sourcing from the regions.
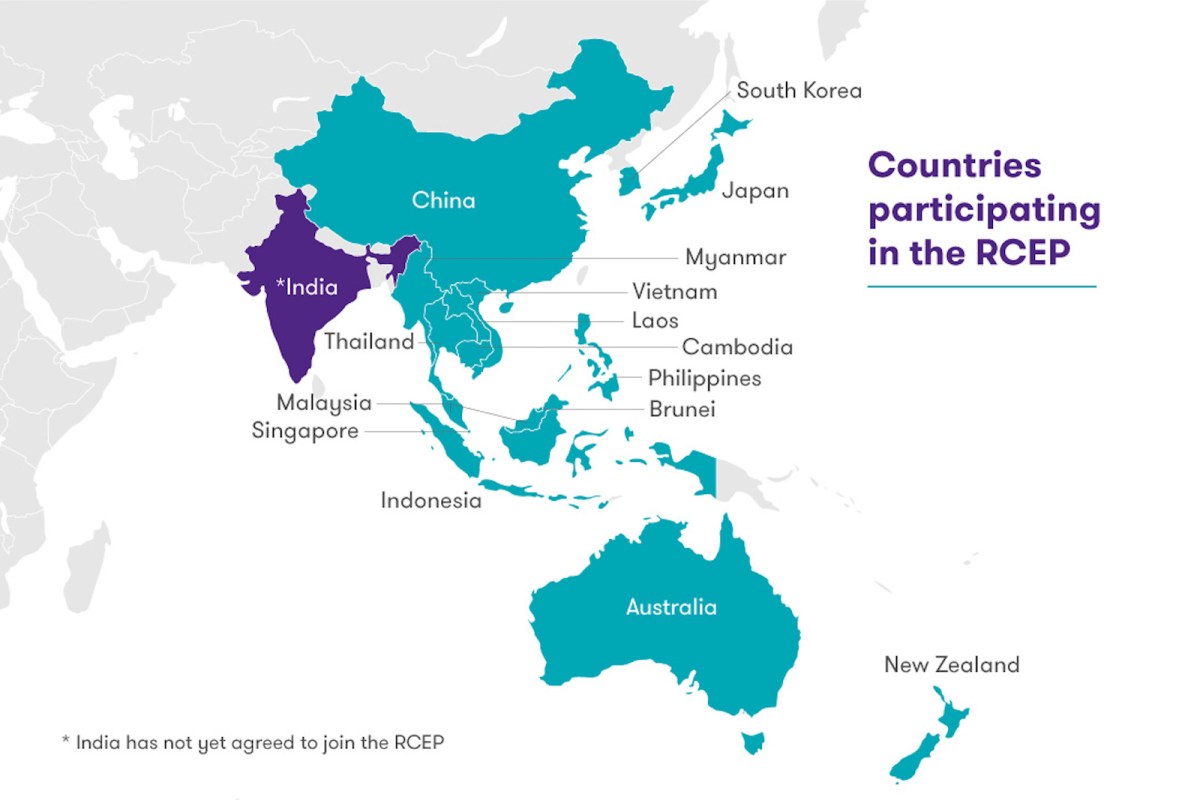
The Regional Comprehensive Economic Partnership (RCEP)is a free trade agreement between ten member states of the Association of Southeast Asian Nations (ASEAN)* and five other large economies in the Asia-Pacific region (China, Japan, South Korea, New Zealand, and Australia). RCEP was reached on November 15, 2020, after nearly eight years of tough negotiation. (Note: ASEAN members include Brunei, Cambodia, Indonesia, Laos, Malaysia, Myanmar, the Philippines, Singapore, Thailand, and Vietnam. India was an original RCEP member but decided to quit in late 2019 due to concerns about competing with Chinese products, including textiles and apparel.)
So far, RCEP is the world’s largest trading bloc. As of 2019, RCEP members accounted for nearly 26.2% of world GDP, 29.5% of world merchandise exports, and 25.9% of world merchandise imports.
As of November 1, 2021, Lao, Burnei, Cambodia, Singapore and Thailand (ASEAN members), as well as China, Japan, New Zealand and Australia have ratified the agreement. This has met the minimum criteria for RCEP to enter into force (i.e., six members, including at least three ASEAN members and three non-ASEAN members).
Why RCEP matters to the textile and apparel industry?
RCEP matters significantly for the textile and apparel (T&A) sector. According to statistics from the United Nations, in 2019, the fifteen RCEP members altogether exported US$374 billion worth of T&A (or 50% of the world share) and imported US$139 billion (or 20% of the world share).
In particular, RCEP members serve as critical apparel-sourcing bases for many US and EU fashion brands. For example, in 2019, close to 60% of US apparel imports came from RCEP members, up from 45% in 2005. Likewise, in 2019, 32% of EU apparel imports also came from RCEP members, up from 28.1% in 2005.
Notably, RCEP members have been developing and forming a regional textile and apparel supply chain. More economically advanced RCEP members (such as Japan, South Korea, and China) supply textile raw materials to the less economically developed countries in the region within this regional supply chain. Based on relatively lower wages, the less developed countries typically undertake the most labor-intensive processes of apparel manufacturing and then export finished apparel to major consumption markets worldwide.
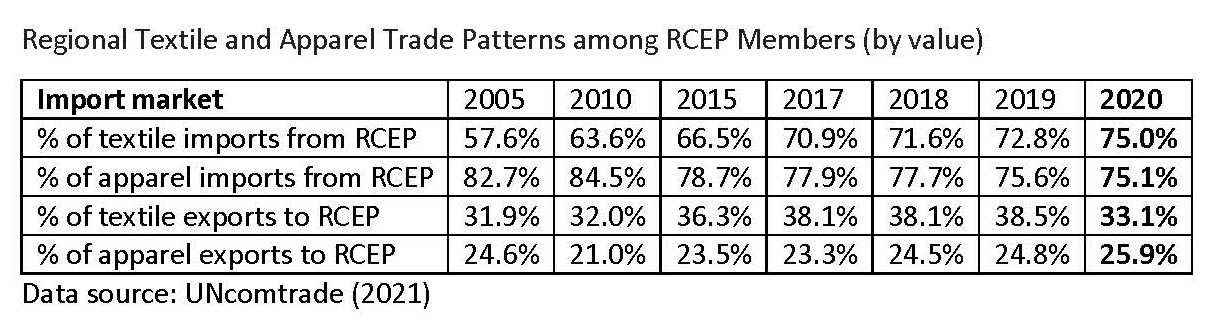
As a reflection of an ever more integrated regional supply chain, in 2019, as much as 72.8% of RCEP members’ textile imports came from other RCEP members, a substantial increase from only 57.6% in 2005. Nearly 40% of RCEP members’ textile exports also went to other RCEP members in 2019, up from 31.9% in 2005.
What are the key provisions in RCEP related to textiles and apparel?
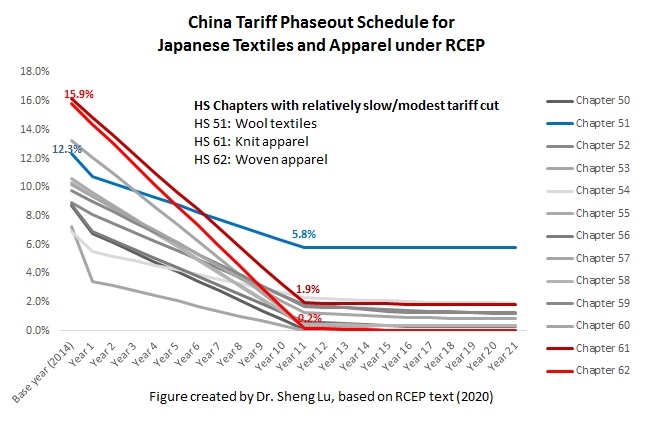
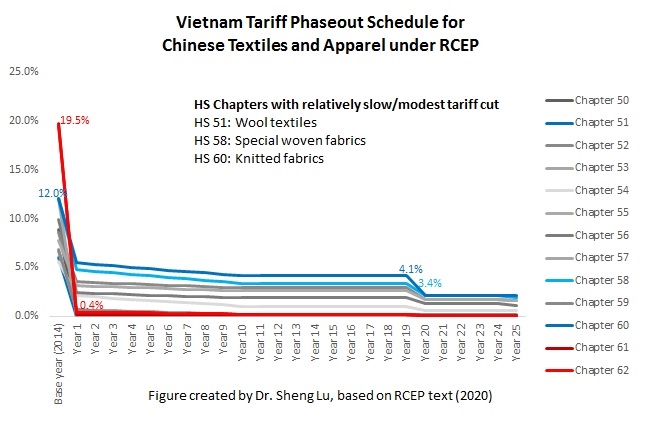
First, RCEP members have committed to reducing the tariff rates to zero for most textile and apparel traded between RCEP members on day one after the agreement enters into force. That being said, the detailed tariff phaseout schedule for textile and apparel products under RCEP is very complicated. Each RCEP member sets their own tariff phaseout schedule, which can last more than 20 years (for example, 34 years for South Korea and 21 years for Japan.) Also, different from U.S. or EU-based free trade agreements, the RCEP phaseout schedule is country-specific. For example, South Korea sets different tariff phaseout schedules for textile and apparel products from ASEAN, China, Australia, Japan, and New Zealand. Japan’s tariff cut for apparel products is more generous toward ASEAN members and less so for China and South Korea (see the graph above). Companies interested in taking advantage of the duty-free benefits under RCEP need to study the “rules of the game” in detail.
Second, in general, RCEP adopts very liberal rules of origin for apparel products. It only requires that all non-originating materials used in the production of the good have undergone a tariff shift at the 2-digit HS code level (say a change from any chapters from chapters 50-60 to chapter 61). In other words, RCEP members are allowed to source yarns and fabrics from anywhere in the world, and the finished garments will still qualify for duty-free benefits. Most garment factories in RCEP member countries can immediately enjoy the RCEP benefits without adjusting their current supply chains.
What are the potential economic impacts of RCEP on the textile and apparel sector?
On the one hand, the implementation of RCEP is likely to further strengthen the regional textile and apparel supply chain among RCEP members. Particularly, RCEP will likely strengthen Japan, South Korea, and China as the primary textile suppliers for the regional T&A supply chain. Meanwhile, RCEP will also enlarge the role of ASEAN as the leading apparel producer in the region.
On the other hand, as a trading bloc, RCEP could make it even harder for non-RCEP members to get involved in the regional textile and apparel supply chain formed by RCEP members. Because an entire regional textile and apparel supply chain already exists among RCEP members, plus the factor of speed to market, few incentives are out there for RCEP members to partner with suppliers from outside the region in textile and apparel production. The tariff elimination under the RCEP will put textile and apparel producers that are not members of the agreement at a more significant disadvantage in the competition. Not surprisingly, according to a recent study, measured by value, only around 21.5% of RCEP members’ textile imports will come from outside the area after the implementation of the agreement, down from the base-year level of 29.9% in 2015.
Further, the reaching of RCEP could accelerate the negotiation of other trade agreements in the Asia-Pacific region, such as the China-South Korea-Japan Free Trade Agreement. We might also see growing pressures on the Biden administration to join the Comprehensive and Progressive Agreement of the Trans-Pacific Partnership (CPTPP) to strengthen the US economic ties with countries in the Asia-Pacific region. The economic competition between the United States and China in the area could also intensify as the combined effects of RCEP and CPTPP begin to shape new supply chains and test the impacts of the two countries on the regional trade patterns.
The virus is here to stay. What steps the companies must take to mitigate its impact?
Sheng: Earlier this year, I, together with the US Fashion Industry Association, surveyed about 30 leading US fashion brands and retailers to understand COVID-19’s impact on their sourcing practices. Respondents emphasized two major strategies they adopted in response to the current market environment. One is to strengthen the relationship with key vendors, and the other is to improve flexibility and agility in sourcing. These two strategies are also highly connected. As one respondent told us “We’re adjusting our sourcing model mix (direct vs. indirect) & establishing stronger strategic supplier relationships across entire matrix continue to build flexibility and dual sourcing options.” Many respondents, especially those large-scale fashion brands and retailers, also say they plan to reduce the number of vendors in the next few years to improve operational efficiency and obtain greater leverage in sourcing.
Which are the countries benefitting out of the US-China tariff war and why?
Sheng:The trade war benefits nobody, period. Today, textiles and apparel are produced through a highly integrated supply chain, meaning the US-China tariff war could increase everyone’s production and sourcing costs. Back in 2018, when the tariff war initially started, the unit price of US apparel imports from Vietnam, Bangladesh, and India all experienced a notable increase. Whereas companies tried to switch their sourcing orders, the production capacity was limited outside China. Meanwhile, China plays an increasingly significant role as a leading textile supplier for many apparel exporting countries in Asia. Despite the trade war, removing China from the textile and apparel supply chain is impossible and unrealistic.
How do you compare the African and Asian markets when it comes to sourcing and manufacturing? Which are the advantages both offer?
Sheng: Asia as a whole remains the world’s dominant textile and apparel sourcing base. According to statistics from the United Nations (i.e., UNComtrade), Asian countries as a whole contributed about 65% of the world’s total textile and apparel exports in 2020. In the same year, Asian countries altogether imported around 31% of the world’s textiles and 19% of apparel. Asian countries have also established a highly efficient and integrated regional supply chain by leveraging regional free trade agreements or arrangements. For example, as much as 85% of Asian countries’ textile imports came from other Asian countries in 2019, a substantial increase from only 70% in the 2000s. With the recent reaching of several mega free trade agreements among countries in the Asia-Pacific region, such as the Regional Comprehensive Economic Partnership (RCEP), the pattern of “Made in Asia for Asia” is likely to strengthen further.
In comparison, only about 1% of the world’s apparel imports come from Africa today. And this percentage has barely changed over the past decades. Many western fashion brands and retailers have expressed interest in expanding more apparel sourcing from Africa. However, the tricky part is that these fashion companies are hesitant to invest directly in Africa, without which it is highly challenging to expand African countries’ production and export capacity. Political instability is another primary concern that discourages more investment and sourcing from Africa. For example, because of the recent political turmoil, Ethiopia, one of Africa’s leading apparel sourcing bases, could be suspended for its eligibility for the African Growth and Opportunity Act (AGOA). Without AGOA’s critical support, Ethiopia’s apparel exports to the US market could see a detrimental decline. On the other hand, while these trade preference programs are crucial in supporting Africa’s apparel exports, they haven’t effectively solved the structural issues hindering the long-term development of the textile and apparel industry in the region. More work needs to be done to help African apparel producers improve their genuine export competitiveness.
Another issue is Brexit. Is that having any significant impact on the sourcing scenario of the world or is it just limited to the European nations?
Sheng: Despite Brexit, the trade and business ties between the UK and the rest of the EU for textile and apparel products continue to strengthen. Thanks to the regional supply chain, EU countries remain a critical source of apparel imports for UK fashion brands and apparel retailers. Nearly 35% of the UK’s apparel imports came from the EU region in 2019, a record high since 2010. Meanwhile, the EU region also is the single largest export market for UK fashion companies—about 79% of the UK’s apparel exports went to the EU region in 2019 before the pandemic.
However, trade statistics in the short run may not fully illustrate the impacts of Brexit. For example, some recent studies suggest that Brexit has increased fashion companies’ logistics costs, delayed customs clearance, and made talent-hiring more inconvenient. Meanwhile, Brexit provides more freedom and flexibility for the UK to reach trade deals based on its national interests. For example, the UK recently submitted its application to join the Comprehensive Progressive Agreement of the Trans-Pacific Partnership (CPTPP). The UK is also negotiating a bilateral trade agreement with the United States. The reaching of these new trade agreements, particularly with non-EU countries, could significantly promote the UK’s luxury apparel exports and help the UK diversity its source of imports.
How do you think the power shortages happening across Europe, China, and other nations, are going to impact the apparel supply chains?
Sheng: One of my primary concerns is that the new power shortage could exacerbate inflation further and result in a more severe price hike throughout the entire textile and apparel supply chain. When Chinese factories are forced to cease production because of power shortage, the impact could be far worse than recent COVID-related lockdowns in Vietnam and Bangladesh. As mentioned earlier, more than half of many leading Asian apparel exporting countries’ textile supplies come from China today. Also, no country can still compete with China in terms of the variety of apparel products to offer. In other words, for many western fashion brands and retailers, their stores and shelves could look more empty (i.e., having less variety of products to sell) because of China’s power shortage problem.
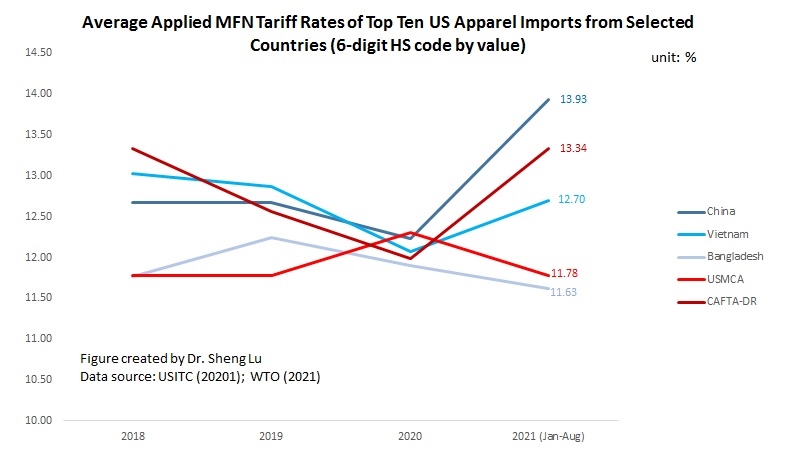
Data shows that 15.2% of US apparel imports came from USMCA and CAFTA-DR members YTD in 2021 (January-August), higher than 13.7% in 2020 and about 14.7% before the pandemic (2018-2019). Notably, CAFTA-DR members’ market shares increased to 11% in 2021 (January to Aug) from 9.6% in 2020. The value of US apparel imports from CAFTA-DR also enjoyed a 54% growth in 2021 (January—Aug) from a year ago, faster than 25% of the world’s average.
#2 Sourcing apparel from USCMA and CAFTA-DR members helps US fashion brands and retailers save around $1.6-1.7 billion tariff duties annually. (note: the estimation considers the value of US apparel imports from USMCA and CAFTA-DR members at the 6-digit HTS code level and the applied MFN tariff rates for these products; we didn’t consider the additional Section 301 tariffs US companies paid for imports from China). Official trade statistics also show that measured by value, about 73% of US apparel imports under free trade agreements came through USMCA (25%) and CAFTA-DR (48%) from 2019 to 2020.
#3 US apparel imports from USMCA and CAFTA-DR members do NOT necessarily focus on items subject to a high tariff rate. Measured at the 6-digit HS code level, apparel items subject to a high tariff rate (i.e., applied MFN tariff rate >17%) only accounted for about 8-9% of US apparel imports from USMCA members and 7-8% imports from CAFTA-DR members. In comparison, even having to pay a significant amount of import duties, around 17% of US apparel imports from Vietnam and 10% of imports from China were subject to a high tariff rate (see table below).
The phenomenon suggests that USCMA and CAFTA-DR members still have limited production capacity for many man-made fibers(MMF) clothing categories (such as jackets, swimwear, dresses, and suits), typically facing a higher tariff rate. This result also implies that expanding production capacity and diversifying the export product structure could make USMCA and CAFTA-DR more attractive sourcing destinations.
#4 US apparel imports from USMCA and CAFTA-DR members tend to focus on large-volume items subject to a medium tariff rate. Specifically, from 2017 to 2021 (Jan-Aug), ten products (at the 6-digit HTS code level) typically contributed around half of the US tariff revenues collected from apparel items (HS chapters 61-62). However, the average applied MFN tariff rates for these items were only about 13%. Meanwhile, these top tariff-revenue-contributing apparel items accounted for about 50% of US apparel imports from USMCA members and nearly 64%-69% of imports from CAFTA-DR members.
Likewise, the top ten products (at the 6-digit HTS code level) typically accounted for 65%-68% of US apparel imports from USMCA members and nearly 73-75% of US apparel imports from CAFTA-DR members. These products also had a medium average applied MFN rate at 11-12% for USMCA and 12-13% in the case of CAFTA-DR.
Given the duty-saving incentives, expanding “near-sourcing” from USMCA and CAFTA-DR members could prioritize these large-volume apparel items with a medium tariff rate in short to medium terms. However, in the long run, a shortcoming of this strategy is that many such items are basic fashion clothing that primarily competes on price (such as T-shirts and trousers) and cannot leverage the unique competitive edge of near-sourcing (such as speed to market). When the US reaches new free trade agreements, particularly those involving leading apparel-producing countries in Asia, it could offset the tariff advantages enjoyed by USMCA and CAFTA-DR members and quickly result in trade diversion.
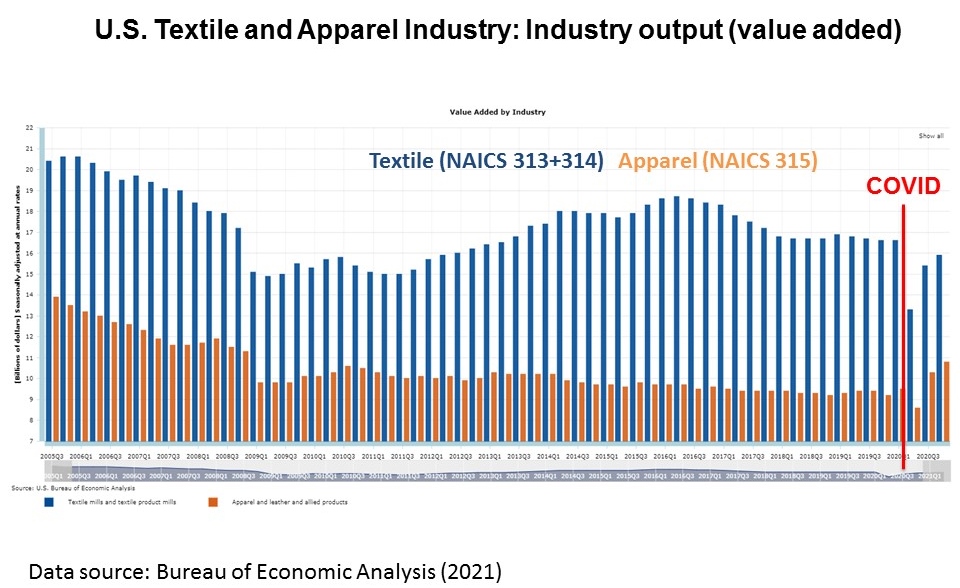
#1: As of June 2021, US textile production had resumed about 98.8% of its production capacity at the pre-COVID level. Based on the readings, why or why not do you think the industry is already “out of the woods”? How to understand the impact of COVID-19 on the international competitiveness of US textile production?
#2: To which extent do you think the state of the US textile and apparel industry and its performance during the pandemic challenge the conclusions of the classic trade and economic development theories we learned in the class (e.g., comparative advantage, factor proportion, the international division of labor, and stage of development theories)? Do you find any trade or production patterns that existing theories cannot fully explain?
#3 Many US fashion companies’ strategies to “consolidate existing sourcing base and strengthen the relationship with key vendors” during the pandemic. What is your evaluation of this strategy—is it a short-term reaction toward COVID-19 or a long-term trend likely to stay? What does this strategy mean for vendors in the apparel supplying countries?
#4: What are the notable changes in fashion companies’ sourcing criteria during the pandemic? How to explain such changes? Who are the winners and losers? Why?
#5: It is of concern that sustainability and social responsibility become a lower priority for the apparel industry during the pandemic, given the unprecedented operational and financial challenges companies face. What is your assessment based on the readings?
#6: What is your vision for the US textile and apparel industry in the post-COVID world? What are the key issues/questions/development trends we shall watch?
(Welcome to our online discussion. For students in FASH455, please address at least two questions and mention the question number (#) in your reply)
By leveraging theGlobalData Apparel Intelligence Center’s “Company Filing Analytics” tool, we took a detailed look at apparel companies’ latest efforts on addressing climate change. Specifically, we conducted a content analysis of annual and quarterly filings (e.g., 10-Q report and corporate annual report) submitted by over a hundred leading apparel companies worldwide from June 2020 to September 2021.
Key findings:
First, addressing climate change has become a more critical topic for apparel companies over the past five years. The percentage of apparel companies that mention “climate change” in their corporate filings nearly doubled from 43% in 2016 to 80% in 2020. Notably, different from the public perception, fast fashion brands like Inditex and H&M were among apparel companies that most frequently mentioned “climate change” in their corporate reports over that period.
Second, many apparel companies see their business risks associated with climate change growing. Results from GlobalData show that apparel companies are particularly concerned about potential supply chain disruption caused by climate change. Apparel companies are also concerned that climate change could increase their sourcing and production costs and hurt financials. As a leading fashion brand noted, “Disasters, climate change…may cause escalating prices or difficulty in procuring the raw materials (such as cotton, cashmere, down, etc.)”. Another added, “In the long term, the broader impacts of climate change may impact the cost and accessibility of materials used to manufacture products or other resources needed to operate business.”
Third, an increasing number of apparel companies have incorporated climate change into their corporate strategies or long-term business visions. Some apparel companies also established a dedicated office or governance structure to address climate change.
Further, apparel companies call for more detailed and transparent regulatory guidelines that can help them combat climate change. As one leading fashion brand commented, “Any assessment of the potential impact of future climate change legislation, regulations or industry standards, as well as any international treaties and accords, is uncertain given the wide scope of potential regulatory change in the countries in which we operate… As a result, the effects of climate change could have a long-term adverse impact on our business and the results of operations.”
In conclusion, addressing climate change is no longer a topic apparel companies can only ignore or treat as a marketing slogan. Instead, we are likely to see companies allocate more dedicated resources to this area in the long run, from human resources to research & development (R&D) spendings. Meanwhile, apparel companies may find it necessary and beneficial to effectively communicate their efforts and needs to address climate change with key stakeholders like consumers and public policymakers.
Victoria Langro is an Honors Marketing & Operations Management Majors and Fashion Management Minor (class of 2022). She is also a 2020 UD Summer Scholar. In summer 2021, Victoria worked with Tapestry, which owns Coach, as a global trade compliance intern.
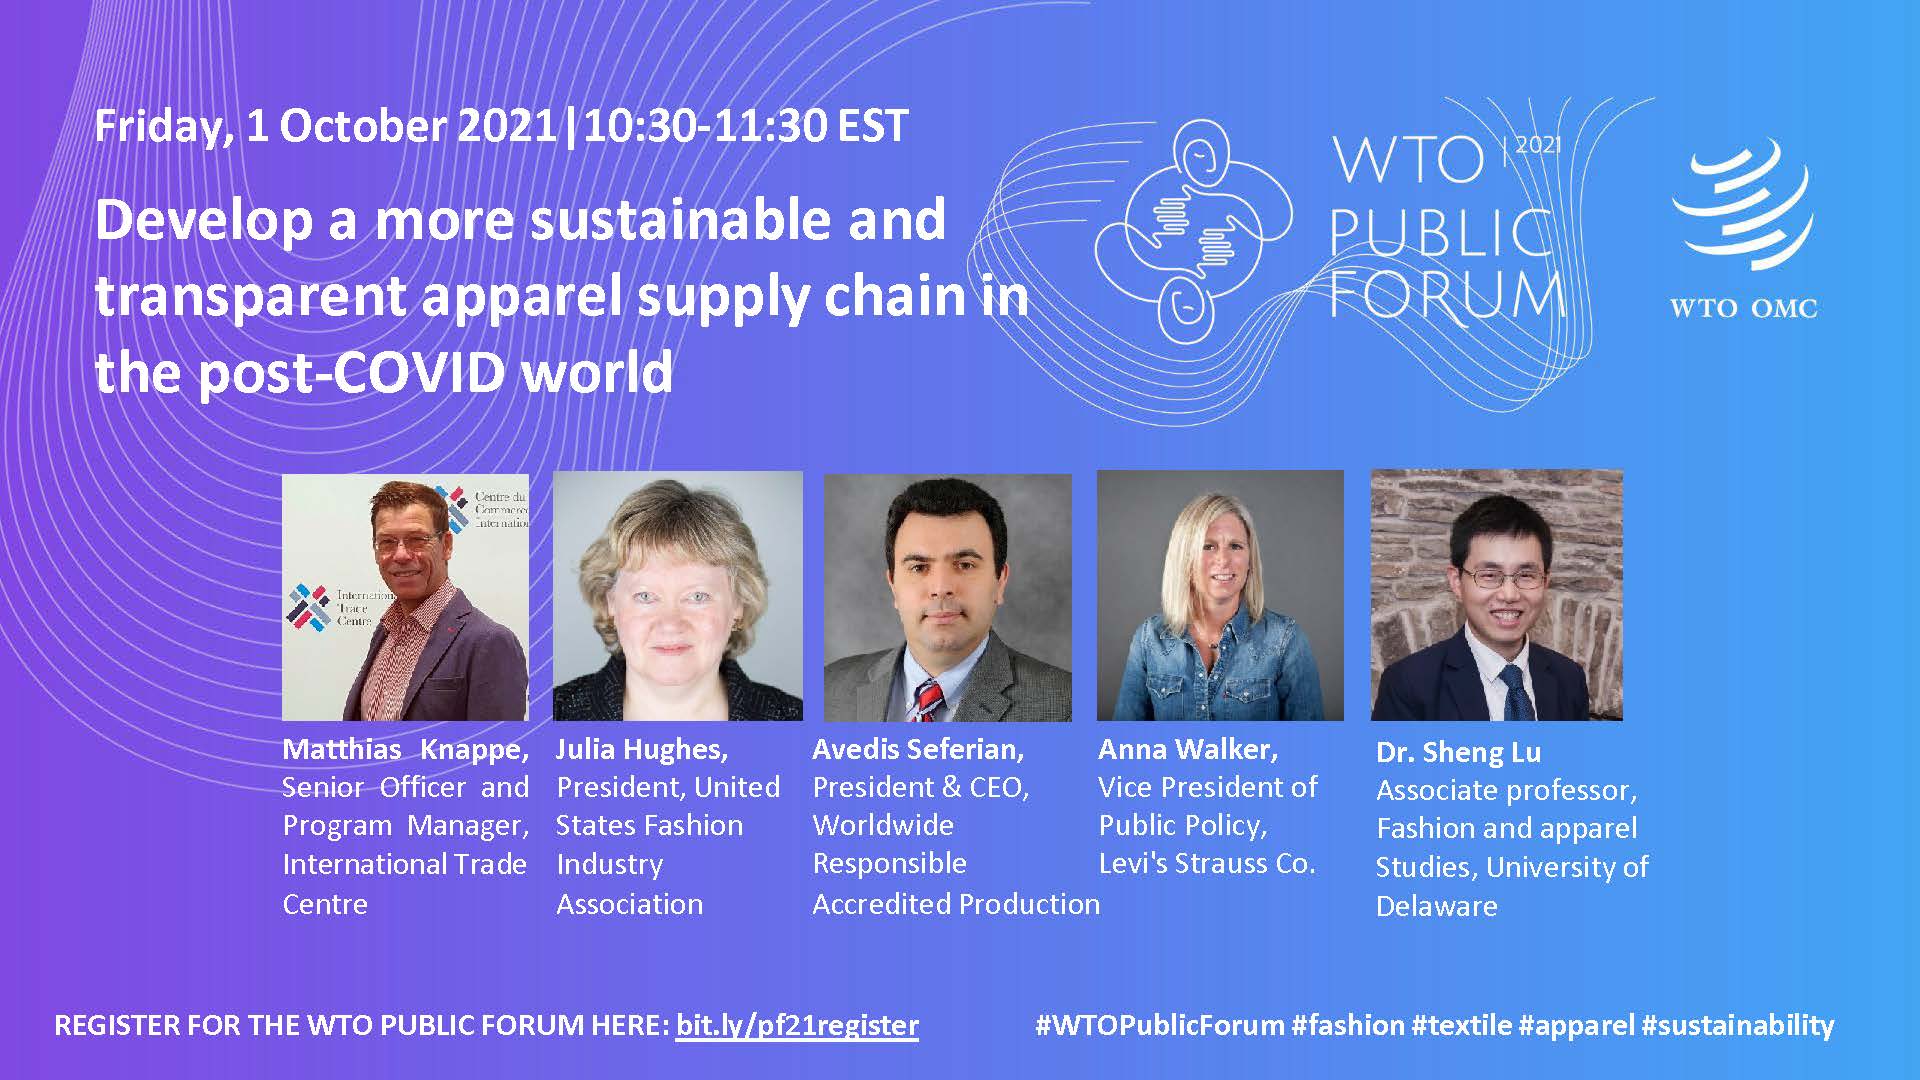
Julia Hughes, President, United States Fashion Industry Association
Matthias Knappe, Senior Officer and Program Manager for Cotton, Fibers and Textiles, International Trade Centre
Avedis Seferian, President & CEO, Worldwide Responsible Accredited Production (WRAP).
Anna Walker, Vice President of Public Policy, Levi’s Strauss Co.
Dr. Sheng Lu, Associate Professor, Department of Fashion & Apparel Studies, University of Delaware
Event summary:
Apparel is a $2.5 trillion global business, involving over 120 million workers worldwide and playing a uniquely critical role in the post-COVID economic recovery. The session intends to facilitate constructive dialogue regarding the progress, challenges, and opportunities of building a more sustainable and transparent apparel supply chain in the Post-COVID world, which matters significantly to ALL stakeholders, from fashion brands, garment workers, policymakers to ordinary consumers.
The panel shared their valuable insights about the impacts of COVID on the world apparel trade patterns and how to make the apparel supply chain more sustainable and transparent in the post-COVID world. Specifically:
First, panelists agree that COVID-19 has resulted in unpresented challenges for apparel sourcing and trade, from supply chain disruptions, cost increases to market uncertainties.
Second, despite the mounting challenges and financial pressures caused by COVID-19, the apparel industry as a whole is NOT ignoring sustainability and social responsibility. Some leading fashion brands and retailers allocate more resources to strengthen their relationships with key vendors during the pandemic. The shifting business environment and the adoption of digital technologies also allow apparel companies to explore new business models and achieve more sustainable and socially responsible apparel production and trade.
Third, the apparel industry is attaching greater importance to supply chain transparency. Today, fashion brands and retailers typically track their tier 1 and tier 2 suppliers. A growing number of companies also start to understand who is making the textile raw materials (i.e., fibers and yarns). To improve supply chain transparency further, panelists suggest more traceability technologies, building trust between importers and suppliers and creating a clearer regulatory framework. Trade policy can also have a crucial role to play in the process.
The new law bans the long-standing piece-rate system — 5 cents to sew a side seam, for instance, or 10 cents to sew a neck — that often adds up to less than $6 an hour (source: LA times). From now on, garment workers in California will get a minimum wage of $14 per hour for employers with 26 or more employees.
The new law’s “brand guarantor” provision would extend the liability for wage theft from the factories themselves to the brands and retailers that sell the clothes, as well as any subcontractors in between. In other words, the bill creates new liabilities across California’s clothing supply chain from factory subcontractors to retailers. (source: San Francisco Examiner)
Concerns about Senate Bill 62
According to the American Apparel and Footwear Association (AAFA), the California Garment Worker Protection Act “does not recognize that brands or buyers may have little to no control over how a particular garment factory employer manages their payroll or enterprise finances.” AAFA explains why this new law in actuality could punish good actors:
“Brand Good contracts with Manufacturer Y to manufacture their clothes, paying a good price, more than enough to pay required wages to Manufacturer Y’s employees. However, in an effort to generate more business, Manufacturer Y also takes a low-bid contract from Brand Bad, so low that both Manufacturer Y and Brand Bad know Manufacturer Y will not be able to pay required wages to its employees. Under this bill, Brand Good would be liable for any wage claims resulting from Manufacturer Y’s acceptance of a low-bid contract completely unrelated to its operations.
The legislation would make responsible brands like Brand Good legally liable to pay for wage claims resulting from Manufacturer Y’s and Brand Bad’s unlawful or irresponsible activity. SB 62 will not deter bad actors like Brand Bad from operating in California’s garment manufacturing industry. Instead, it will penalize responsible companies like Brand Good, even though Brand Good did the right thing. As a result, Brand Good, and other responsible brands, will no longer allow their branded garments to be manufactured in California out of fear that they will acquire additional liabilities over activities they don’t control.”
More than 60% of garment factories in the US are based in California.
Discussion question:Based on the video and the readings, what is your view on the California Garment Worker Protection Act? What changes could it bring to the fashion apparel industry and why?
(Disclaimer: All posts on this site are for FASH455 educational and academic research purposes only, and they are nonpolitical and nonpartisan. No blog post intends to either favor or oppose any particular political party/public policy, nor shall be interpreted that way)
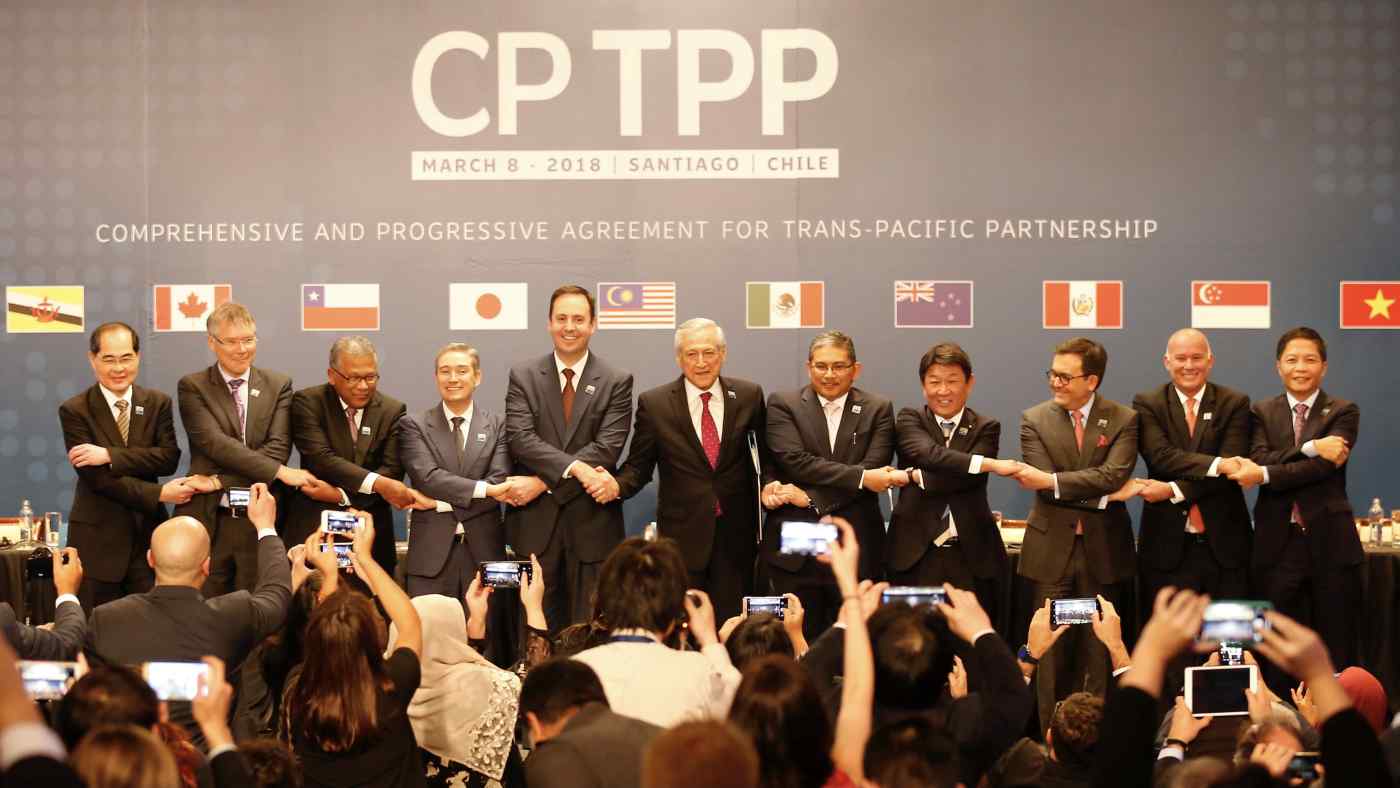
As one breaking news, on 16 September 2021, China officially presented its application to join the 11-member Comprehensive and Progressive Agreement for Trans-Pacific Partnership (CPTPP). While the approval of China’s membership in CPTPP remains a long shot and won’t happen anytime soon, the debate on the potential impact of China’s accession to the trade agreement already starts to heat up.
Like many other sectors, textile and apparel companies are on the alert. Notably, China plus current CPTPP members accounted for nearly half of the world’s textile and apparel exports in 2020. Many non-CPTPP countries are also critical stakeholders of China’s membership in the agreement. In particular, the Western Hemisphere textile and apparel supply chain, which involves the US textile industry, could face unrepresented challenges once China joins CPTPP.
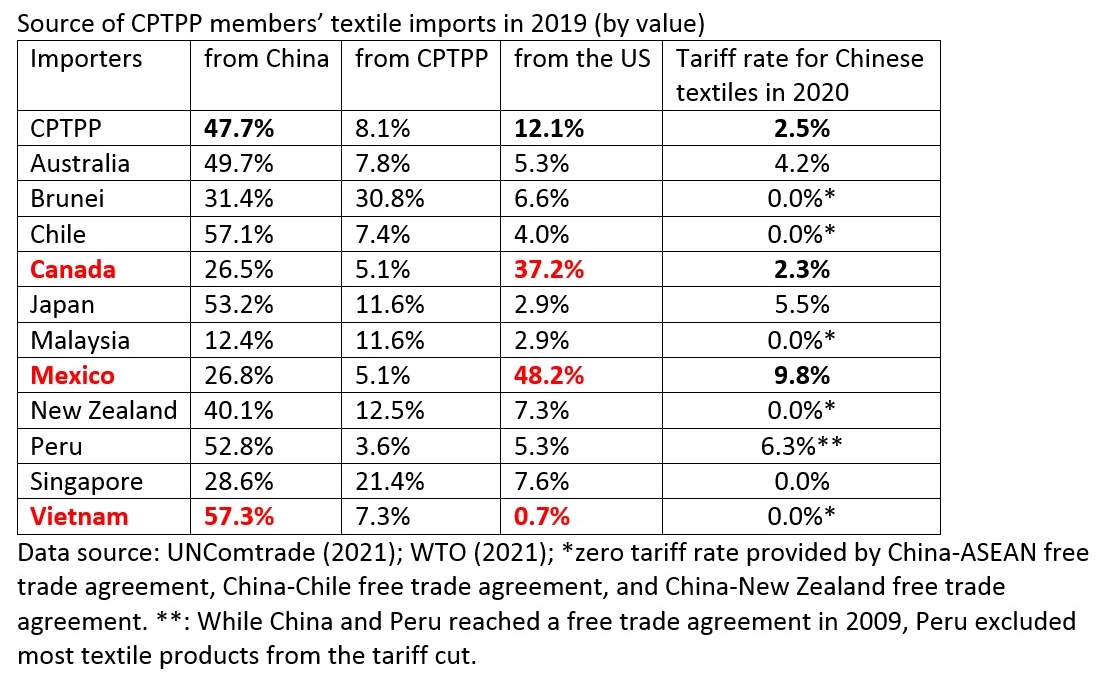
First, once China joins CPTPP, the tariff cut could provide strong financial incentives for Mexico and Canada to use more Chinese textiles. China is already a leading textile supplier for many CPTPP members. In 2019, as much as 47.7% of CPTPP countries’ textile imports (i.e., yarns, fabrics, and accessories) came from China, far more than the United States (12.1%), the other leading textile exporter in the region.
Notably, thanks to the Western Hemisphere supply chain and the US-Mexico-Canada Trade Agreement (USMCA, previously NAFTA), the United States remains the largest textile supplier for Mexico (48.2%) and Canada (37.2%). Mexico and Canada also serve as the largest export market for US textile producers, accounting for as many as 46.4% of total US yarn and fabric exports in 2020.
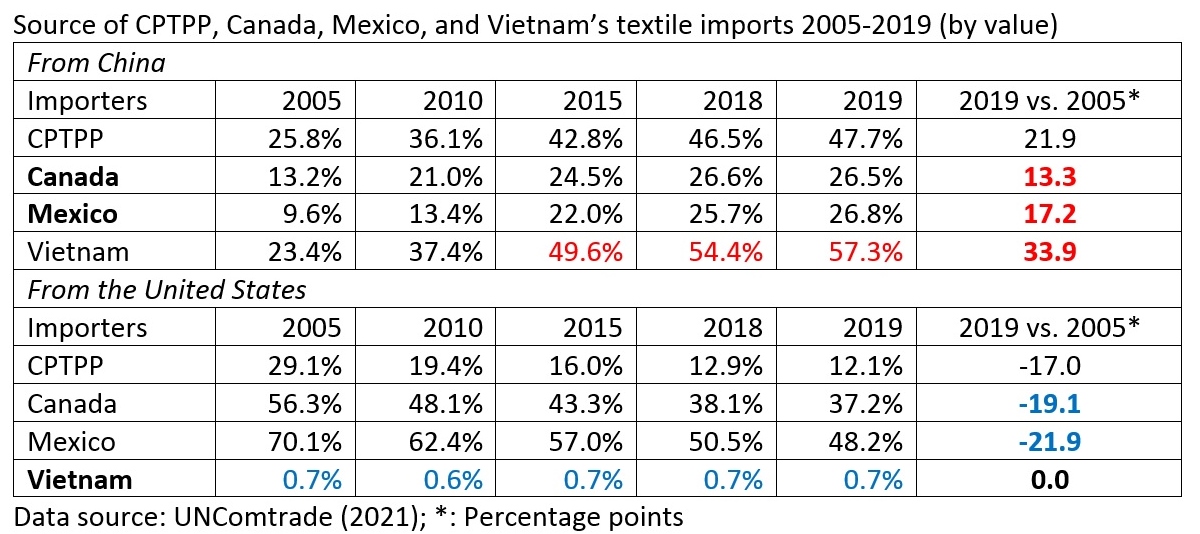
However, US textile exporters face growing competition from China, offering more choices of textile products at a more competitive price (e.g., knitted fabrics and man-made fiber woven fabrics). From 2005 to 2019, US textile suppliers lost nearly 20 percentage points of market shares in Mexico and Canada, equivalent to what China gained in these two markets over the same period.
Further, China’s membership in CPTPP means its textile exports to Mexico and Canada could eventually enjoy duty-free market access. The significant tariff cut (e.g., from 9.8% to zero in Mexico) could make Chinese textiles even more price-competitive and less so for US products. This also means the US textile industry could lose its most critical export market in Mexico and Canada even if the Biden administration stays away from the agreement.
Second, if both China and the US become CPTPP members, the situation would be even worse for the US textile industry. In such a case, even the most restrictive rules of origin would NOT prevent Mexico and Canada from using more textiles from China and then export the finished garments to the US duty-free. Considering its heavy reliance on exporting to Mexico and Canada, this will be a devastating scenario for the US textile industry.
Even worse, the US textile exports to CAFTA-DR members, another critical export market, would drop significantly when China and the US became CPTPP members. Under the so-called Western-Hemisphere textile and apparel supply chain, how much textiles (i.e., yarns and fabrics) US exports to CAFTA-DR countries depends on how much garments CAFTA-DR members can export to the US. In comparison, US apparel imports from Asia mostly use Asian-made textiles. For example, as a developing country, Vietnam relies on imported yarns and fabrics for its apparel production. However, over 97% of Vietnam’s textile imports come from Asian countries, led by China (57.1%), South Korea, Taiwan, and Japan (about 25%), as opposed to less than 1% from the United States.
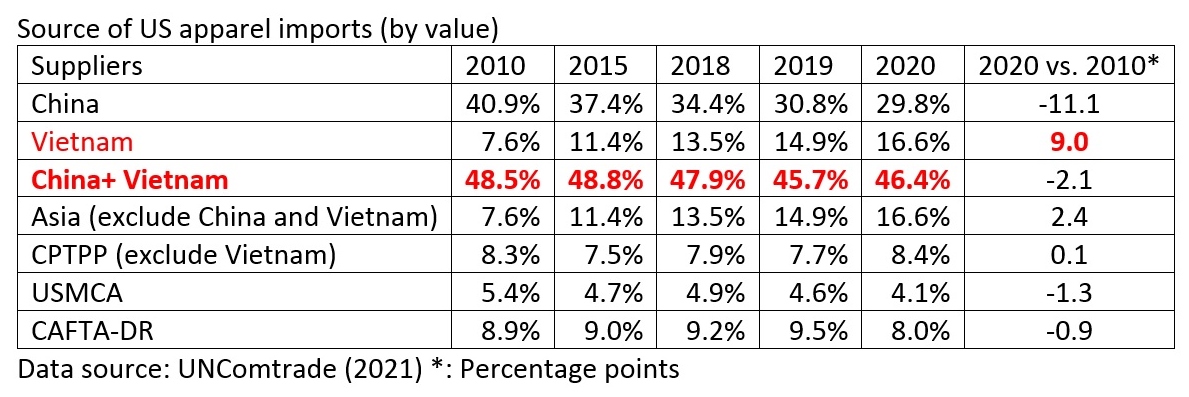
The US textile industry also deeply worries about Vietnam becoming a more competitive apparel exporter with the help of China under CPTPP. Notably, among the CPTPP members, Vietnam is already the second-largest apparel exporter to the United States, next only to China. Despite the high tariff rate, the value of US apparel imports from Vietnam increased by 131% between 2010 and 2020, much higher than 17% of the world average. Vietnam’s US apparel import market shares quickly increased from only 7.6% in 2010 to 16.6% in 2020 (and reached 19.3% in the first half of 2021). The lowered non-tariff and investment barriers provided by CPTPP could encourage more Chinese investments to come to Vietnam and further strengthen Vietnam’s competitiveness in apparel exports.
Understandably, when apparel exports from China and Vietnam became more price-competitive thanks to their CPTPP memberships, more sourcing orders could be moved away from CAFTA-DR countries, resulting in their declined demand for US textiles. Notably, a substantial portion of US apparel imports from CAFTA-DR countries focuses on relatively simple products like T-shirts, polo shirts, and trousers, which primarily compete on price. Losing both the USMCA and CAFTA-DR export markets, which currently account for nearly 70% of total US yarns and fabrics exports, could directly threaten the survival of the US textile industry.
#1: Is the sole benefit of globalization helping us get cheaper products? How to convince US garment workers who lost their jobs because of increased import competition that they benefit from globalization also?
#2 How to explain the phenomenon that US apparel imports from China continue to rise despite the tariff war? Do you think the tariff war is a wrong strategy or a good strategy implemented at the wrong time given COVID?
#2: In the class, we mentioned that major driving forces of globalization include economic growth, lowered trade and investment barriers, and technology advancement. What will be the primary driving forces of globalization or deglobalization in the post-COVID world, and why?
#3: Based on the reading “U.S.-China Trade War Still Hurting Ohio Family-Owned Business,” what results of the US-China tariff war are expected and unexpected? What is your recommendation for the Biden administration regarding the Section 301 tariff exclusion process and why?
#4: We say textile and apparel is a global sector. How does the US-China tariff war affect textile and apparel producers and companies in other parts of the world? Why?
#5: From this week’s readings, why do we say textile and apparel trade and sourcing involve economic, social, and political factors and implications? Please provide 1-2 specific examples from the articles to support your viewpoints.
(Welcome to our online discussion. For students in FASH455, please address at least two questions and mention the question number (#) in your reply)
Micro factories typically refer to small-to-medium scale, highly automated, and technologically advanced manufacturing setups with a wide range of process capabilities.
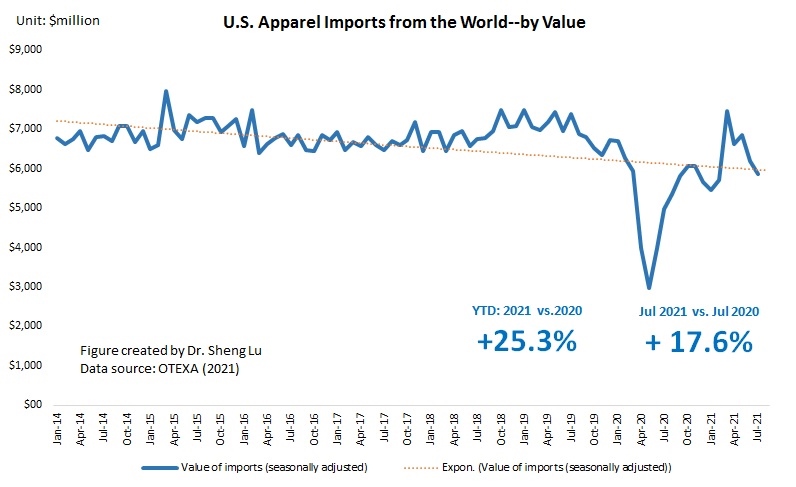
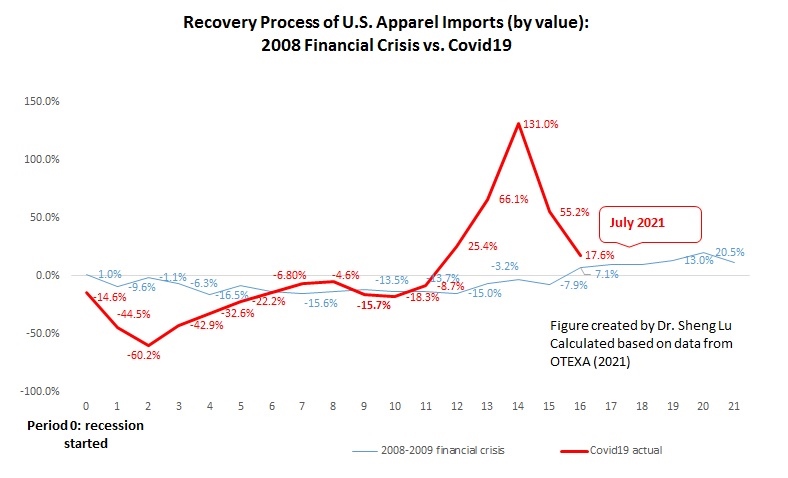
First, the shipping crisis and new wave of COVID cases start to affect US apparel imports negatively. While US consumers’ demand for clothing overall remains strong, for the second month in a row, the value of US apparel imports (seasonally adjusted) in July 2021 decreased by 5.5% from a month ago and down 9.7% from May to June. The absolute value of US apparel imports year to date (YTD) in 2021 (January—July) was 25.3% higher than in 2020 and around 87% of the pre-COVID level (benchmark: January-July, 2019). However, the year-over-year growth in July 2021 was only 15.4%, compared with 60.0% in May 2021 and 29.1% in June 2021. Overall, the results remind us that the market environment is far from stable yet as the COVID situation in the US and other parts of the world continues to evolve.
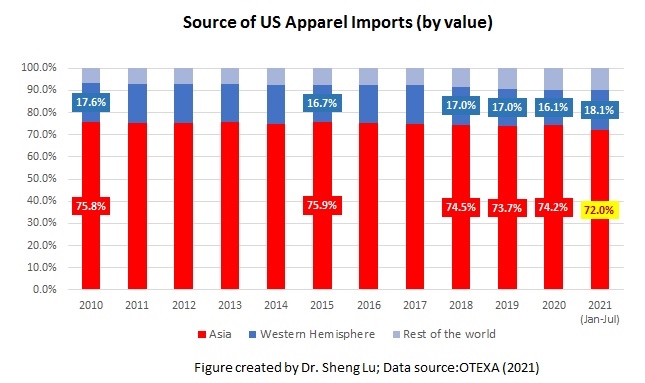
Second, Asian countries lost market shares as some leading apparel supplying countries, including Vietnam and Bangladesh, struggled with new COVID lockdowns. While Asia as a whole remains the single largest apparel sourcing base for US companies, Asian countries’ market shares fell from 74.2% in 2020 to 71.3% in July 2021, the lowest since 2010. The new COVID lockdowns in Vietnam and Bangladesh, the No. 2 and No. 3 top suppliers for the US market, post significant challenges to US fashion companies trying to build inventory for the upcoming holiday season. Notably, US companies source many high-volume products from these two countries, and there is a lack of alternative sourcing destinations in the short run.
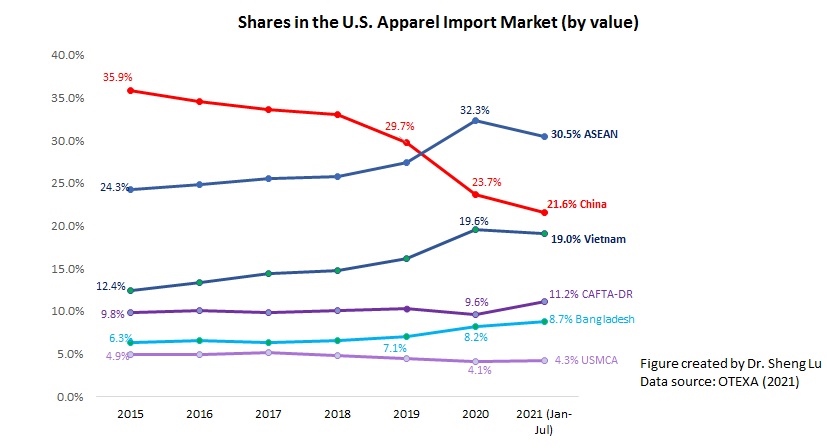
Third, US companies continue to treat China as an essential sourcing base during the current challenging time. However, there is no clear sign that companies are reversing their long-term strategy of reducing “China exposure.” China stays the largest supplier for the US market in July 2021, accounting for 41.3% of total US apparel imports in quantity and 26.0% in value. The export product diversification index also suggests that China supplied the most variety of products to the US market. US apparel imports from Bangladesh, Mexico, and CAFTA-DR members are more concentrated on specific product categories. In other words, should China were under lockdowns, the negative impacts on US companies’ inventory management could be even worse.
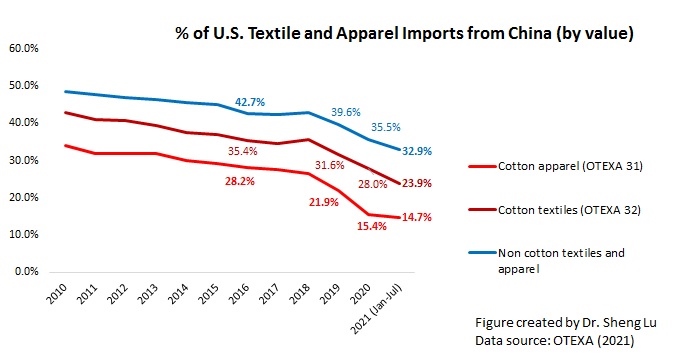
Nevertheless, the HHI index and market concentration ratios (CR3 and CR5) calculated based on the latest data suggest that US fashion companies continue to move their apparel sourcing orders from China to other Asian countries overall. For example, only 14.7% of US cotton apparel imports came from China in 2021 (January—July), a new record low in the past ten years. Further, as US apparel imports from China typically peak from June to September because of seasonal factors, China’s market shares are likely to drop in the next few months. Additionally, the fundamental concerns about sourcing from China are NOT gone. On the contrary, new US actions against alleged forced labor in Xinjiang are likely in the coming months and affect imports from China beyond cotton products.
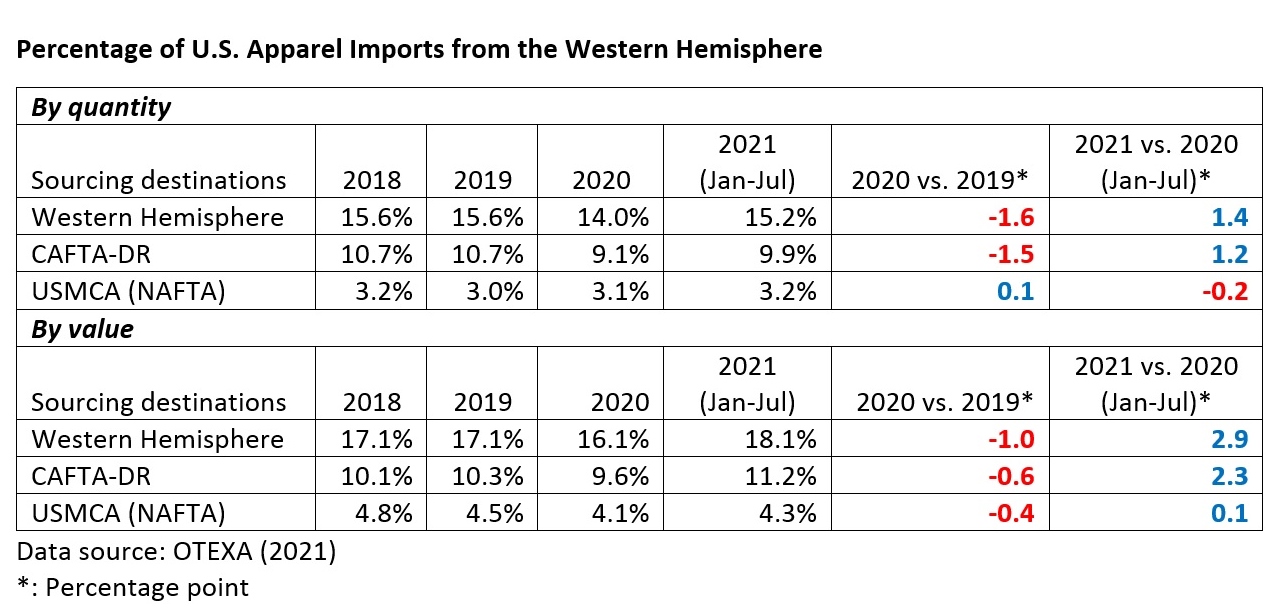
Fourth, US apparel sourcing from the Western Hemisphere, especially CAFTA-DR members, gains new momentum. Specifically, 18.1% of US apparel imports came from the Western Hemisphere YTD in 2021 (January-July), higher than 16.1% in 2020 and 17.1% before the pandemic. Notably, CAFTA-DR members’ market shares increased to 11.2% in 2021 (January to July) from 9.6% in 2020. The value of US apparel imports from CAFTA-DR also enjoyed a 58.4% growth in 2021 (January—July) from a year ago, one of the highest among all sourcing destinations. The imports from El Salvador (up 75.2%), Honduras (up 74.6%), Dominican Republic (45.1%), and Guatemala (40.6%) had grown particularly fast so far in 2021.
Meanwhile, US apparel imports from USMCA members stayed stable (i.e., no significant change in market shares). CAFTA-DR and USMCA members currently account for around 60% and 25% of US apparel imports from the Western Hemisphere. They are also the single largest export market for US textile products (about 70%).
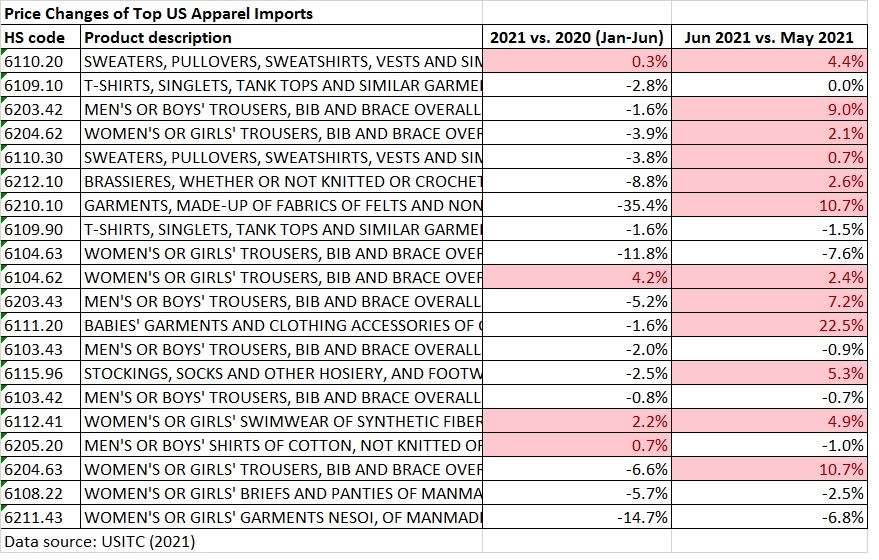
Fifth, US apparel imports start to see a notable price increase. While an across-the-board price increase was not a big concern at the beginning of 2021, the increase has become more noticeable since June 2021. For example, of the top 20 US apparel imports (HS chapters 61-62) at the 6-digit HS code level based on import value, the price of thirteen products increased from May to June 2021. The price increase at the country level is even more significant. From May to July 2021, the average unit price of US apparel imports from leading sources all went up substantially, including China (7%), Vietnam (13%), Bangladesh (13.9%), and India (15.6%).
As almost everything is becoming more expensive, from raw material, shipping to labor, the August and September trade data (to be released in October and November) could suggest an even more significant price increase.
According to the latest statistics released by the American Apparel and Footwear Association (AAFA):
In 2020, the US apparel and footwear industry directly employed about 3 million Americans and employed another 2.3 million indirectly.
In 2020, on average, every man, woman, and child in the United States spent $1,067.93 to buy 51.8 pieces of clothes and 5.8 pairs of shoes.
In 2020, US apparel and footwear production accounted for 3.5 percent and 2.3 percent of the US market, respectively.
Due to COVID-19, in 2020, US imports of apparel and footwear sank 16.4 percent and 23.5 percent, respectively. However, imports still supplied 96.5 percent of apparel and 97.7 percent of footwear available in the US market.
In 2020, the average effective tariff rate hit records for both apparel and footwear, reaching 15.5 percent and 13.0 percent, respectively.
First, footwear sourcing is much less diversified than apparel. As manufacturing footwear both requires specialized machines and can be labor-intensive, over 80% of US footwear imports came from three countries only, namely China, Vietnam, and Indonesia. This sourcing pattern is very different from apparel products, for which US companies have far more choices. Other than the top three, US also imports some high-end footwear products from Italy.
Second, while China remains No.1, Vietnam has quickly become the second-largest footwear supplier for the US market. Vietnam’s market shares (by value) reached a new record high of 32.9% in the first six months of 2021, up from 20% in 2017. Especially since the US Section 301 action began to affect footwear imports from China, US retailers have increasingly moved sourcing orders from China to Vietnam to mitigate trade war’s negative impacts [Note: most footwear products are covered by Tranche 4A].
As of June 2021, top US retailers that carry footwear “Made in Vietnam” include Puma, Nike, UGG, Vans, and New Balance.
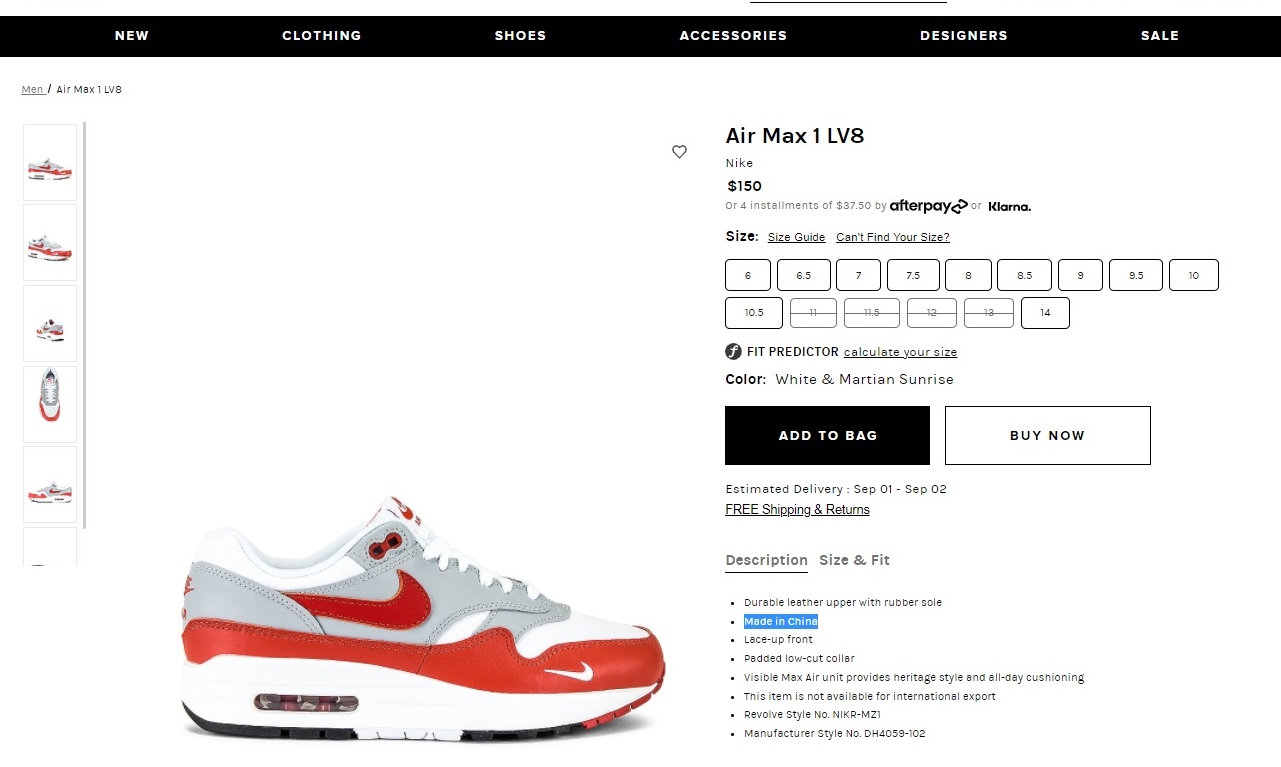
Nike, “Made in Vietnam”, retail price =$100
Nike, “Made in China”, retail price =$150
Third, US retailers source from Vietnam primarily for volume items targeting the mass market. Industry sources show that from Aug 2020 to Aug 2021, sneakers/trainer shoes “Made in Vietnam” on average were priced 30%+ cheaper than those “Made in China” in the US retail market.
Meanwhile, Vietnam still lags far behind China in terms of the variety of products it makes. For example, industry sources show that from Aug 2020 to Aug 2021, US retailers imported around 110K different types of footwear (at the SKU level) from China, but only 13K from Vietnam.
Overall, Vietnam’s COVID lockdown will primarily affect medium to lower-priced volume products carried by US footwear retailers. However, the lockdown’s impacts on retailers’ sourcing portfolio and product availability in the market could be modest. In other words, US consumers may still find many footwear products to choose from in the store but with a higher price tag.Notably, from June 2020 to July 2021, the US retail price for footwear went up by over 7.4% already.
Discussion question: How has the container shipping crisis affected the fashion apparel industry? While shopping for clothing, do you observe any market trends related to the shipping crisis (e.g., retail price and product availability)? Why or why not do you think the container shipping crisis will go away anytime soon?
The cosmetics and beauty (C&B) is a $50 billion market in the United States. Like many other retail businesses, U.S. C&B companies face significant challenges during the pandemic. This study aims to explore how U.S.-based C&B companies have adjusted their merchandising and marketing strategies to survive the pandemic. By leveraging StyleSage, a big data tool for the fashion industry, we checked millions of C&B items (at the Stock Keeping Unit, SKU level) sold in the U.S. retail market during the pandemic (from March 1, 2020, to May 31, 2021). The results show that:
First, despite the tremendous challenges facing C&B companies during the pandemic, the U.S. C&B retail market is not at all depressing. Cosmetic and beauty retailers prioritized three categories during COVID: fragrance (up 226.3%), haircare (up 150.9%), and skincare (up 165.6%), all see a significant increase in the number of products newly launched to the market than before the pandemic.
Second, U.S. C&B retailers adjusted their product assortment during the pandemic. While most C&B products still target women, the number of unisex products newly launched to the market during COVID-19 saw impressive high growth in some product categories, such as skincare. There is also a notable increase in products catered explicitly towards male consumers during the pandemic.
Third, during COVID-19, the average selling price goes up for most C&B product categories sold in the U.S. retail market. Except for bath & body and haircare, C&B retailers are selling more popular items in higher price-zones. C&B retailers also created new price zones with unique product combinations to fulfill consumers’ shifting demands during the pandemic.
Further U.S. C&B retailers adjusted their discount strategies during the pandemic. Notably, markup products were more commonly sold at a discounted price during the pandemic, although the depth of their markdowns was lower.
The study’s findings provide new insights into the C&B-specific sectoral impact of the pandemic, especially firm-level business mitigation strategies. The findings also call for more attention to the shifting product offers in the C&B market and the emerging product niches, such as unisex C&B items, that may continue to enjoy fast growth in the post-COVID world.
By Valerie Light (2021 UD Summer Scholar, Honors Public Relations Communication major and Fashion management minor); Faculty advisor: Dr. Sheng Lu
The textile and apparel industry plays a significant role in Myanmar’s economy, particularly the export sector. Data from UNComtrade shows that textile and apparel accounted for nearly 69% of Myanmar’s total exports of manufactured goods in 2020, a substantial increase from only 27% in 2011. Data from the International Labor Organization (ILO) also indicates that the textile and industry (ISIC 17 & 18) employed more than 1.1 million workers in Myanmar in 2019, up from 0.69 million in 2015. Most garment workers in Myanmar are women today (around 87%).
Since the United States lifted the import ban on Myanmar and the EU reinstated the Everything But Arms (EBA) trade preferences in 2013, Myanmar was one of the most popular emerging apparel sourcing bases among fashion companies. From 2020 to July 2021, some of the top fashion brands that carry “Made in Myanmar” apparel items include United Colors of Benetton, Next, Only, H&M, Guess, and Jack & Jones.
Thanks to foreign investment (note: nearly half of Myanmar’s garment factories are foreign-owned), Myanmar specializes in making relatively higher-quality functional/technical clothing (i.e., outwear like jackets and coats. Here is an example). This is different from many other apparel-exporting countries like Bangladesh, Vietnam, and Cambodia, mostly exporting low-cost tops and bottoms.
However, the latest trade data shows that Myanmar’s military coup that broke out in early 2021 had hurt the country’s apparel exports significantly. According to the US International Trade Commission (USITC), even though the total US apparel imports enjoyed a robust recovery in the first half of 2021 (up nearly 27%), the value of US apparel (HTS chapters 61 and 62) imports from Myanmar dropped by 0.4%. Almost ALL Myanmar’s top apparel exports to the US suffered a substantial decline or much slower growth in 2021 than the trend BEFORE the military coup (see the Table above). As US fashion companies switch sourcing orders from Myanmar to other suppliers, Myanmar’s market shares fell from 0.5% in 2020 to only 0.3% in the first half of 2021.
Highly consistent with the trade data, according to the 2021 Fashion Industry Benchmarking Study, many surveyed US fashion companies expressed concerns about the military coup in Myanmar and the rising labor and social compliance risks when sourcing from the country. Some respondents explicitly say they are leaving because of the current situation. “(We) have terminated sourcing from Myanmar due to instability.” says one respondent. Another adds, “We had orders in Myanmar that have already been moved to Cambodia. We are unlikely to place orders until the current situation is resolved.”
In another recent study, we find that apparel sourcing is not merely about “competing on price.” Instead, fashion companies give substantial weight to the factors of “political stability” and “financial stability” in their sourcing decisions today. In other words, the reputation risks matter for sourcing.
Unfortunately, the situation could get worse. The international community, including the US and the EU, is considering new sanctions against Myanmar, including suspending Myanmmar’s trade-preference program eligibility.
Designated as a “least developed country” (LDC) by the World Trade Organization, Myanmar’s apparel exports enjoy duty-free market access in the EU, Japan, and South Korea. These countries also, in general, offer very liberal “single transformation” (or commonly known as cut and sew) rules of origin for qualifying apparel made in Myanmar. This explains why Myanmar’s apparel exports mostly go to the EU (56%), Japan, and South Korea (around 30%).
The United States is another important export market for Myanmar, accounting for 7% of the country’s total apparel exports in 2020. As a beneficiary of the US Generalized System of Preferences (GSP) program, Myanmar’s luggage exports enjoy duty-free benefits in the US market. However, the US GSP program excludes textile and apparel products, meaning Myanmar’s apparel exports to the US still are subject to the regular Most-Favored-Nation (MFN) tariff rate at around 14.3% on average in 2020.
Further, given Myanmar’s highly concentrated apparel export markets and the pandemic, it will be challenging for Myanmar’s garment producers to find alternative apparel export markets in a relatively short period. For example, although China is recognized as one of the world’s largest and fastest-growing emerging import markets, only 1.4% of Myanmar’s apparel exports went to China in 2020.
According to the World Trade Statistical Review 2021 report released by the World Trade Organization (WTO), the textiles and apparel trade patterns in 2020 include both continuities and new trends affected by the pandemic and companies’ evolving production and sourcing strategies in response to the shifting business environment.
Pattern #1: COVID-19 significantly affected the world textile and apparel trade volumes, resulting in substantial growth of textile exports and a declined demand for apparel.
Driven by increased personal protective equipment (PPE) production, global textile exports grew by 16.1% in 2020, reaching $353bn. In comparison, affected by lockdown measures, worsened economy, and consumers’ tighter budget for discretionary spending, global apparel export decreased by nearly 9% in 2020, totaling $448bn, the worst performance in decades. The apparel sector is not alone. The world merchandise trade in 2020 also suffered an unprecedented 8% drop from a year ago, with COVID-19 to blame.
Notably, as economic activities returned in the second half of 2020, the world clothing export quickly rebounded to around 95% of the pre-covid level by the end of 2020. That being said, the unexpected resurgence of COVID cases in summer 2021, especially the delta variant, caused new market uncertainties. Overall, the world textile and apparel trade recovery process from COVID-19 will differ from our experiences during the 2008 global financial crisis.
Pattern #2: COVID-19 did NOT shift the competitive landscape of the world textile exports; Meanwhile, textile exports from China and Vietnam gained new momentum during the pandemic.
China, the European Union (EU), and India remained the world’s three largest textile exporters in 2020. Together, these top three accounted for 65.8% of the world’s textile exports in 2020, similar to 66.9% before the pandemic (2018-2019).
Notably, China and Vietnam enjoyed a substantial increase in their textile exports in 2020, up 28.9% and 10.7% from a year ago, respectively. The complete textile and apparel supply chain and considerable production capability allow these two countries to switch clothing production to PPE manufacturing quickly. In particular, Vietnamexceeded South Korea and ranked the world’s sixth-largest textile exporter in 2020 ($10 bn of exports), the first time in history.
The United States dropped one place and ranked the world’s fifth-largest textile exporter in 2020 (was 4th from 2015 to 2019), accounting for 3.2% of the shares (was 4.4% in 2019). Production disruptions at the beginning of the pandemic and the shift toward PPE production for domestic consumption were the two primary contributing factors behind the decline in U.S. textile exports. Due to the regional trade patterns, around 67% of U.S. textile exports went to the Western Hemisphere in 2020, including 46% for members of the U.S.-Mexico-Canada Trade Agreement (USMCA) and another 17.2% for members of the Dominican Republic-Central America Free Trade Agreement (CAFTA-DR).
Pattern #3: Fashion companies’ efforts to diversify apparel sourcing from China somehow slowed during the pandemic.
China, the European Union, Vietnam, and Bangladesh unshakably remained the world’s four largest apparel exporters in 2020. Altogether, these top four accounted for 72.2% of the world market shares in 2020, higher than 71.4% in 2019.
Notably, while China steadily accounted for declining shares in the world’s total apparel exports since 2015, its market shares rebounded to 31.6% in 2020 from 30.7% in 2019. We can observe a similar pattern in Canada (up from 36.2% to 41.2%) and the EU (31.2% to 31.3%), two of the world’s leading apparel import markets. Even in the U.S. market, where Chinese goods face adverse impacts of the tariff war, the market shares of “Made in China” only marginally decreased from 30.8% in 2019 to 29.8% in 2020, compared with a more significant drop before the pandemic (i.e., fell from 34.4% 2018 to 30.8% in 2019).
Several factors could explain the resilience of China’s apparel exports: 1) fashion brands and retailers’ particular sourcing criteria match China’s competitiveness during the pandemic (e.g., flexibility, agility, and total landed sourcing cost). 2) China has one of the world’s most complete textile and apparel supply chains, allowing garment factories to access textile raw material and accessories locally. 3) Compared with many other apparel exporting countries, China suffered a shorter COVID lockdown period and resumed apparel production earlier and more quickly. Most Chinese textile and apparel factories started to reopen in April 2020, and they resumed an overall 90%-95% operational capacity rate by July 2020.
Nonetheless, fashion companies are NOT reversing their long-term strategies to reduce “China exposure” for apparel sourcing. On the contrary, non-economic factors, particularly the concerns about forced labor in China’s Xinjiang region, push most western fashion brands and retailers to develop apparel sourcing capacities beyond China. Meanwhile, no single country has yet and will likely become the “Next China” because of capacity limits. Instead, from 2015 to 2020, China’s lost market shares in the world apparel exports (around 7.8 percentage points) were picked up jointly by its competitors in Asia, including ASEAN members (up 4.4 percentage points), Bangladesh (up 1.3 percentage points), and Pakistan (up 0.3 percentage point). Such a trend is most likely to continue in the post-COVID world.
Pattern #4: Developed economies led textile PPE imports during the pandemic, whereas the developing countries imported fewer textiles as their apparel exports dropped.
On the one hand, the value of textile imports by developed economies, including EU members, the United States, Japan, and Canada, surged by more than 30 percent in 2020, driven mainly by their demand for PPE. The result also reveals the significant contribution of international trade in supporting the supply and distribution of textile PPE globally. On the other hand, the developing countries engaged in apparel production and export drove the import demand for textile raw materials like yarns and fabrics. However, most of these developing countries’ textile imports fell in 2020, corresponding to their decreased apparel exports during the pandemic.
Pattern #5: Despite COVID-19, the world apparel import market continues to diversify. The import demand increasingly comes from emerging economies with a booming middle class.
Affected by consumers’ purchasing power (often measured by GDP per capita) and the size of the population, the European Union, the United States, and Japan remained the world’s three largest apparel importers in 2020, a stable pattern that has lasted for decades. While these top three still absorbed 56.2% of the world’s apparel imports in 2020, it was a new record low in the past ten years (was 58.1% in 2019 and 61.5% in 2018), and much lower than 84% back in 2005.
Behind the numbers, it is not the case that consumers in the EU, the United States, and Japan necessarily purchase less clothing over the years. Instead, several emerging economies have become fast-growing apparel-consuming markets with robust import demand. For example, despite COVID-19, China’s apparel imports totaled $9.5bn in 2020, up 6.5% from 2019. From 2010 to 2020, China’s apparel imports enjoyed a nearly 15% annual growth, compared with only 0.56% of the traditional top three. Around 30% of China’s apparel imports today are luxury items made in the EU.
With consumers’ increasing awareness of sustainability and building a circular economy, more and more fashion retailers carry clothing made from recycled materials. This study aims to explore U.S. fashion retailers’ detailed merchandising and pricing strategies for clothing made from recycled material to provide more business insights into this fast-growing market.
By leveragingStyleSage, a big data tool for the fashion industry, we checked millions of clothing items (at the Stock Keeping Unit, SKU level) made from recycled materials available in the U.S. retail market from June 2018 to June 2021. The results show that:
First, top U.S. sellers of clothing made with recycled materials include BOTH sustainability-based brands and fast-fashion brands.
Second, the most utilized recycled textile fibers include Polyester, Nylon, and Cotton.
Third, U.S. retailers adopt unique product assortment strategies for clothing made from recycled material. Recycled clothing, in general, carry more “Shorts” and “outerwear, coats, and jackets,” and fewer “Sleepwear” and “dresses.”
Fourth, U.S. retailers adopt unique color strategies for clothing made from recycled materials, using “black” more often but using “Neutral color” much less.
Fifth, U.S. retailers typically price clothing using recycled materials at least 50% lower than regular new clothing. The price difference for “Bridal”, “Suits”, “Causal jackets and blazers” and “Outerwear, coats, and jackets” was particularly notable.
The study’s findings confirm that clothing made from recycled materials is a critical market to watch with growing business opportunities. The findings also suggest that U.S. fashion retailers adopt unique merchandising and pricing strategies for recycled clothing, affected by the product supply and consumers’ preferences. Additionally, the study’s findings call for more exploration of leveraging recycled clothing to achieve sustainability and lower sourcing costs.
By Ally Botwinick (2021 UD Summer Scholar, Fashion merchandising and Management Major); Faculty advisor: Dr. Sheng Lu
Recently, VF Corporation, one of the most historical and largest US apparel corporations, released the entire supply chain of its 20 popular apparel items, such as Authentic Chino Stretch, Men’s Merino Long Sleeve Crewe, and Women’s Down Sierra Parka. VF Corporation used 326 factories worldwide to make these apparel items and related textile raw materials. We conducted a statistical analysis of these factories, focusing on exploring their geographic locations, production features, and related factors. The results help us gain new insights into VF Corporation’s supply chain strategy and offer a unique firm-level perspective to understand China’s outlook as a textile and apparel sourcing base for US fashion companies. Specifically:
First, China remains the single largest sourcing base across VF Corporation’s entire textile and apparel supply chain. Specifically, as many as 113 (or 35%) of the total 326 factories used by VF Corporation are China-based, far exceeding any other country or region. Besides China, VF Corporation sourced products from the US (42), Taiwan (31), South Korea (16), Mexico (13), Honduras (12), Vietnam (11), Indonesia (8), as well as a few EU countries, such as Germany, Czech Republic, and France.
Notably, thanks to its unparalleled production capacity, China also offered the most variety of textiles and apparel among all suppliers. Chinese factories supplied products ranging from chemicals, yarns, fibers, trims, threads, labels, packing materials to finished garments. In comparison, most other countries or regions serve a narrower role in VF Corporation’s supply chain. For example, 65% of US-based factories supplied yarns, threads, trims, and fabrics; 80% of Taiwan-based factories supplied trims, fabrics, and zippers; and VF Corporation used most factories from Vietnam, Mexico, Honduras, and Indonesia to cut and sew garments only.
Second, VF Corporation is more likely to source from China when a higher percentage of the production processes across the apparel supply chain happens in Asia. For example, VF did not use any Chinese textile and apparel factory for its Williamson Dickies’s Original 874® Work Pant. Instead, Williamson Dickies’s supply chain was primarily based in the Western Hemisphere, involving the US (yarns, trims, and fabric suppliers), Mexico (fabric suppliers and garment manufacturers), Honduras (garment manufacturers), and Nicaragua (garment manufacturers).
In comparison, VF used China-made textiles for Napapijri’s Parka Coat Celsius. Nearly 83% of this product’s production processes also happened in the Asia region, such as Taiwan (fabrics, zippers, plastic suppliers), Hong Kong (trim suppliers), and Vietnam (garment manufacturers). This pattern reflects China’s deep involvement and central role in the Asia-based regional textile and apparel production network. We may also expect such an Asia-based regional supply chain to become more economically integrated and efficient after implementing the Regional Comprehensive and Economic Partnership (RCEP) and other regional trade facilitation initiatives in the next few years.
Third, reflecting the evolving nature of China’s textile and apparel industry, the result shows that VF Corporation is more likely to use China as a supplier of textile intermediaries than the finished garment. Due to various reasons, from the US Section 301 tariffs to the wage increases, China already plays a less significant role as a garment supplier for VF Corporation, accounting for just around 10% of the company’s tier 1 suppliers. This result is highly consistent with the official trade statistics—measured by value, only 23.7% of US apparel imports came from China in 2020, a new record low over the past decade.
Fourth, interesting enough, the results indicate that when an apparel item involves more production stages or needs a greater variety of inputs, it will reduce VF Corporation’s likelihood of sourcing from China. For example, the supply chain of Icebreaker’s Men’s Merino 200 Oasis Long Sleeve Crewe included five different processes (e.g., wool fiber, wool yarn, and finished garments). VF Corporation used around 21 various factories and facilities across the supply chain, of which 57.1% were China-based. In comparison, North Face’s Women’s Denali 2 Jacket included around 21 different processes (e.g., polyester yarn, nylon yarn, tape, zipper, trim, polyester interlining, thread, eyelet, label, and finished products). The supply chain included around 24 various factories and facilities, of which only 16.7% were China-based. One possible contributing factor behind this phenomenon is the cost of moving intermediaries across China’s borders. Sourcing from China seems to be disadvantaged by the relatively high trade barriers and a lack of free trade agreements with key trading partners, especially when some components in the supply chain need to come from outside the Asia region, such as the Western Hemisphere and the EU.
Additionally, NO clear evidence suggests that pricing and environmental and social compliance significantly affect VF Corporation’s decision to source from China. For example, the apparel items using either China-made textile raw material or cut and sew in China had a wide price range in the retail market, from as little as $26 to as much as $740. The retail price of those apparel cut and sew in China ranged from $56 to $86, which was neither exceptionally high nor low (i.e., no particular pattern).
Meanwhile, according to VF Corporation, around 61.9% of its China-based factories across the apparel supply chain had received at least one type of “environmental & chemical management certification.” This record was on par with non-Chinese factories (64.8%). Likewise, around 29.0% of China-based tier 1 & tier 2 factories had received one type of “Health, Safety and Social Responsibility Certification(s),” similar to 22.5% of non-Chinese factories. Overall, how US fashion companies like VF Corporation factored in pricing, environmental, and social compliance in their sourcing decisions need to be explored further.
#1 COVID-19 continues to substantially affect U.S. fashion companies’ sourcing and business operations in 2021
Recovery is happening: Most respondents expect their business to grow in 2021. Around 76 percent foresee their sourcing value or volume to increase from 2020. Around 60 percent of respondents expect a full recovery of their sourcing value or volume to the pre-COVID level by 2022.
Uncertainties remain: Still, 27 percent find it hard to tell when a full recovery will happen. About 20 percent of respondents still expect 2021 to be a very challenging year financially.
U.S. fashion companies’ worries about COVID still concentrate on the supply side, including driving up production and sourcing costs and causing shipping delays and supply chain disruptions. U.S. fashion companies’ COVID response strategies include strengthening relationships with key vendors, emphasizing sourcing agility and flexibility, and leveraging digital technologies. In comparison, few respondents canceled sourcing orders this year.
#2 The surging sourcing costs are a significant concern to U.S. fashion companies in 2021.
As many as 97 percent of respondents anticipate the sourcing cost to increase further this year, including 37 percent expect a “substantial increase” from 2020.
Respondents say almost EVERYTHING becomes more expensive in 2021. Notably, more than 70 percent of respondents expect the “shipping and logistics cost,” “cost of textile raw material (e.g., yarns and fabrics),” “cost of sourcing as a result of currency value and exchange rate changes,” and “labor cost” to go up.
#3 U.S. fashion companies’ sourcing strategies continue to envovle in response to the shifting business environment.
Asia’s position as the dominant apparel sourcing base for U.S. fashion companies remains unshakeable.
“China plus Vietnam plus Many” remains the most popular sourcing model among respondents. However, the two countries combined now typically account for 20-40 percent of a U.S. fashion company’s total sourcing value or volume, down from 40-60 percent in the past few years.
Asia is U.S. fashion companies’ dominant sourcing base for textile intermediaries. “China plus at least 1-2 additional Asian countries” is the most popular textile raw material sourcing practice among respondents.
As U.S. fashion companies prioritize strengthening their relationship with key vendors during the pandemic, respondents report an overall less diversified sourcing base than in the past few years.
#4 U.S. fashion companies continue to reduce their China exposure. However, the debate on China’s future as a textile and apparel sourcing base heats up.
Most U.S. fashion companies still plan to source from China in short to medium terms. While 63 percent of respondents plan to decrease sourcing from China further over the next two years, it is a notable decrease from 70 percent in 2020 and 83 percent in 2019.
Most respondents still see China as a competitive and balanced sourcing base from a business perspective. Few other sourcing countries can match China’s flexibility and agility, production capacity, speed to market, and sourcing cost. As China’s role in the textile and apparel supply chain goes far beyond garment production and continues to expand, it becomes ever more challenging to find China’s alternatives.
Non-economic factors, particularly the allegations of forced labor in China’s Xinjiang Uygur Autonomous Region (XUAR), significantly hurt China’s long-term prospect as a preferred sourcing base by U.S. fashion companies. China also suffered the most significant drop in its labor and compliance rating this year.
#5 With an improved industry look and the continued interest in reducing “China exposure,” U.S. fashion companies actively explore new sourcing opportunities.
Vietnam remains a hot sourcing destination. However, respondents turn more conservative this year about Vietnam’s growth potential due to rising cost concerns and trade uncertainties caused by the Section 301 investigation.
U.S. fashion companies are interested in sourcing more from Bangladesh over the next two years. Respondents say apparel “Made in Bangladesh” enjoys a prominent price advantage over many other Asian suppliers. However, the competition among Bangladeshi suppliers could intensify as U.S. fashion companies plan to “work with fewer vendors in the country.”
Respondents are also interested in sourcing more from Sub-Saharan Africa by leveraging the African Growth and Opportunity Act (AGOA). Respondents also demonstrate a growing interest in investing more in AGOA members directly. “Replace AGOA with a permanent free trade agreement that requires reciprocal tariff cuts and continues to allow the “third-country fabric provision” is respondents’ most preferred policy option after AGOA expires in 2025.
#6 Sourcing from the Western Hemisphere is gaining new momentum
Overall, U.S. fashion companies’ growing interest in the Western Hemisphere is more about diversifying sourcing away from China and Asia than moving the production back to the region (i.e., reshoring or near-shoring).
Respondents say CAFTA-DR’s “short supply” and “cumulation” mechanisms provide critical flexibility that allow U.S. fashion companies to continue to source from its members. However, despite the “yarn-forward” rules of origin, only 15 percent of respondents sourcing apparel from CAFTA-DR members say they “purposefully use U.S.-made fabrics” to enjoy the agreement’s duty-free benefits.
Respondents suggest that encouraging more apparel sourcing from the Western Hemisphere requires three significant improvements: 1) make the products more price competitive; 2) strengthen the region’s fabric and textile raw material production capacity; 3) make rules of origin less restrictive in relevant U.S. trade agreements.
This year’s benchmarking study was based on a survey of executives at 31 leading U.S. fashion companies from April to June 2021. The study incorporates a balanced mix of respondents representing various types of businesses in the U.S. fashion industry. Approximately 54 percent of respondents are self-identified retailers, 46 percent self-identified brands, 69 percent self-identified importers/wholesalers. Around 65 percent of respondents report having more than 1,000 employees. Another 27 percent of respondents represent medium-sized companies with 101-999 employees.
In June 2021, the U.S. International Trade Commission (USITC) released the 2021 Economic Impact of Trade Agreements Implemented under Trade Authorities Procedures report. By using both qualitative and quantitative methods, USITC assessed the impact of trade agreements on U.S. industries, including workers, since 2016. Below are the key findings related to the textile and apparel sector:
First, free trade agreements enacted in the U.S. have had a small but positive effect on the U.S. economy and trade. As of January 1, 2021, the United States has 14 free trade agreements (FTAs) with 20 countries in force. In the year 2017 (the base year), they led to an estimated increase in U.S. real Gross Domestic Product (GDP) of $88.8 billion (0.5 percent), and in aggregate U.S. employment of 485,000 full-time equivalent (FTE) jobs (0.3 percent). Real wages increased by 0.3 percent. Further, U.S. exports increased by $37.4 billion (1.6 percent), and imports increased by $95.2 billion (3.4 percent) because of these FTAs.
Second, USITC estimates that U.S.-free trade agreements have expanded the U.S. textile industry but hurt U.S. domestic apparel production. Thanks to the North American Free Trade Agreement (NAFTA, now the U.S.-Mexico-Canada Trade Agreement, USMCA) and the Dominican Republic-Central America Free Trade Agreement (CAFTA-DR), the Western Hemisphere has become the single largest export market for U.S. textile producers. However, U.S. apparel manufacturers have to face intensified import competition.
Third, the textile and apparel-specific rules in U.S. free trade agreements are complicated and often hinder the usage of the trade agreements. As noted by USITC, the U.S. duty on imported textile and, especially, apparel goods are among the highest of all product categories. Despite the duty-saving incentives, only 12.1% of U.S. textile and apparel imports came in under FTAs in 2020, even lower than 16.7% in 2007 when fewer FTAs were in force.
The complexity of the textile and apparel-specific rules of origins (ROOs) is a significant cause of the low FTA utilization rate. As USITC noted, “No two FTAs using the tariff shift model contain the same ROOs for apparel goods…for some importers, the strict preference rules of origins (ROOs), along with the record-keeping and documentation requirements the rules entail, make the cost of compliance too great to take full advantage of the duty-free opportunities.” According to the annual USFIA fashion industry benchmarking study, the surveyed U.S. fashion companies consistently expressed the same concerns about the too restrictive ROOs in U.S. FTAs.
Related, the USITC report noted, “some U.S. domestic textile industry representatives state that the existing FTA rules follow a simple template designed to benefit upstream manufacturers in the textile and apparel supply chain.” Having to use more expensive domestic-made fibers and yarns reduces the price competitiveness of U.S. fabrics and home textiles in the export market.
Further, the USITC report explains the history of the “Short supply” and “Tariff-preference level, TPL” mechanisms in U.S. free trade agreements. However, the report does not provide an assessment of their trade impacts.
Trade statistics show that these exceptions to the restrictive “yarn-forward” rules of origin are critical for U.S. apparel sourcing from certain FTA partners. For example, more than 60% of U.S. apparel imports from Canada claimed duty-free benefits by using the TPL mechanism rather than complying with the USMCA/NAFTA “yarn-forward” rules in 2020. Around 8% of U.S. apparel imports from Mexico did the same. Likewise, in 2020, approximately 4% of U.S. apparel imports from CAFTA-DR members used the “short supply” mechanism, and the other 4% used the “cumulation” mechanism.
The China National Textile and Apparel Council (CNTAC), the governing body of China’s textile and apparel industry, recently released its 14th five-year plan, detailing the development objectives, growth strategies, and priority tasks for China’s textile and apparel sector from 2021 to 2025. Unlike most market economies, the “five-year plan” serves as China’s top economic development guidelines. Therefore, companies at the micro-level study and follow the “five-year” plan closely to ensure their corporate business strategies align with the tones and visions set out by policymakers.
Based on the plan, several trends are worth watching regarding the future of China’s textile and apparel industry:
#1 Complicated by both economic and non-economic factors, the growth prospect for China’s textile and apparel industry is facing more uncertainties over the next five years.
#2 “Growing bigger” will no longer be a priority for China’s textile and apparel sector over the next five years. However, China has no intention to cut textile and apparel production capacity or shrink its size substantially either.
#3 China intends to develop a more sophisticated and high-tech-driven textile and apparel industry and engage in more value-added functions in the supply chain. Notably, in recent years, while China’s shares in the total world apparel exports declined, China is playing a more significant role as a textile supplier for many apparel exporting countries, especially in Asia.
In almost all markets, China is losing market shares for its apparel exports China is playing a more significant role as a textile supplier for many apparel-exporting countries
#4 As the export market deteriorated, China plans to rely more heavily on its domestic market to support the textile and apparel industry’s growth. Industry sources predict that China’s annual clothing retail sales could exceed $415 billion by 2025 (vs. $347 billion in the U.S.).
China’s annual clothing retail sales could exceed $415 billion by 2025
#5 China will continue its efforts in “going global,” i.e., investing in textile and apparel factories overseas, mainly through the “Belt and Road Initiative.” According to CNTAC, China’s outbound foreign investments in the textile and apparel sector exceeded $6.7 billion from 2015 to 2020. Nearly $1.8 billion (or 26.6%) went to neighboring southeast Asian countries, including Vietnam, Cambodia, Thailand, Lao, and Myanmar.
#6 China intends to develop a “greener” and more sustainable textile and apparel industry. However, instead of simply reducing pollutants and water usage, China plans to develop a sustainability-led growth model, emphasizing areas including circular economy and creating new value-added products based on recycled material.