Outlook 2019: Apparel Industry Issues in the Year Ahead is available

In January 2018, Just-Style consulted a panel of industry leaders and scholars in its Outlook 2018–Apparel Industry Issues in the Year Ahead management briefing. Below is my contribution to the report. All suggestions and comments are most welcome!
1. What do you see as the biggest challenges – and opportunities – facing the apparel industry in 2018, and why?
One of the biggest opportunities facing the apparel industry in 2018 could be the faster growth of the world economy. According to the International Monetary Fund (IMF), the global growth forecast for 2018 is expected to reach 3.7 percent, about 0.1 percent points higher than 2017 and 0.6 percent points higher than 2016. Notably, the upward economic growth will be broad-based, including the United States, the Euro area, Japan, China, emerging Europe and Russia. Hopefully, the improved growth of the world economy will translate into increased consumer demand for clothing in 2018.
Nevertheless, from the macroeconomic perspective, oversupply will remain a significant challenge facing the apparel industry in 2018. Data from the World Bank and the World Trade Organization (WTO) shows that, while the world population increased by 21.6 percent between 2000 and 2016, the value of clothing exports (inflation-adjusted) surged by 123.5 percent over the same period. Similarly, between 2000 and 2016, the total U.S. population increased by 14.5 percent and the GDP per capita increased by 22.2 percent, but the supply of apparel to the U.S. retail market surged by over 67.8 percent during the same time frame. The problem of oversupply is the root of many challenges faced by apparel companies today, from the intense market competition, pressure of controlling production and sourcing cost, struggling with excessive inventory and deep discounts to balancing sustainability and business growth.
2: What’s happening with sourcing? How is the sourcing landscape likely to shift in 2018, and what can apparel firms and their suppliers do to stay ahead?
The 2017 US Fashion Industry Benchmarking Study, which I conducted in collaboration with the US Fashion Industry Association (USFIA) earlier this year, provides some interesting insights into companies’ latest sourcing strategies and trends. Based on a survey of 34 executives at the leading U.S. fashion companies, we find that:
First, most surveyed companies continue to maintain a relatively diversified sourcing base, with 57.6 percent currently sourcing from 10+ different countries or regions, up from 51.8 percent last year. Larger companies, in general, continue to have a more diversified sourcing base than smaller companies. Further, around 54 percent of respondents expect their sourcing base will become more diversified in the next two years, up from 44 percent in 2016; over 60 percent of those expecting to diversify currently source from more than 10 different countries or regions already. Given the uncertainties in the market and the regulatory environment (such as the Trump Administration’s trade policy agenda), companies may use diversification to mitigate potential market risks and supply chain disruptions due to protectionism.
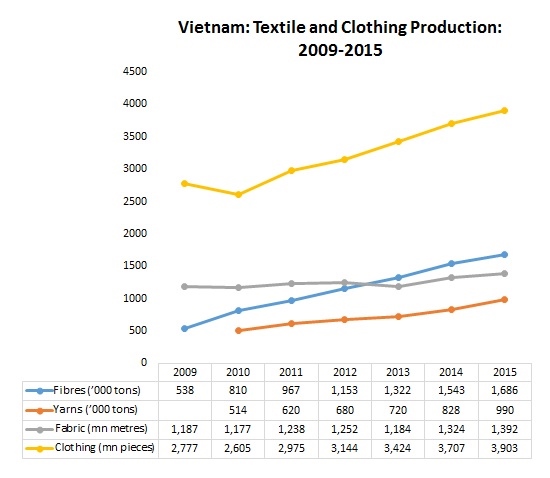
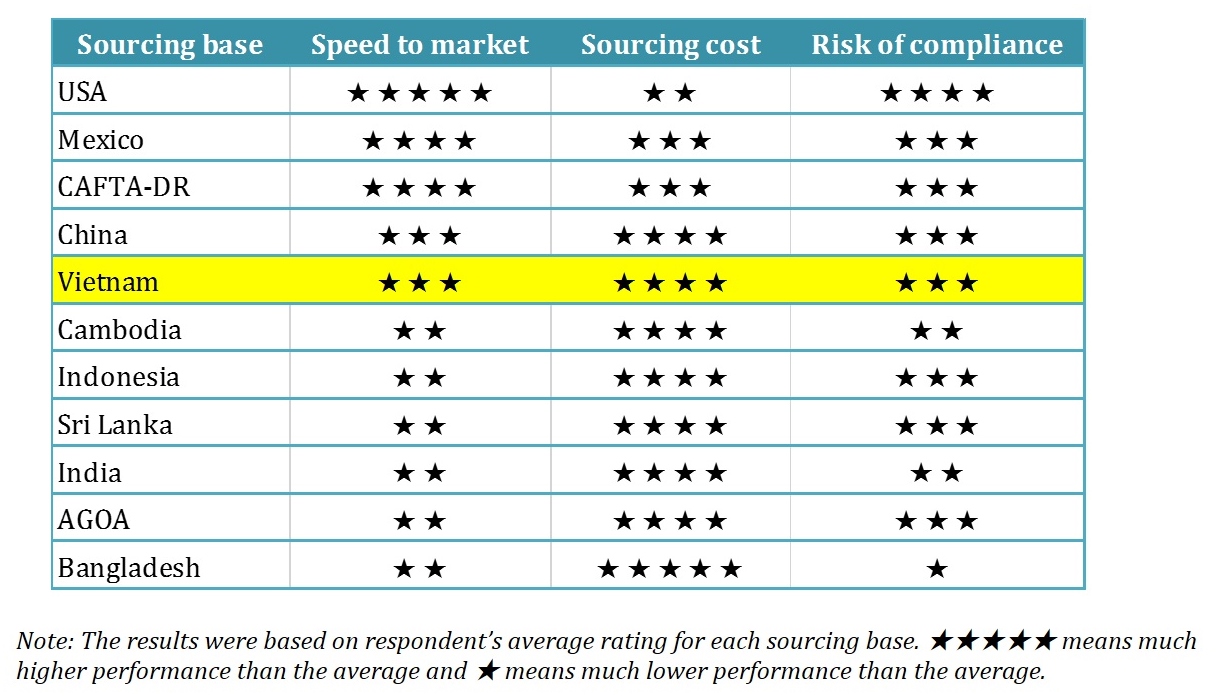
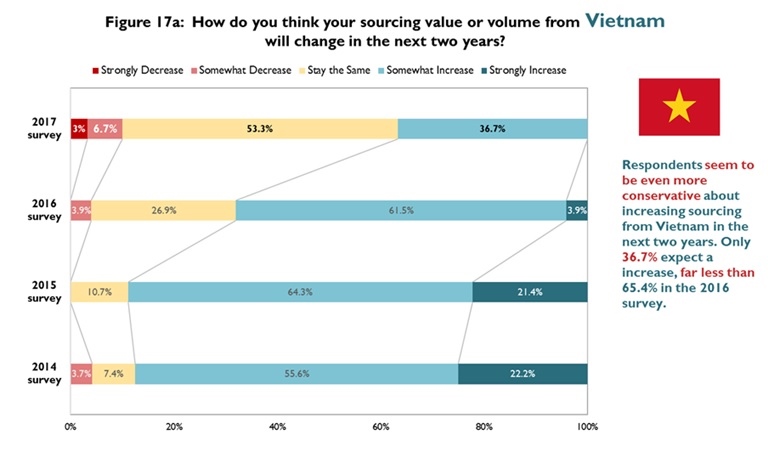
Second, although U.S. fashion companies continue to seek alternatives to “Made in China” actively, China’s position as top sourcing destination remains unshakable. Many respondents attribute China’s competitiveness to its enormous manufacturing capacity and overall supply chain efficiency. Meanwhile, it is interesting to note that the most common sourcing model is shifting from “China Plus Many” to “China Plus Vietnam Plus Many” (i.e. China typically accounts for 30-50 percent of total sourcing value or volume, 11-30 percent for Vietnam and less than 10 percent for other sourcing destinations). I think this sourcing model will likely to continue in 2018.
Third, social responsibility and sustainability continue to grow in importance in sourcing decisions. In the study, we find that nearly 90 percent of respondents give more weight to sustainability when choosing where to source now than in the past. Around 90 percent of respondents also say they map their supply chains, i.e., keeping records of name, location, and function of suppliers. Notably, more than half of respondents track not only Tier 1 suppliers, suppliers they contract with directly, but also Tier 2 suppliers, i.e., supplier’s suppliers. However, the result also suggests that a more diversified sourcing base makes it more difficult to monitor supply chains closely. Making the apparel supply chain more socially responsible, sustainable and transparent will continue to be a hot topic in 2018.
3: What should apparel firms and their suppliers be doing now if they want to remain competitive further into the future? What will separate the winners from the losers?
I assume many experts will suggest what apparel firms should change to stay competitive into the future. However, the question in my mind is what should companies keep doing regardless of the external business environment? First, I think companies should always strive to understand and impress consumers and control their supply chains. Despite the growing popularity of e-commerce and the adoption of transformative new technologies, the fundamental nature of apparel as a buyer-driven business will remain the same. Second, companies should always leverage their resources and stay “unique,” no matter it means offering differentiated products or value-added services, maintaining exclusive distribution channels or keeping the leadership position in a particular niche market. Third, apparel firms should always follow the principle of “comparative advantage” and smartly define the scope of their core business functions instead of trying to do everything. Additionally, winners will always be those companies that can take advantage of the mega-development trends of the industry and be willing to make long-term and visionary investments, both physical and intangible (such as human talents).
4: What keeps you awake at night? Is there anything else you think the apparel industry should be keeping a close eye on in the year ahead? Do you expect 2018 to be better than 2017, and why?
I think the apparel industry should keep a close eye on the following issues in 2018:
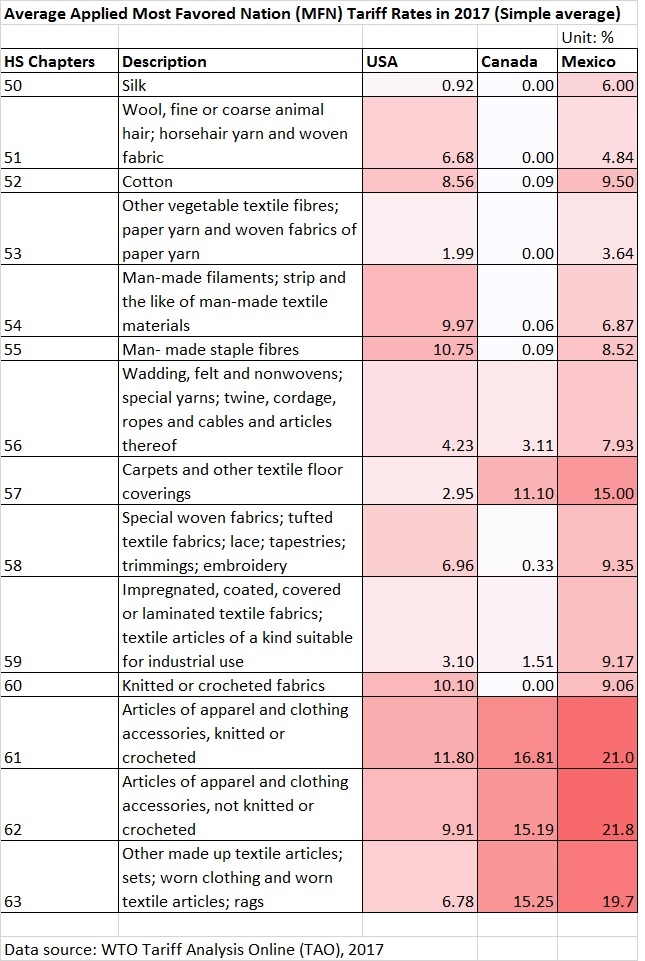
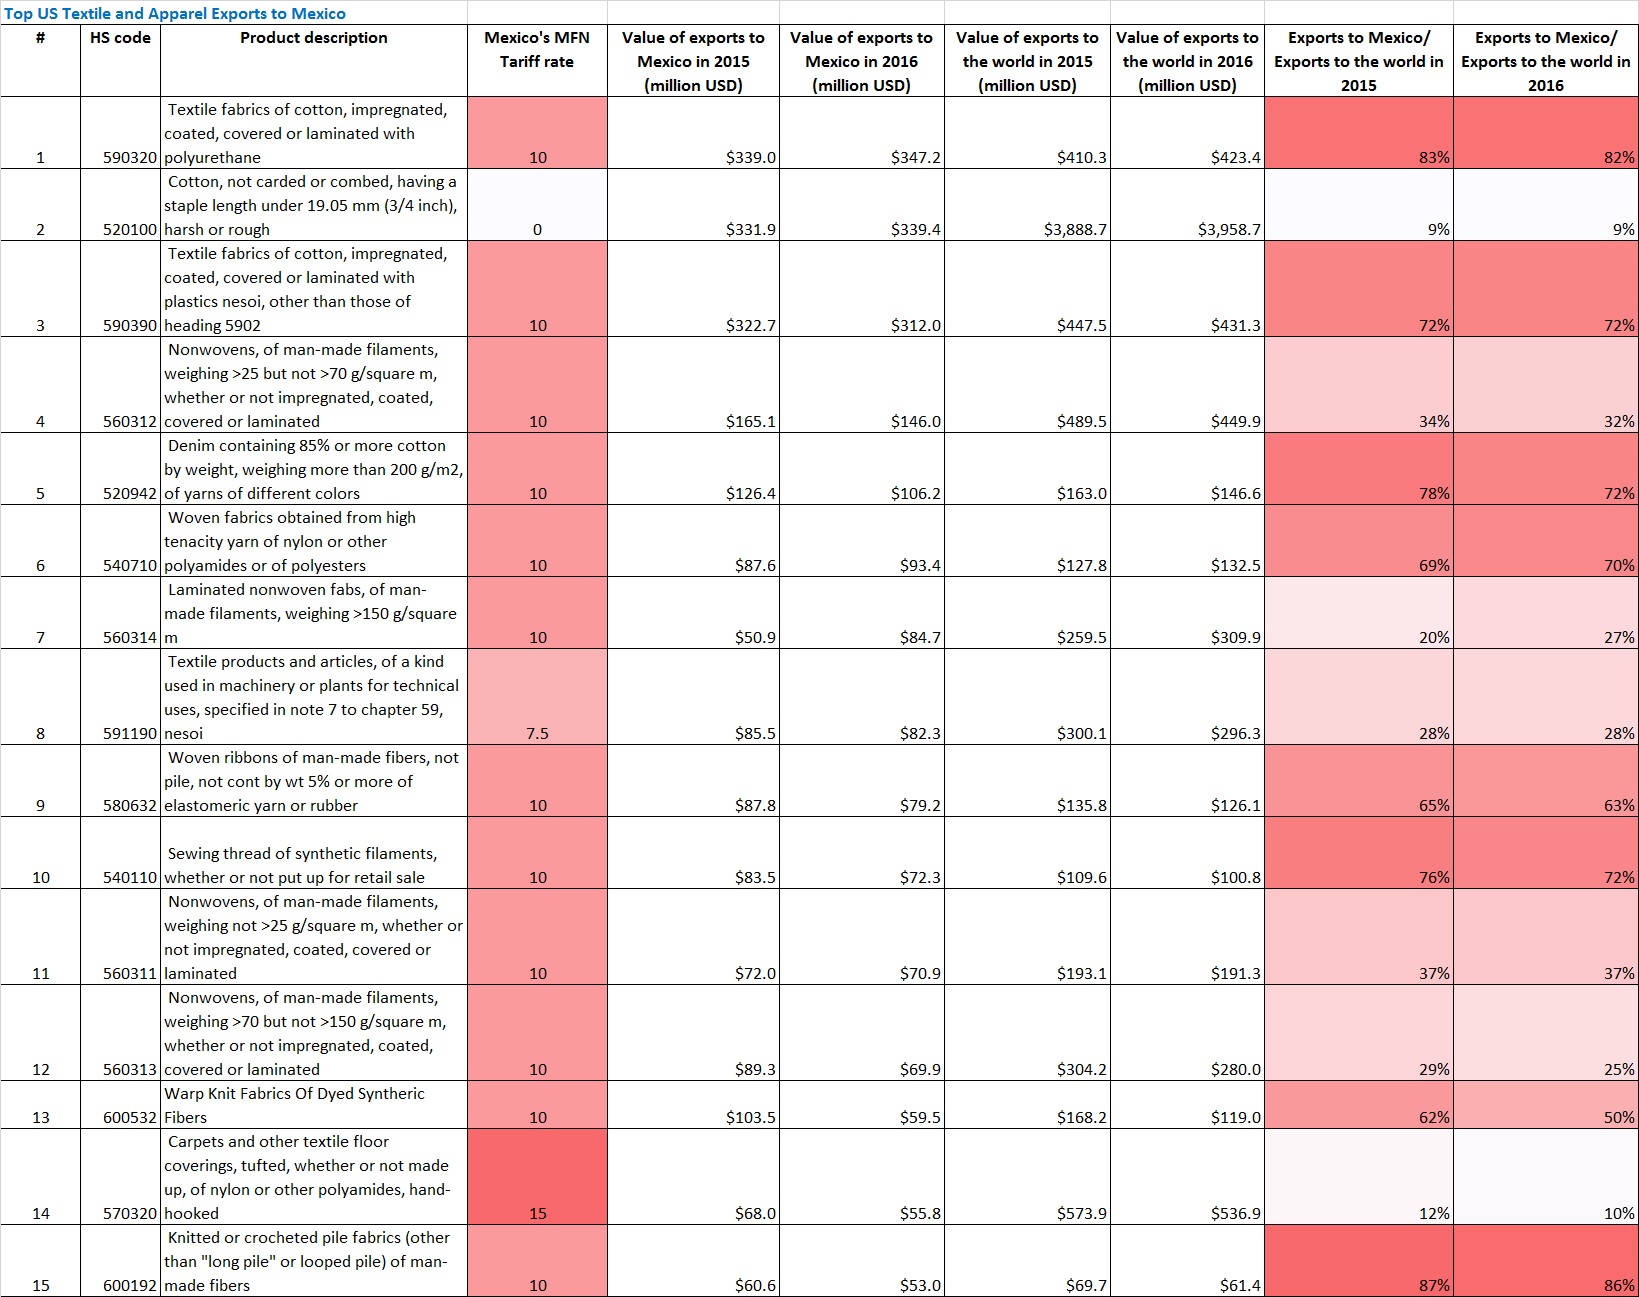
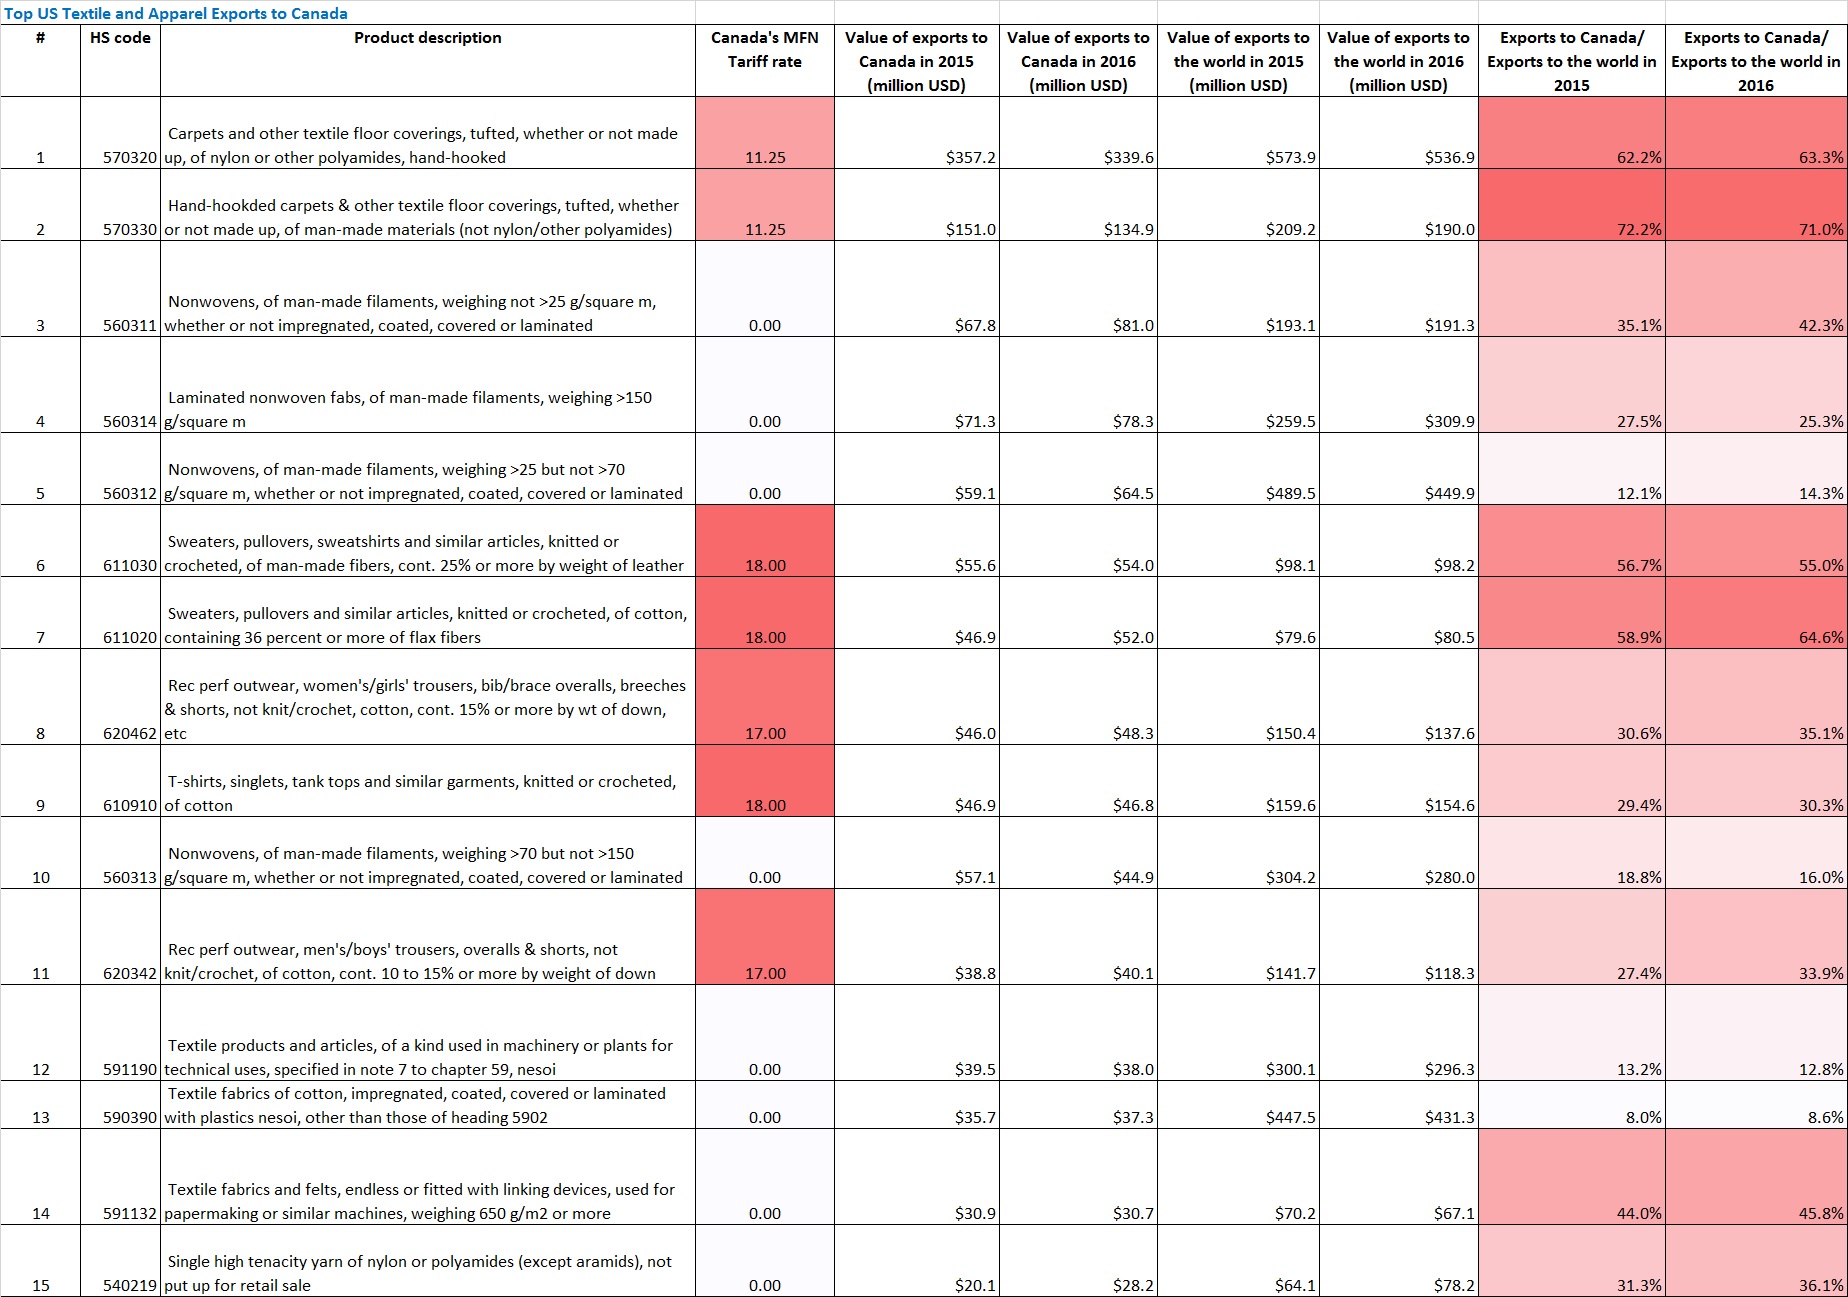
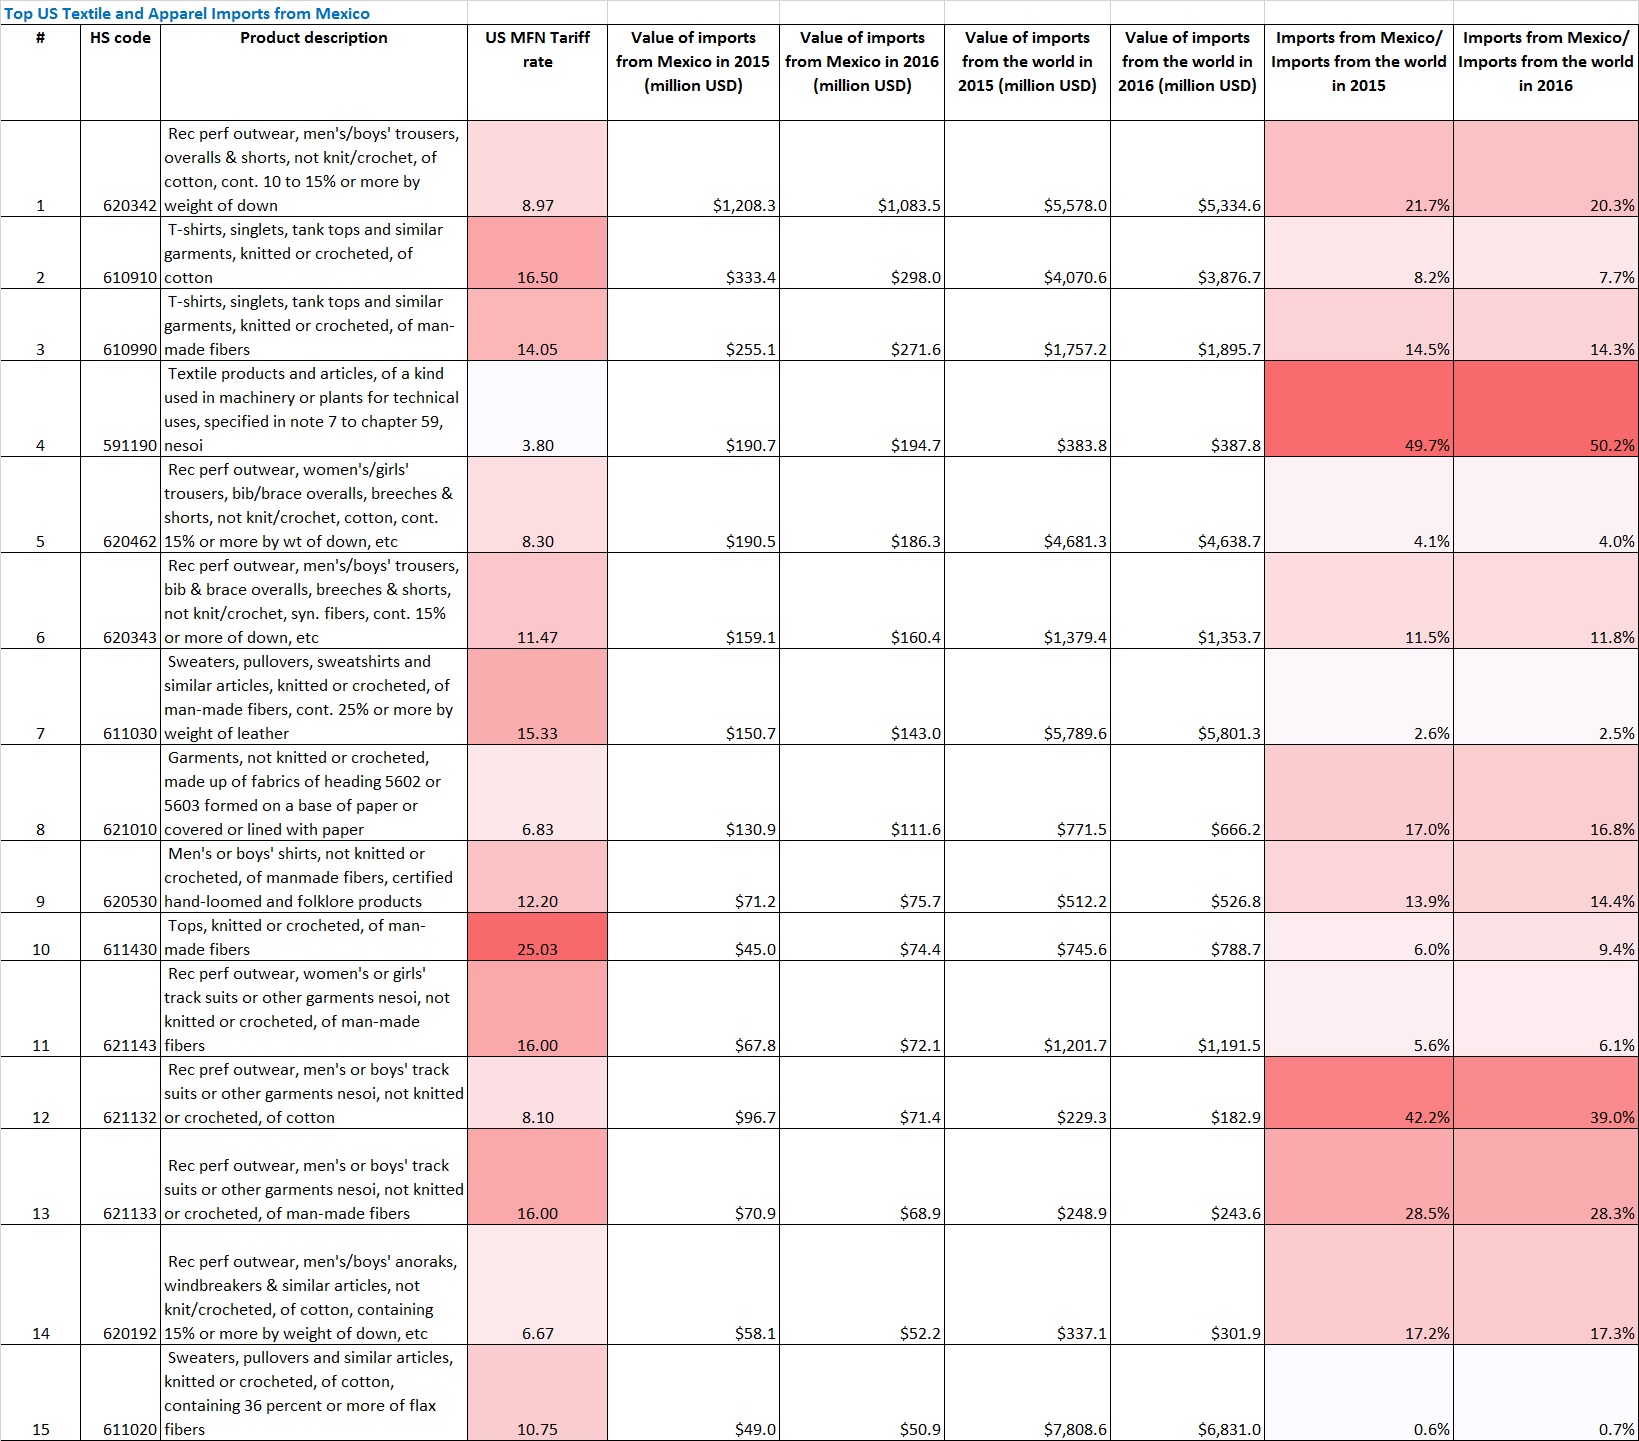
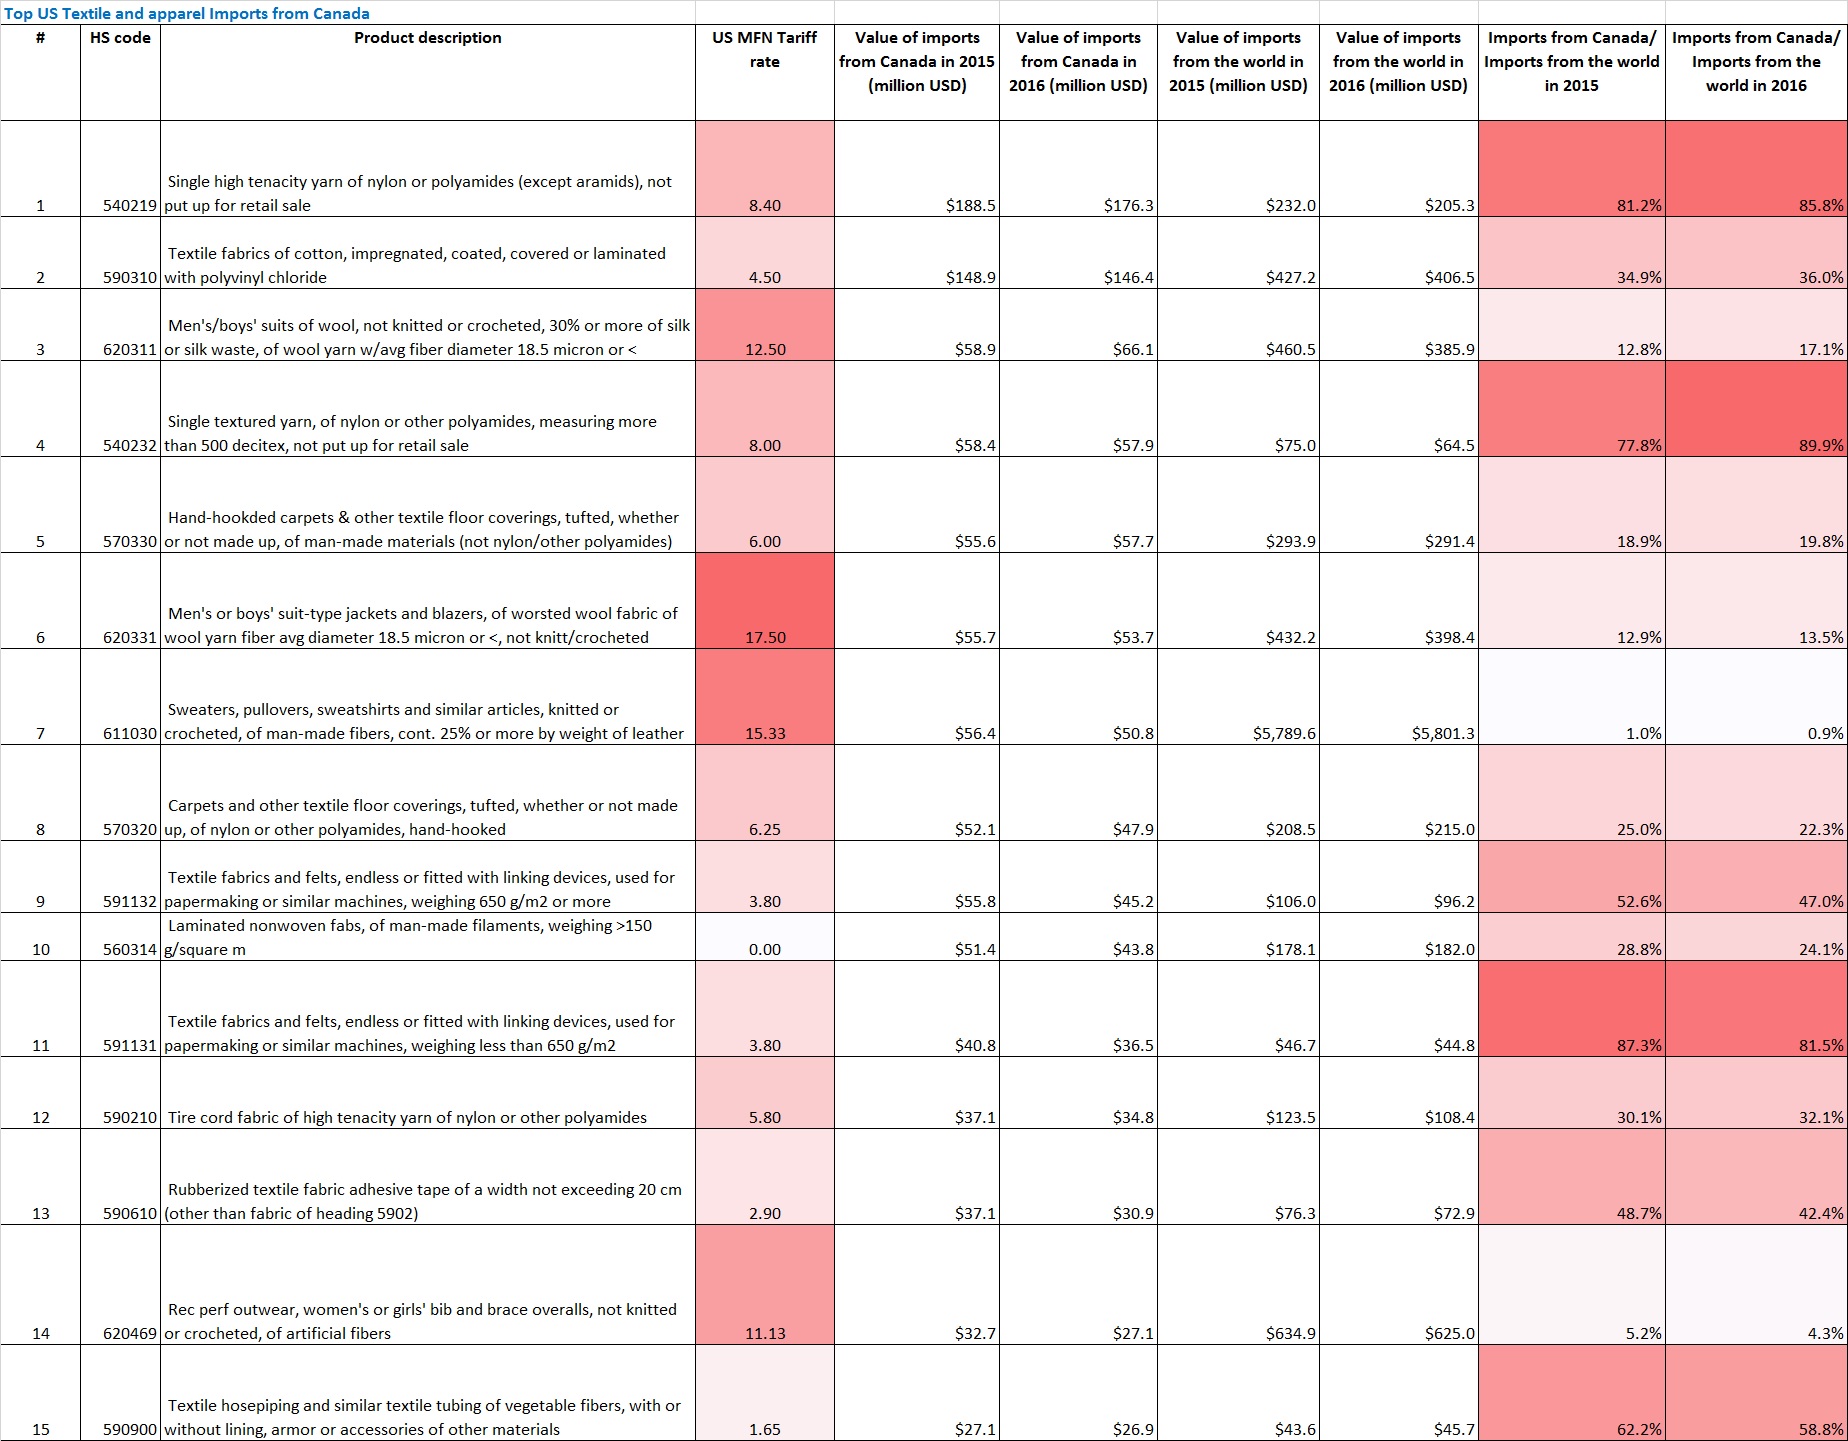
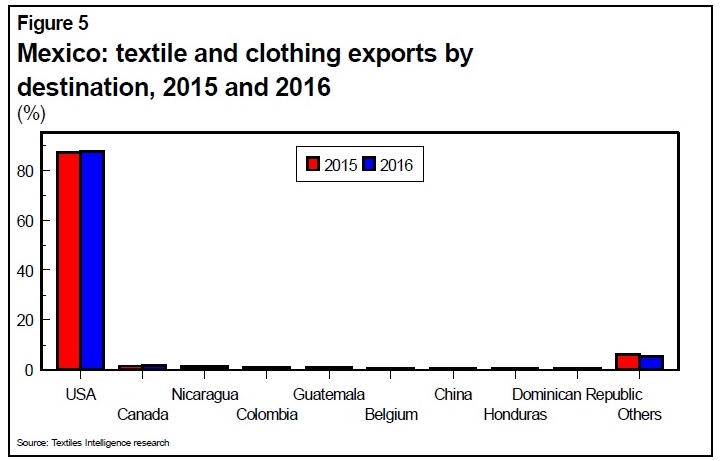
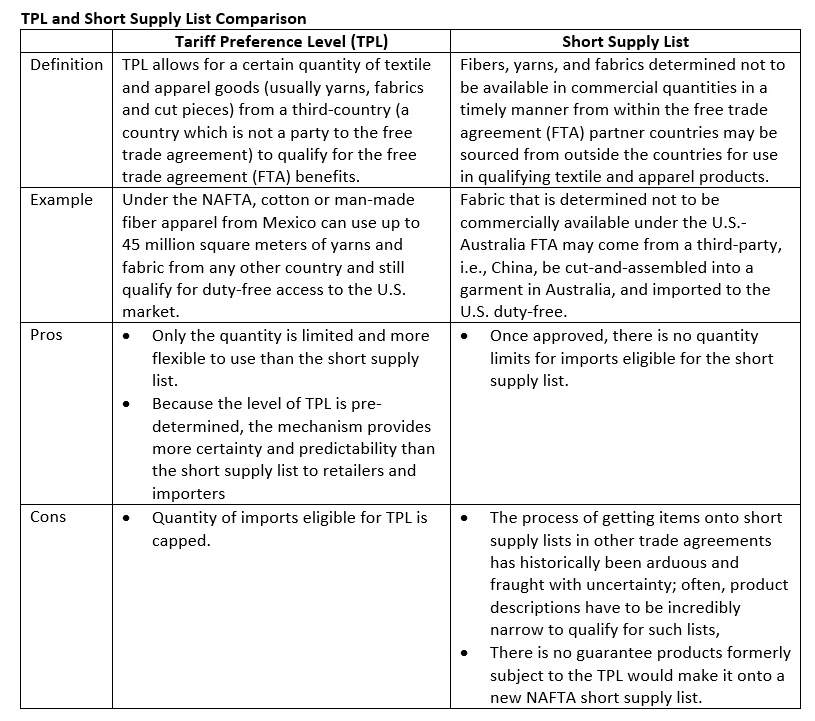
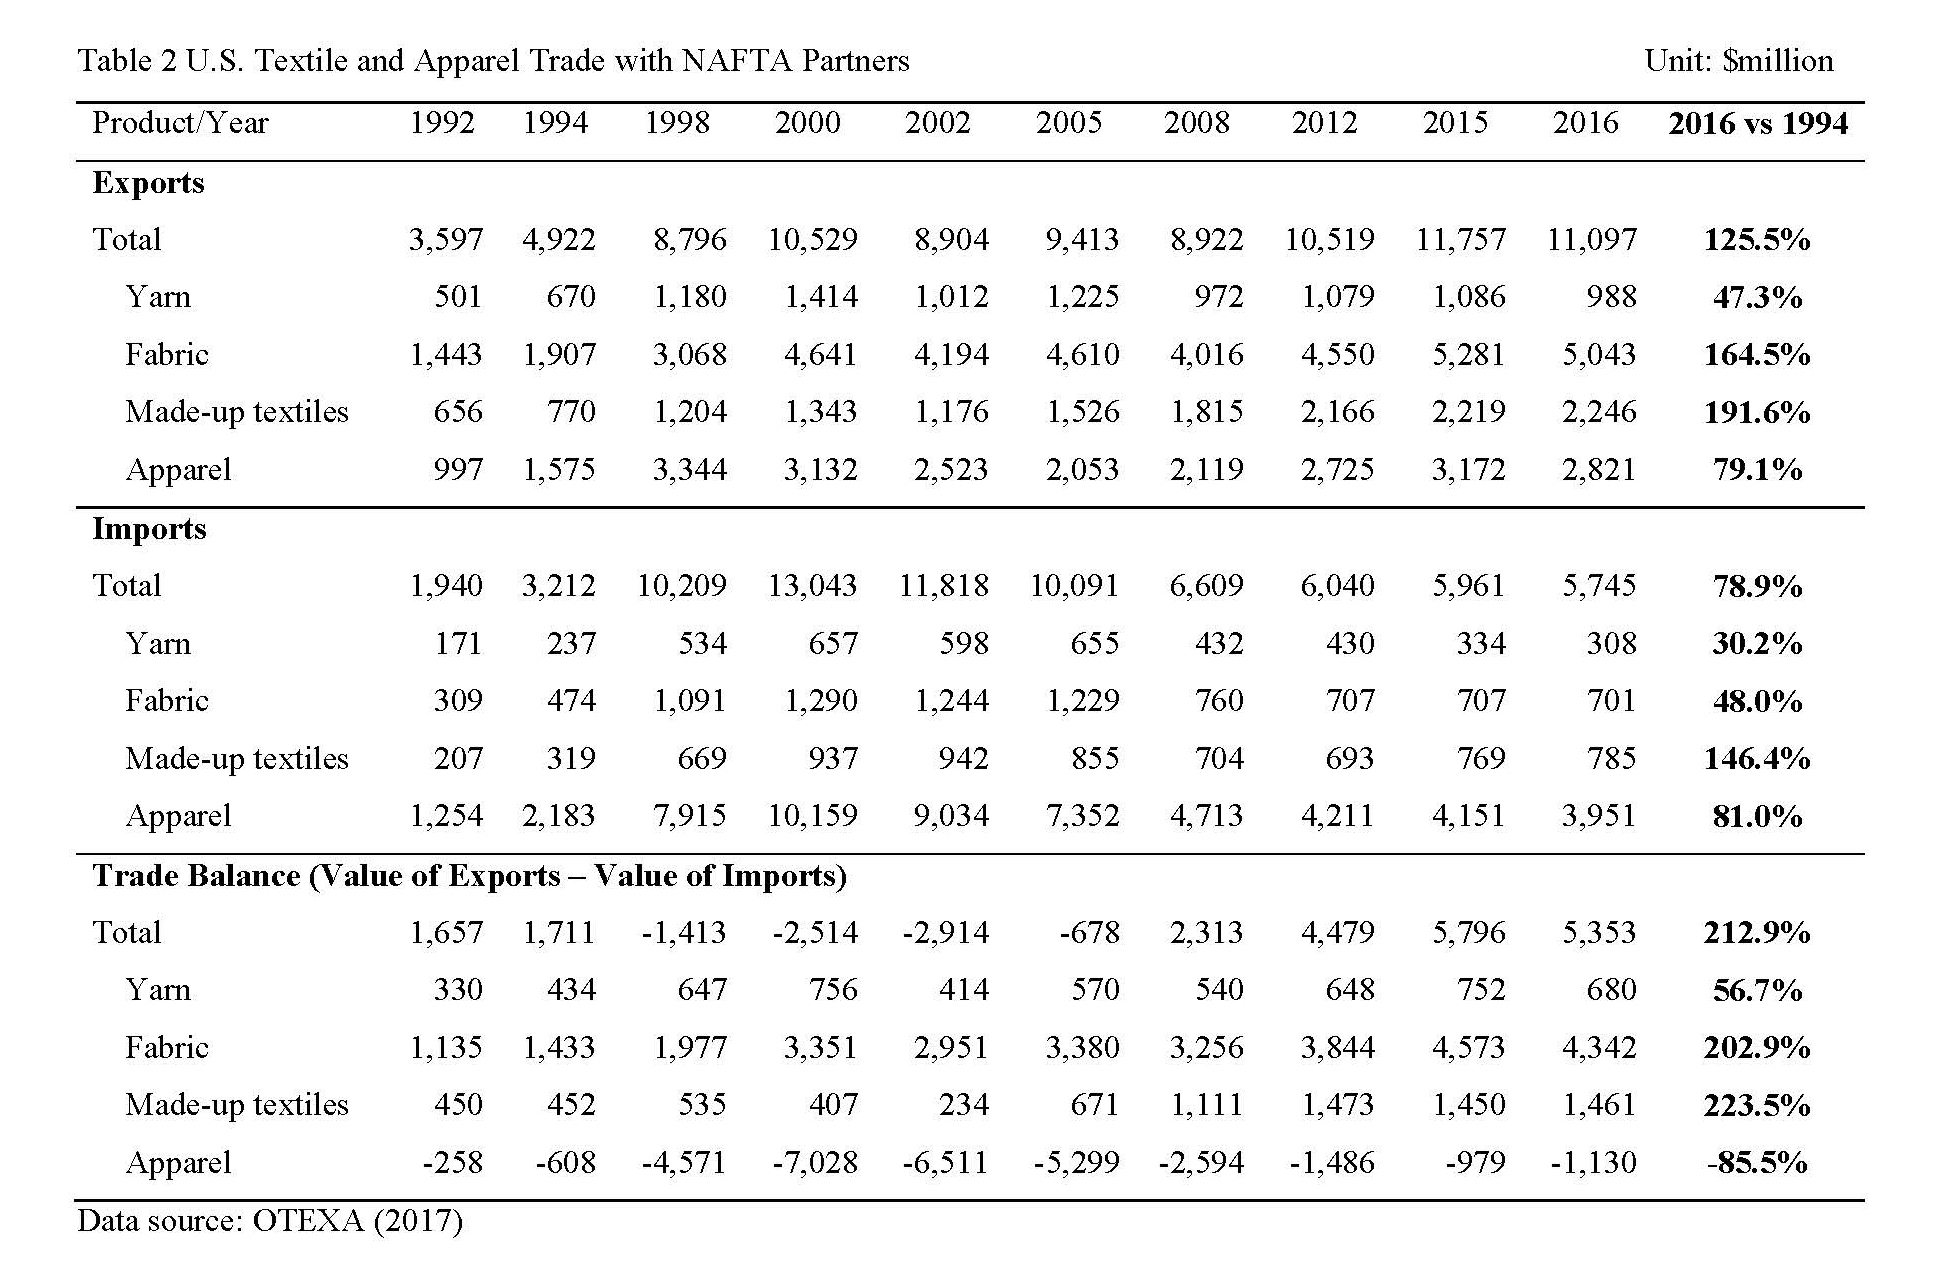
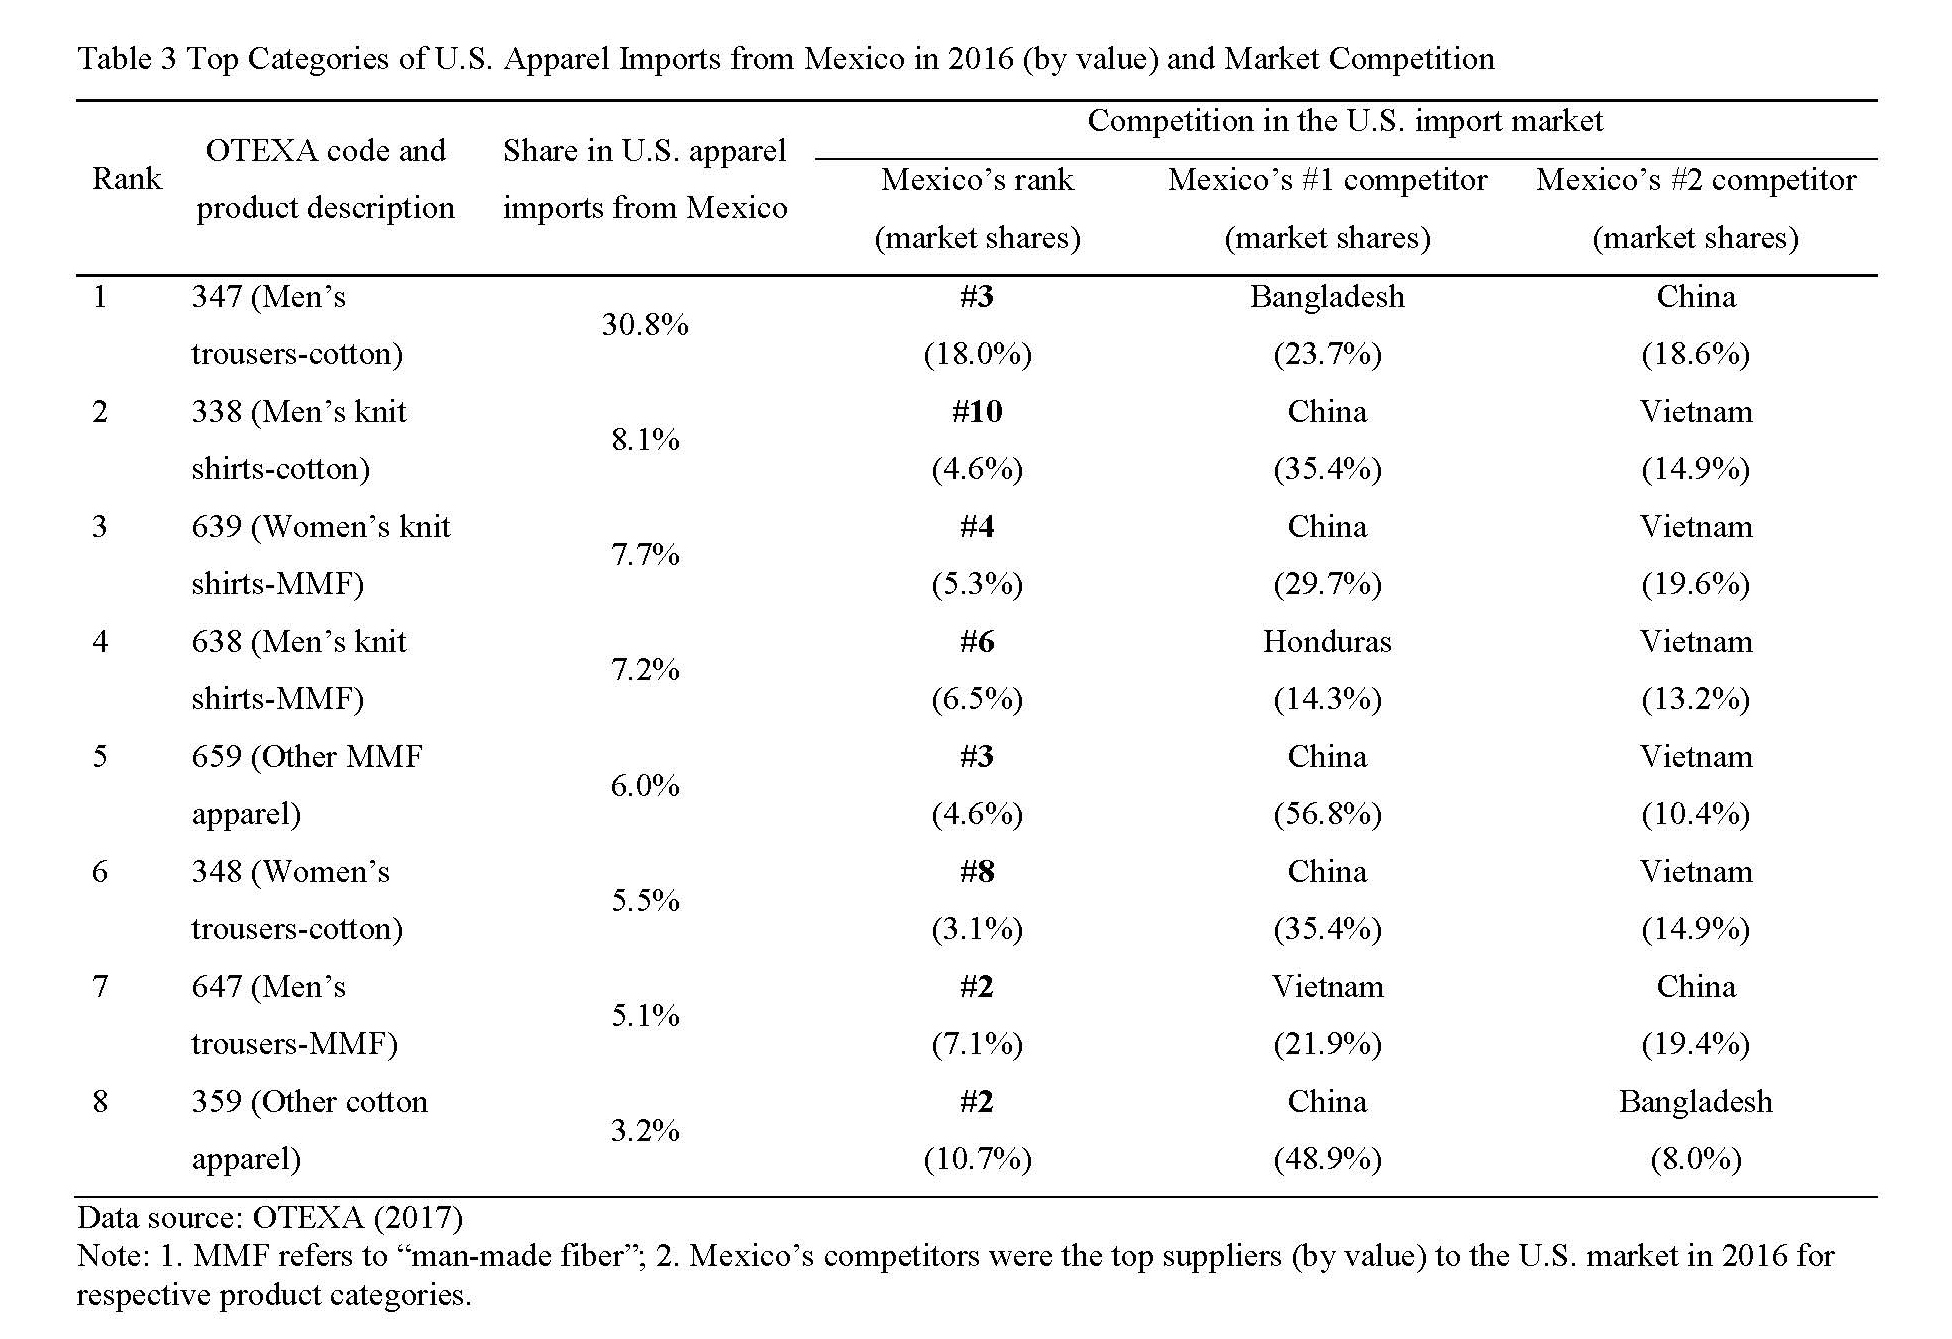
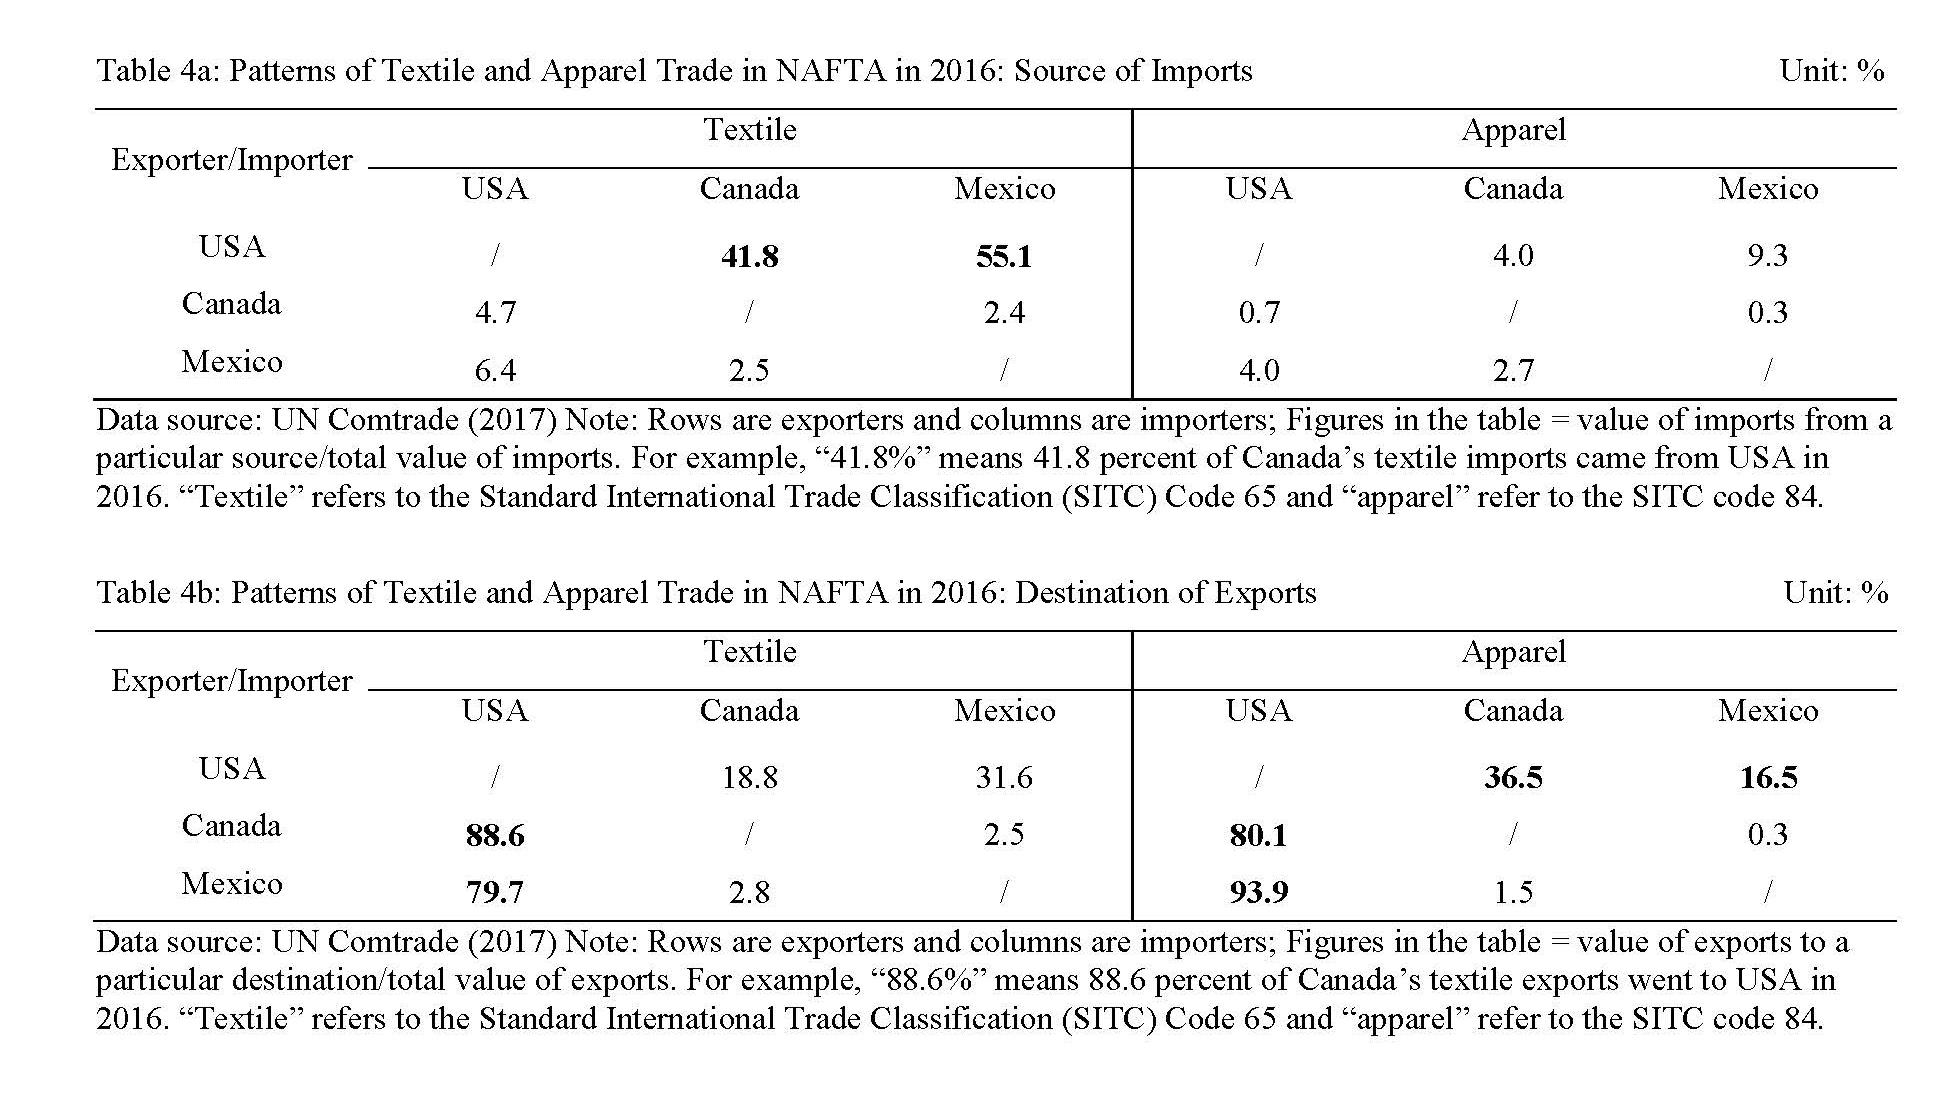
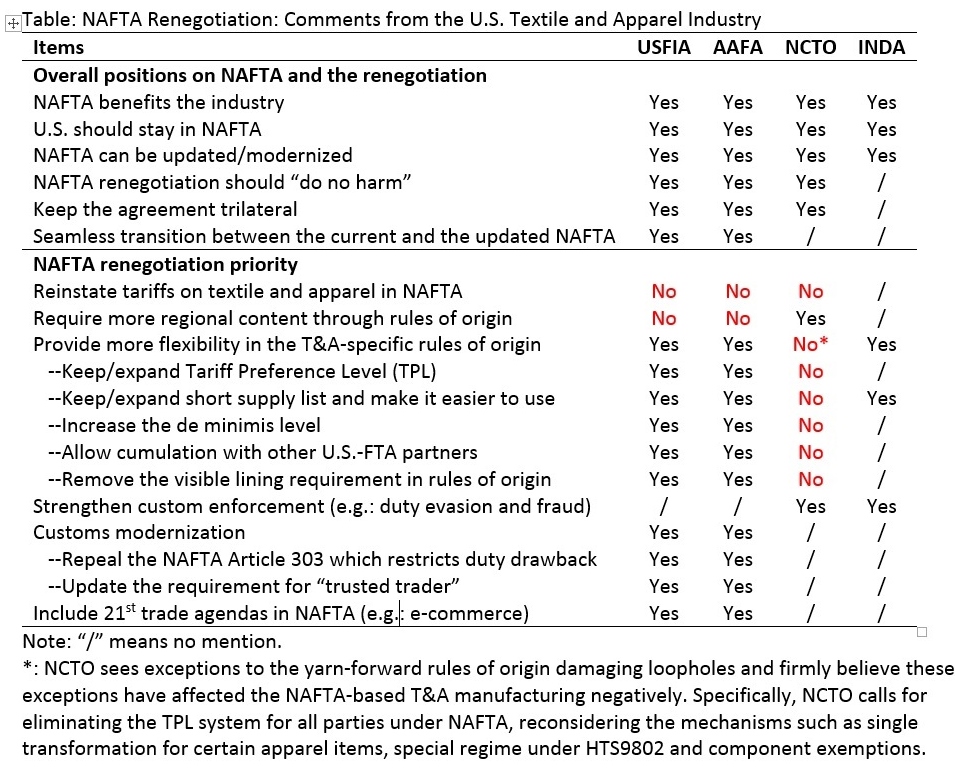
- The destiny of the North American Free Trade Agreement (NAFTA): The potential policy change to NAFTA means so much to the U.S. textile and apparel industry as well as suppliers in other parts of the world. Notably, through a regional textile and apparel supply chain facilitated by the agreement over the past 23 years, the NAFTA region has grown into the single largest export market for U.S. textile and apparel products as well as a major apparel sourcing base for U.S. fashion brands and retailers. In 2016, as much as half of U.S. textile and apparel exports went to the NAFTA region, totaling US$11billion, and U.S. apparel imports from Mexico and Canada exceeded US$3.9billion. Understandably, if NAFTA no longer exists, sweeping changes in the trade rules, such as import duties, could significantly affect the sourcing and manufacturing behaviors of U.S. textile and apparel companies and consequentially alter the current textile and apparel trade patterns in the NAFTA region. For example, Mexico’s focus on basic apparel items suggests that U.S. importers could quickly source from elsewhere if duty savings under NAFTA are eliminated.
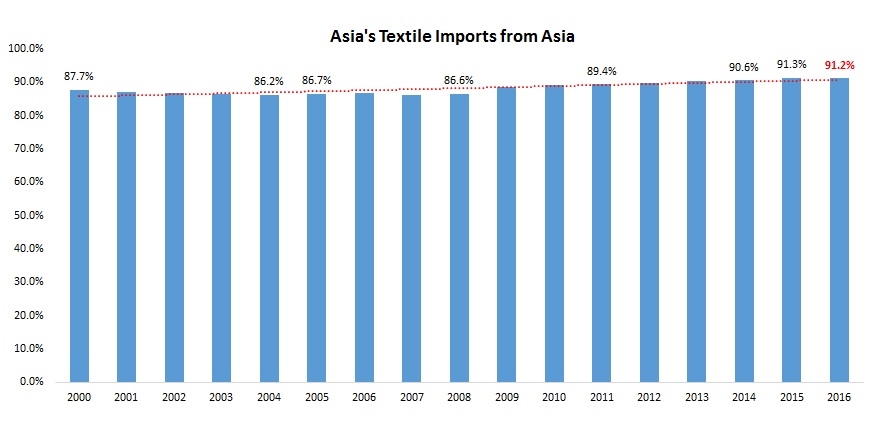
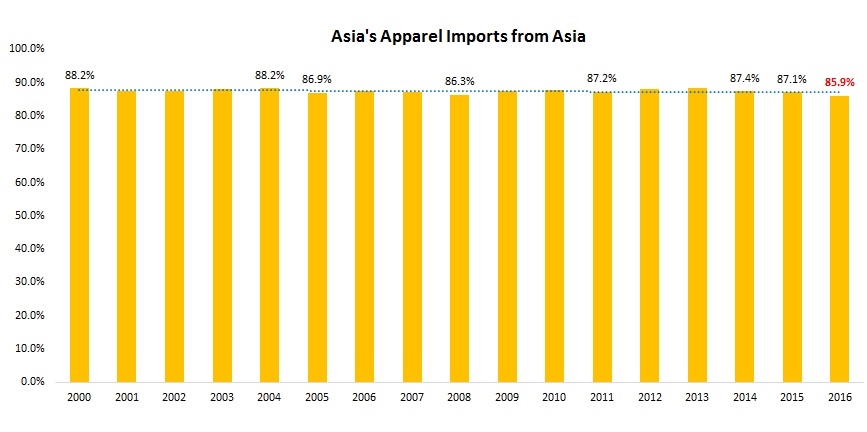
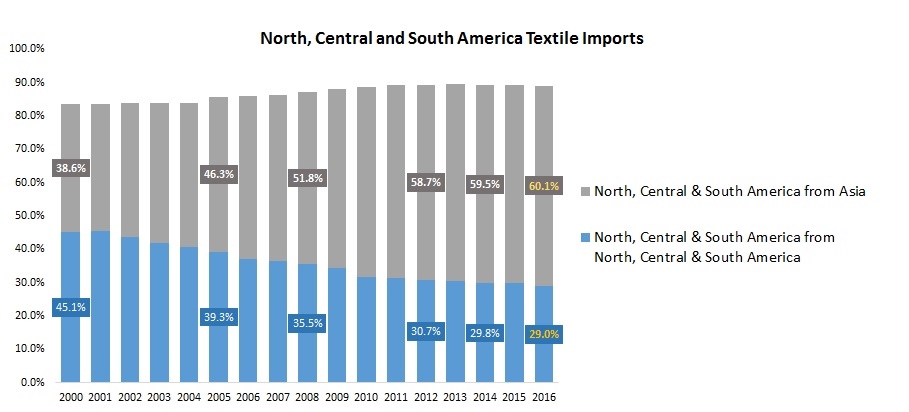
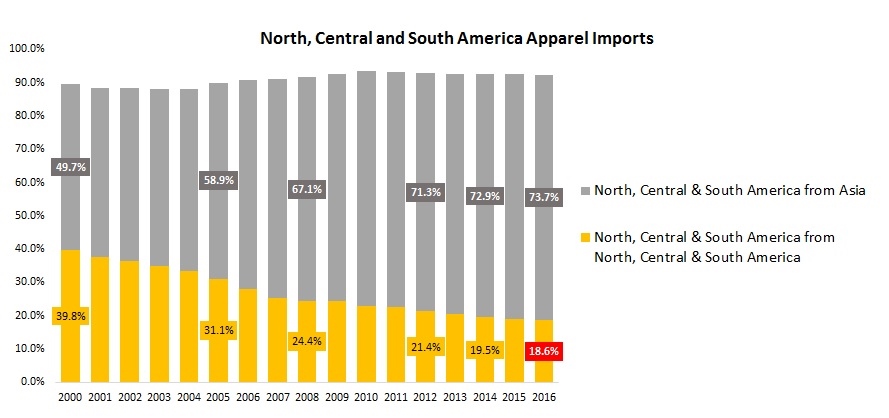
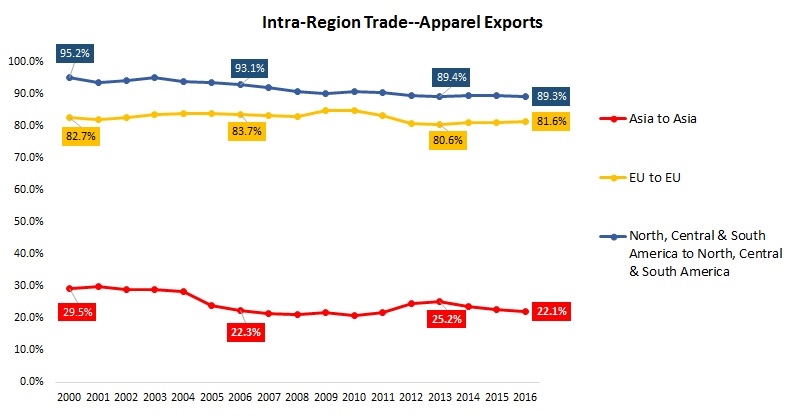
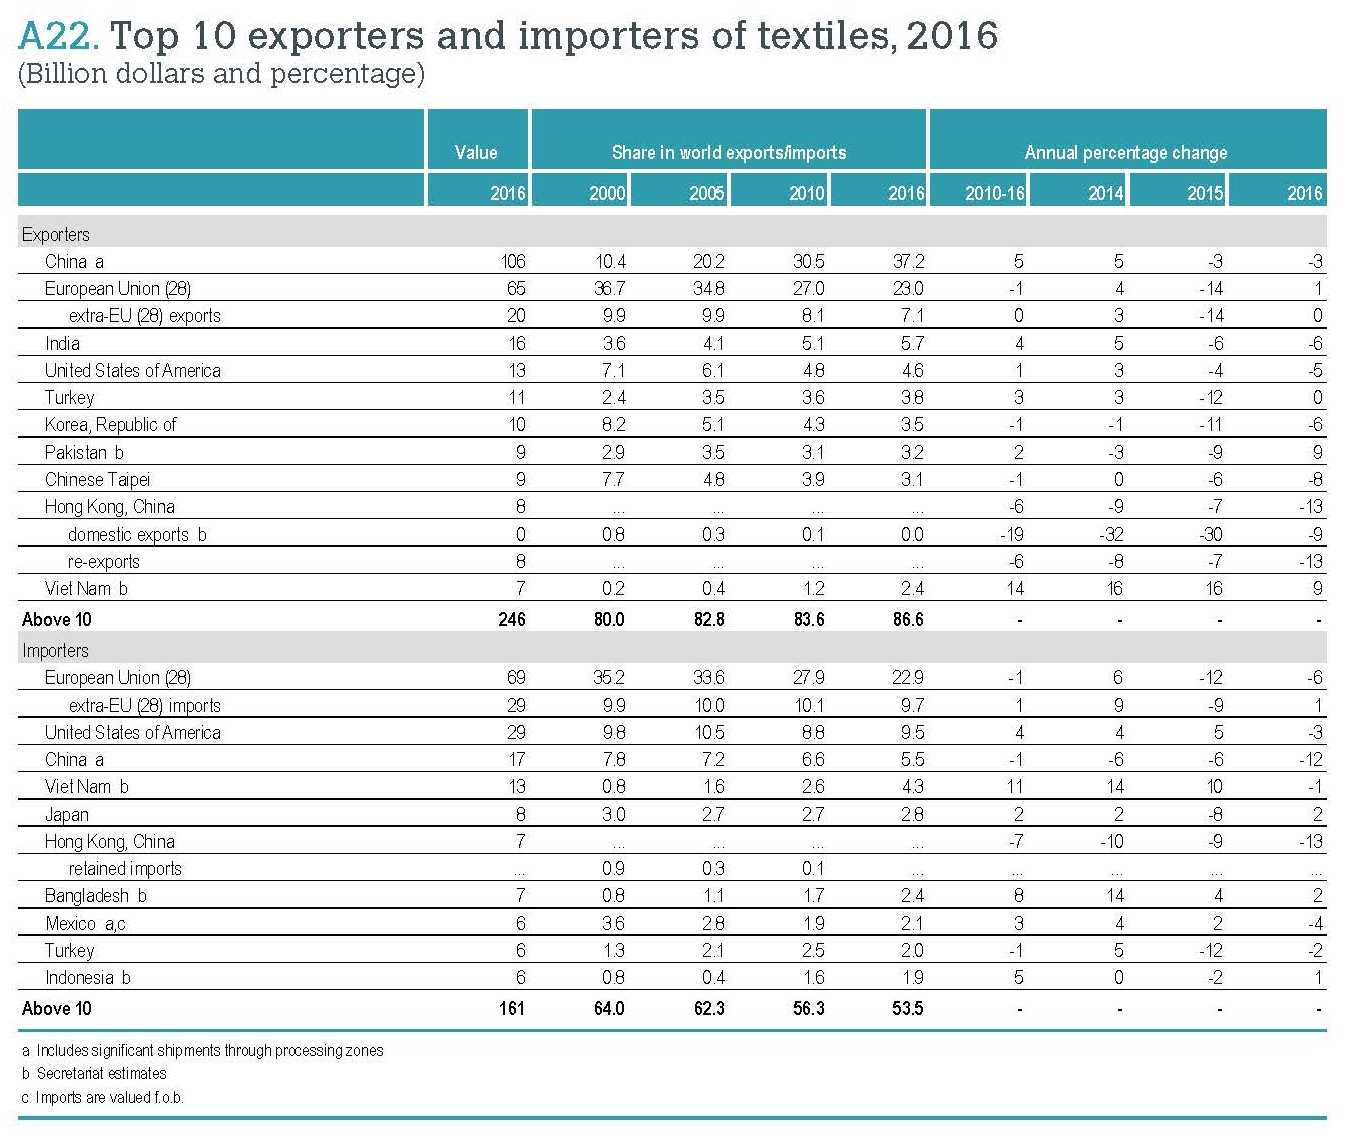
- The possible reaching of the Regional Comprehensive Economic Partnership (RCEP): Even though RCEP is less well-known than the Trans-Pacific Partnership (TPP), we should not ignore the potential impact of the agreement on the future landscape of textile and apparel supply chain in the Asia-Pacific region. One recent study of mine shows that the RCEP will lead to a more integrated textile and apparel supply chain among its members but make it even harder for non-RCEP members to get involved in the regional T&A supply chain in the Asia-Pacific. This conclusion is backed by the latest data from the World Trade Organization (WTO): In 2016, around 91 percent of Asian countries’ textile imports came from other Asian countries, up from 86 percent in 2006. The more efficient regional supply chain as a result of RCEP will further help improve the price competitiveness of apparel made by “factory Asia” in the world marketplace. Particularly in the past few years, textile and apparel exports from Asia have already posted substantial pressures on the operation of the textile and apparel regional supply chain in the Western Hemisphere.
- Automation of apparel manufacturing and its impact on the job market: Recall my observations at the MAGIC this August, several vendors showcased their latest technologies which have the potential to automate the cut and sew process entirely or substantially reduce the labor inputs in garment making. The impact of automation on the future of jobs is not a new topic, but the apparel industry presents a unique situation. Globally, over 120 million people remain directly employed in the textile and apparel industries today, a good proportion of whom are females living in poor rural areas. According to the World Trade Organization (WTO), for quite a few low-income and lower-middle income countries such as Bangladesh, Gambia, Pakistan, Madagascar, Sri Lanka, and Cambodia, as much as over 70 percent of their total merchandise exports were textile and apparel products in 2016. Should these labor-intensive garment sewing jobs in the developing countries were replaced by machines, the social and economic impacts will be consequential. I think it is the time to start thinking about the possible scenarios and the appropriate policy responses.