The World Trade Organization (WTO) recently released its 2025 World Trade Report, which explored the complex and fast-evolving relationship between artificial intelligence (AI) and international trade.
Below are the findings most relevant to the textiles and fashion apparel sector:
First, AI has the potential to boost global trade. However, the impact on different sectors varies. According to the report, AI is expected to significantly boost global trade by 34-37% between 2025 and 2040, with larger increases in digitally deliverable services (around 40% growth), followed by other services (around 30%). In comparison, the AI-driven growth of global trade in the manufacturing sector (22-24%) and the primary input sector (9.5-9.9%) will be much smaller.
Second, AI is helping to reduce trade costs through multiple channels. For example, as the report noted, AI can help reduce trade costs through “optimizing trade logistics, streamlining regulatory compliance and contract enforcement, reducing language barriers, enhancing international communication, and improving search and matching processes between suppliers and buyers.” As another example, the report noted that, “in retail, AI-supported scenario planning has helped firms to diversify suppliers and adjust sourcing calendars to align with changing tariff regimes.” All of these AI applications could be used in apparel sourcing and trade.
In a March 2025 survey conducted by the WTO and the International Chamber of Commerce (ICC) among firms currently using AI, 90 percent reported tangible benefits in trade-related activities, and 56 percent reported that AI enhanced their ability to manage trade risks. The survey also found that “Larger firms primarily use AI for compliance with trade regulations, contract analysis, and trade finance. Smaller firms, in contrast, tend to focus on market intelligence and improving communication.”
Third, AI’s impact on jobs seems to be complicated. For example, the report suggests that AI will have limited impacts on low-skilled apparel manufacturing jobs, but could replace middle-skilled and high-skilled jobs (such as those in apparel wholesaling and retailing). According to the report, “The task substitution from human labor to AI is more pronounced for medium-skilled and high-skilled occupations than for low-skilled ones.”
Meanwhile, the report categorized textiles and apparel manufacturing (ISIC code 13-15) as a “low” AI-intensity sector, and wholesale and retail (ISIC code 45-47) as “medium” AI-intensive. Nonetheless, the report estimates only a modest share of tasks to be replaced by AI—about 3% for low-skilled and 7–9% for medium- and high-skilled workers.
Fourth, the report calls for “deliberate efforts” by policymakers to broaden AI access and ensure the gains from AI will be evenly distributed globally. In other words, without targeted, proactive policymaking, AI could worsen global inequalities rather than reduce them.
For example, the report suggests that AI could act as an equalizer by increasing the productivity of medium- and low-skilled workers in developing economies. Combined with lower trade costs for cross-border services, these improvements could create more opportunities for companies and professionals in developing economies to engage more actively in global markets.
However, the report also warned that “AI may shift comparative advantages in ways that reinforce inequality.” Notably, “AI adoption is not uniform, as it tends to cluster in large, urban, digitally connected firms in high-income economies… AI technology favors capital- and data-intensive production, which could erode the competitiveness of economies that rely on low-skilled and low-cost labor.”
Additionally, the report noted that trade barriers remain an issue for international trade in the AI era. For example, AI-enabling goods are increasingly affected by technical barriers to trade (TBT). Also, AI-intensive services still face significant restrictions on trade as countries have only made modest commitments under the WTO’s General Agreement on Trade in Services (GATS). Furthermore, regulations on cross-border data flows are still largely fragmented. This explains why the WTO could still play a vital role in supporting AI development, from promoting open markets in AI-related goods and services, to supporting AI innovation and diffusion through intellectual property rights protection, and to encouraging greater regulatory consistency on trade-related aspects of AI.
Textile and apparel trade matters. Even today in the 21st century, apparel could still account for 80—90% of a developing country’s total merchandise export and play a critical role in promoting economic growth, poverty reduction, and gender equality. The interview explored several key topics:
Why textile & apparel trade matters for development in the 21st century
How ITC provides capacity building support and enhances the export competitiveness of garment exporters in developing countries
Sustainability movement’s impact on apparel sourcing and export competitiveness of developing countries
The promise and complexity of circularity in tackling used clothing challenges
Empowering women entrepreneurs through SheTrades
Skills and education needed to thrive in the global fashion apparel trade
About Matthias Knappe (speaker)
Matthias Knappe is the Head of Fibres, Textiles and Clothing Unit at the International Trade Centre (ITC), which is co-run by the World Trade Organization (WTO) and the United Nations (UN). Matthias has over 30 years of diversified professional experience in international trade and development. He has worked at the enterprise, institutional, and governmental levels. Matthias is leading ITC’s textile and apparel and light manufacturing unit. Over the last 20 years, he has been working with the T&C sector around the world to increase its export competitiveness. He designed and currently manages ITC’s Global Textiles and Clothing (GTEX) programme and various other fibre, apparel and light manufacturing projects. The Unit’s present portfolio includes projects in 15 countries.
AboutEmilie Delaye (moderator)
Emilie Delaye is a master’s student in Fashion and Apparel Studies at the University of Delaware, with a specific interest in supply chain, global sourcing, and sustainability. With a background in Entrepreneurship and Fashion Management, Emilie’s passion lies in improving the fashion industry through innovative problem-solving and collaboration. She has worked on projects exploring sourcing destinations and emerging sourcing trends, as well as collaborated with Macy’s on an initiative centered around Extended Producer Responsibility (EPR) regulations. Emilie’s work is driven by a commitment to fostering innovation and ethical practices in fashion, positioning her as a future leader in driving the industry toward greater sustainability and responsibility.
Instructions: In the next few weeks of FASH455, we will learn about many technical aspects of free trade agreements related to apparel sourcing and trade, such as the preferential tariff rates, apparel-specific rules of origin, and trade agreement utilization. However, this presentation takes a different perspective on trade deals– why they are NOT solely about job creation, why trade agreements increasingly focus on “measures behind borders,” and why international institutions like the World Trade Organization (WTO) were established.
Feel free to share your thoughts on the video. You may focus on 1-2 specific points that you find interesting, intriguing, controversial, or debatable and then explain your arguments. You could also propose additional discussion questions for your classmates.
Terminologies mentioned in the video and background notes:
Quota: A quantity restriction on imports. Before 2005, the global textile and apparel trade was subject to 30 years+ quota restrictions. See here for the background information.
Tariff: A tax levied on imports only. Deemed as “import-sensitive,” US still imposes a much higher tariff rate for textile (8.0%) and apparel products (11.6%) than other manufactured goods (2.2%) on average in 2023. See the World Tariff Profile 2023.
Non-tariff barriers (NTB): refers to trade barriers other than tariffs, such as technical barriers of trade (TBT), Sanitary and Phytosanitary (SPS) measures, customs procedures, import licensing, and many others. See more examples here.
GATT and WTO: The General Agreement on Tariffs and Trade (GATT) was a temporary international treaty signed in 1947 by 23 countries (including the United States). GATT aimed to boost trade-led economic recovery after World War II. Since then, GATT members conducted nine major rounds of negotiations to gradually reduce trade barriers, ultimately establishing the World Trade Organization (WTO) in 1995 as the permanent body governing world trade.
Trans-Pacific Partnership (TPP): A trade agreement reached by eleven countries in the Asia-Pacific region (Australia, Brunei, Canada, Chile, Japan, Malaysia, Mexico, New Zealand, Peru, Singapore, and Vietnam) and the United States in 2016. However, the Trump Administration announced the withdrawal of the United States from TPP in January 2017. Afterward, without the US, the other 11 TPP members reached the Comprehensive and Progressive Agreement for Trans-Pacific Partnership (CPTPP), which officially entered into force in December 2018.
Below are selected comments by US Trade Representative Katharine Tai (Tai) and WTO (World Trade Organization) Director-General Dr. Ngozi Okonjo-Iweala (Ngozi).
What kind of global trade do we want today?
“For decades, the United States has been proud to champion the international rules-based order and the multilateral trading system…But the functioning and fairness of this order are now in question and that is why all of us need to adapt to a more challenging era marked by rapid technological change, increasing extreme climate events, vulnerable supply chains, intensifying geopolitical friction, widening inequality” (Tai)
“The United States is writing a new story on trade. We are pursuing fair competition, addressing the climate crisis, promoting our national security, and ensuring the rules-based system helps all economies, not just the biggest ones.” (Tai)
“how can we harness the effectiveness of our trade tools to be promoting not just efficiency and liberalization, but using those tools to promote what we consider certainly today to be higher goals. And those goals are resilience for our economy and the word economy, sustainability, again, for our economy in the world economy, and inclusivity… we started to see where the concentrations in supply and production started to impact this and spike this economic insecurity on a macro level and also for individuals” (Tai)
Trade and climate change
“trade is necessary to disseminate green technologies and through competition and scale efficiencies to drive down the cost of decarbonization. Another reason is that trade amplifies the impact of environmental policy action. Recent research at the WTO demonstrate that just as countries can reap economic gains by focusing on what they are relatively good at, the world can reap environmental gainsif countries focus on what they are relatively green at” (Ngozi)
Is trade diversification the future?
“A fragmented world economy would not just be bad for already-squeezed household budgets. Without trade, it would become harder, even impossible, to meet the big challenges of our time – resilience, socioeconomic inclusion, and climate change… The problems we encountered in the trading system were less about trade per se and more about excessive concentration for some products and supply relationships. The smart response is to deepen, diverse, and deconcentrate production so there are fewer potential bottlenecks” (Ngozi)
“we believe we can solve the problem by diversifying the supply chains not just to ourselves or to friends but to all over the world where the opportunity exists. Business should look at the possibility of not just doing China+1. It means China plus Vietnam or Indonesia. But they can do Bangladesh. They can do Laos. They can do Rwanda. They can do Senegal. They can do Nigeria. I’m just – Morocco” (Ngozi)
Debate the impact of trade
“Technology was generally a big culprit in job losses…U.S. manufacturing output, the volume of products produced here, is about as high as it has ever been. But the sector employs more machines and fewer people than it used to. Nevertheless, import competition was a significant factor and an easier focus, I think, for political anger.” (Ngozi)
“…between 1995 and 2011, while increased goods import from China did eliminate 2 million jobs in the United States, increased exports to China and elsewhere added 6.6 million jobs to the U.S. economy, 4 million of them from higher-services exports…These numbers illustrate the power of trade for job creation. But as we know, those new jobs were not created in the same places. Neither did they go to the same people. That a backlash would result from those left out was perhaps predictable, but it was not inevitable. There are countries that use domestic-policy levers to translate gains from trade into broadly shared growth by providing people security against income loss and support to seize new opportunities.” (Ngozi)
Renew or update the African Growth and Opportunity Act?
“The world is really different from when AGOA was first created…So I think copy-paste is to really lose an important opportunity…we should be practical. Also, we’re on a timeline…The AfCFTA, the African Continental Free Trade Area, that has been concluded, that has that has been brought into being by the countries on the continent. And those continental integration aspirations should absolutely be reflected in our offer to Africa, and something we should try to figure out how to incorporate” (Tai)
“African countries appreciate AGOA. They would like to see an agreement that is, you know, at least a decade out so that they have some predictability. What they’re hearing from investors is that with this up in the air, they can’t make up their minds whether to invest or not because they don’t know what will happen. So I think if we can reform and get it done, and people can have a predictable time horizon for AGOA, it would really help” (Ngozi)
How to reform the World Trade Organization?
“The United States wants a WTO where dispute settlement is fair and effective, and supports a healthy balance of sovereignty, democracy, and economic integration where all members embrace transparency, where we have better rules and tools to tackle non-market policies and practices, and to confront the climate crisis and other pressing issues.” (Tai)
“We must recognize the diversity of developing members. We should have flexibilities in the rules that reflect actual needs. But we cannot have economic and manufacturing powerhouses gaming the system by claiming the same development status and flexibilities intended for less-advantaged members.” (Tai)
“people ask me all the time, oh, are you worried because there are so many [Free trade agreement, FTA]? I’m not. Like I said, 75 percent of trade still goes on WTO terms [MFN tariff rates]. And we can learn from them.” (Ngozi)
“I don’t have enough time and money to waste resources in Geneva on a process that we don’t actually believe in…When President Biden talks about it from the floor of the United Nations General Assembly, if we still have trading partners who want to question our seriousness, then I think the problem is those partners and it’s not us” (Tai) [note: this comment was mentioned by Politico]
This article comprehensively reviewed the world textiles and clothing trade patterns in 2022 based on the newly released World Trade Organization Statistical Review 2023 and data from the United Nations (UNComtrade). Affected by the slowing world economy and fashion companies’ evolving sourcing strategies in response to the rising geopolitical tensions, mainly linked to China, the world’s textiles and clothing trade in 2022 displayed several notable patterns different from the past.
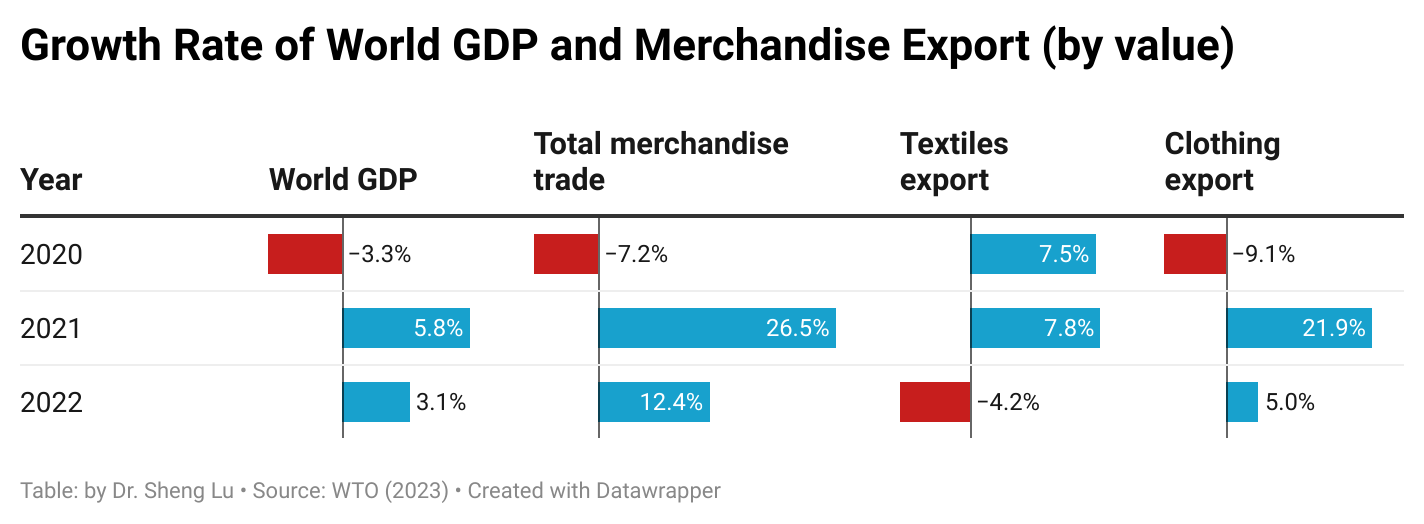
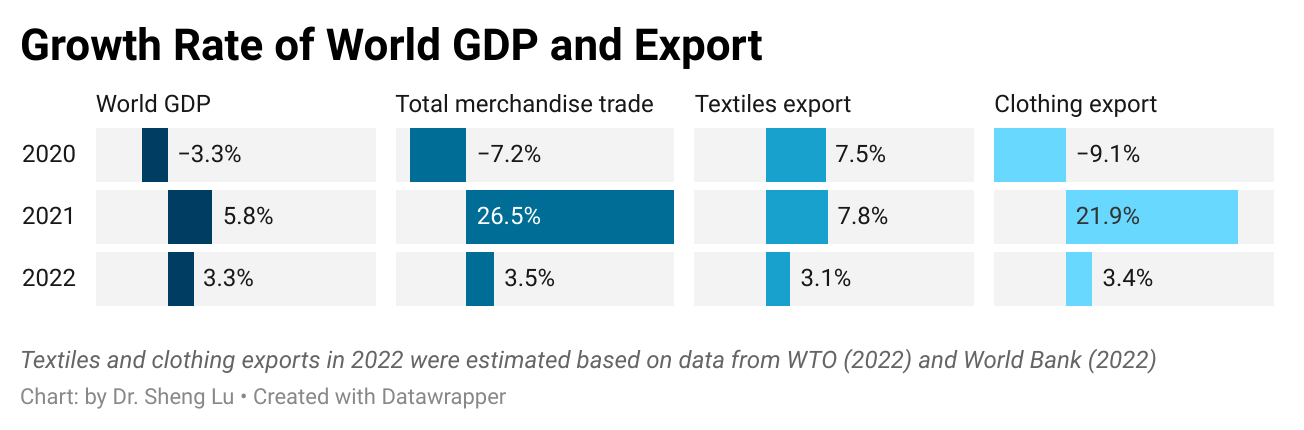
Pattern #1: The expansion of world clothing exports witnessed a notable deceleration in 2022, primarily attributed to the economic downturn. Meanwhile, the world’s textile exports decreased from the previous year, affected by the reduced demand for textile raw materials used to produce personal protective equipment (PPE) as the pandemic waned.
The world’sclothing exports totaled $576 billion in 2022, up 5 percent year over year, much slower than the remarkable 20 percent growth in 2021. The slowed economic growth plus the unprecedented high inflation in major apparel import markets, particularly the United States and Western European countries, adversely affected consumers’ available budget for discretionary expenditures, including clothing purchases.
The world’s textile exports fell by 4.2 percent in 2022, totaling $339 billion, lagging behind most industrial sectors. Such a pattern was understandable as the demand for PPE and related textile raw materials substantially decreased with the pandemic nearing its end.
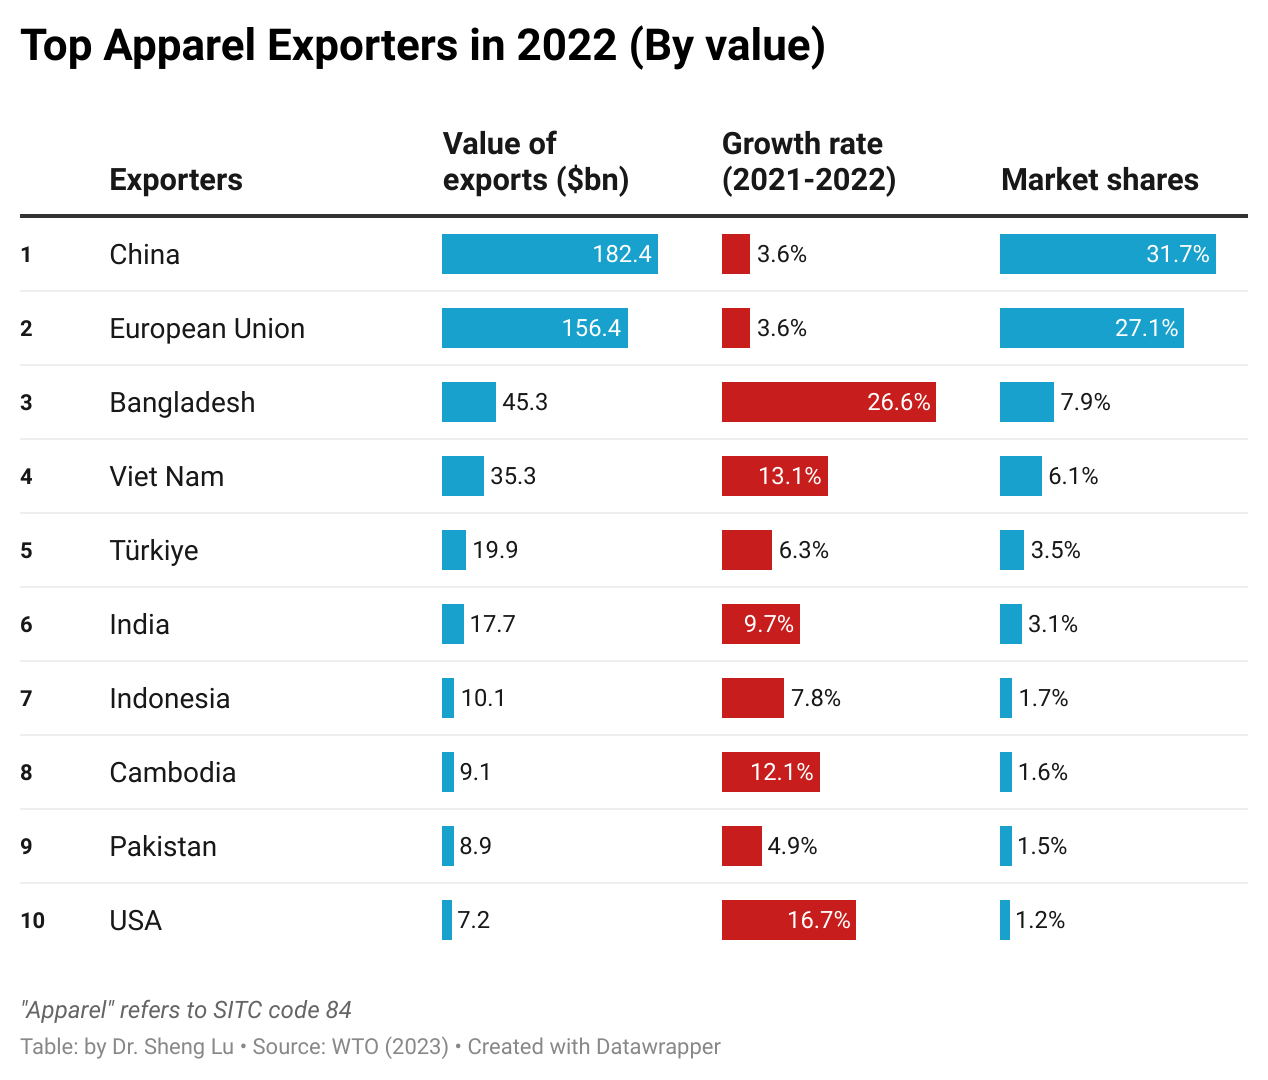
Pattern #2: China continued to lose market share in clothing exports, which benefited other leading apparel exporters in Asia. Notably, for the first time, Bangladesh surpassed Vietnam and ranked as the world’s second-largest apparel exporter in 2022.
In value, China remained the world’s largest apparel exporter in 2022. However, China’s clothing exports experienced a growth of 3.6 percent, below the global average of 5.0 percent, positioning China at the bottom of the top ten exporters.
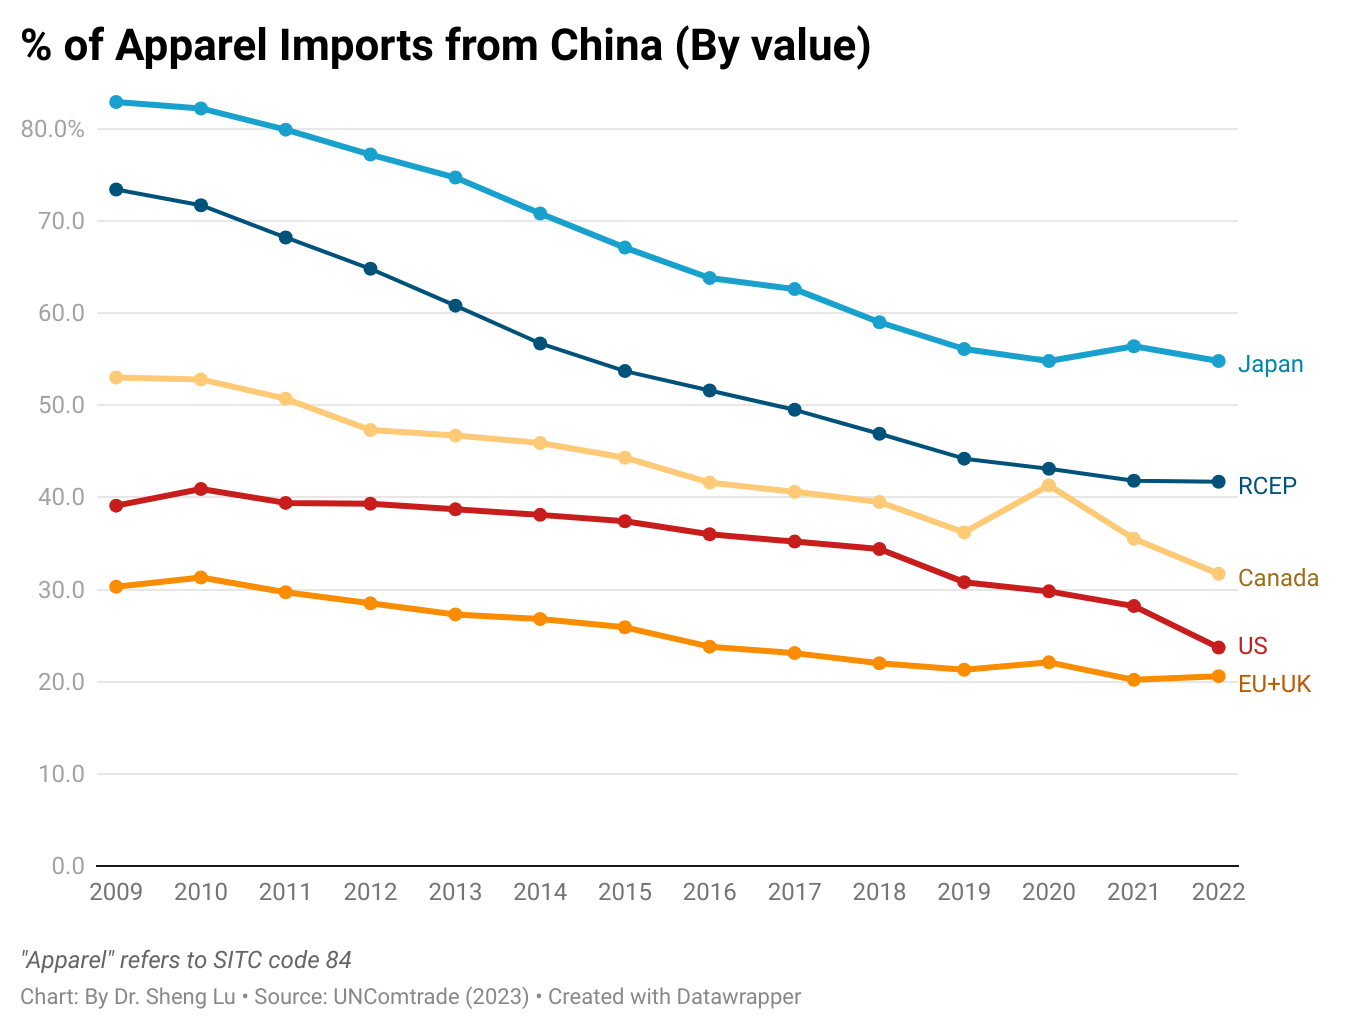
China’s global market share in clothing exports dropped to 31.7 percent in 2022, marking its lowest point since the pandemic and a significant decrease from the approximate 38 percent recorded from 2015 to 2018. In fact, China lost market share in almost all major clothing import markets, including the US, the EU, Canada, and Japan. The concerns about the risks of forced labor linked to sourcing from China and the deteriorating US-China relations were among the primary factors driving fashion companies’ eagerness to reduce their ‘China exposure” further.
China has been diversifying its clothing exports beyond the traditional Western markets in response to the challenging business environment. For example, from 2021 to 2022, Asian countries, especially members of the Regional Comprehensive Economic Partnership (RCEP), became relatively more important clothing export markets for China. Nevertheless, since RCEP members primarily consist of developing economies with ambitions to enhance their own clothing production, the long-term growth prospects for their import demand of ‘Made in China’ clothing remain uncertain.
Bangladesh achieved a new record high in its market share of world clothing exports, reaching 7.9 percent in 2022, which exceeded Vietnam’s 6.1 percent. Many fashion companies regard Bangladesh as a promising clothing-sourcing destination with growth potential because of its capability to make cotton garments as China’s alternatives, competitive price, and reduced social compliance risks.
Fashion companies’ efforts to “de-risking from China” also resulted in the robust growth of clothing exports from other large-scale Asian clothing producers in 2022, including Vietnam (up 13 percent), Cambodia (up 12 percent), and India (up 10 percent). In other words, despite the concerns about China, fashion companies still treat Asia as their primary sourcing destination.
Pattern #3: Developed countries stay critical textile exporters, and middle-income developing countries gradually build new textile production and export capability.
The European Union members and the United States stayed critical textile exporters, accounting for 25.1 percent of the world’s textile exports in 2022, up from 24.5 percent in 2021 and 23.2 percent in 2020. Thanks to the increasing demand from apparel producers in the Western Hemisphere, U.S. textile exports increased by 5 percent in 2022, the highest among the world’s top ten.
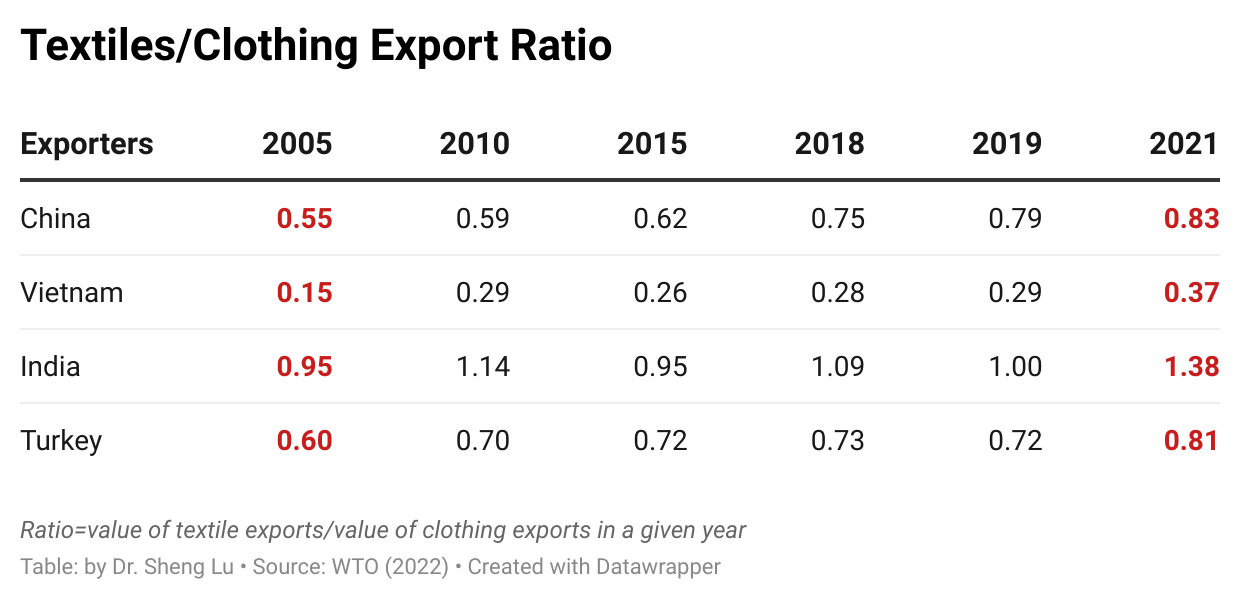
As a persistent long-term trend, middle-income developing countries have consistently been strengthening their textile production and export capability. For example, China, Vietnam, Turkey, and India’s market shares in the world’s textile exports have steadily risen. They collectively accounted for 56.8 percent of the world’s clothing exports in 2022, a notable increase from only 40 percent in 2010. Also, over time, these middle-income developing countries have achieved a more balanced textiles-to-clothing export ratio.
Pattern #4: Regional textile and apparel trade patterns strengthened further with the growing popularity of near-shoring, particularly in the Western Hemisphere. However, an early indication has emerged that Asian countries are diversifying their sources of textile raw materials away from China to mitigate growing risks.
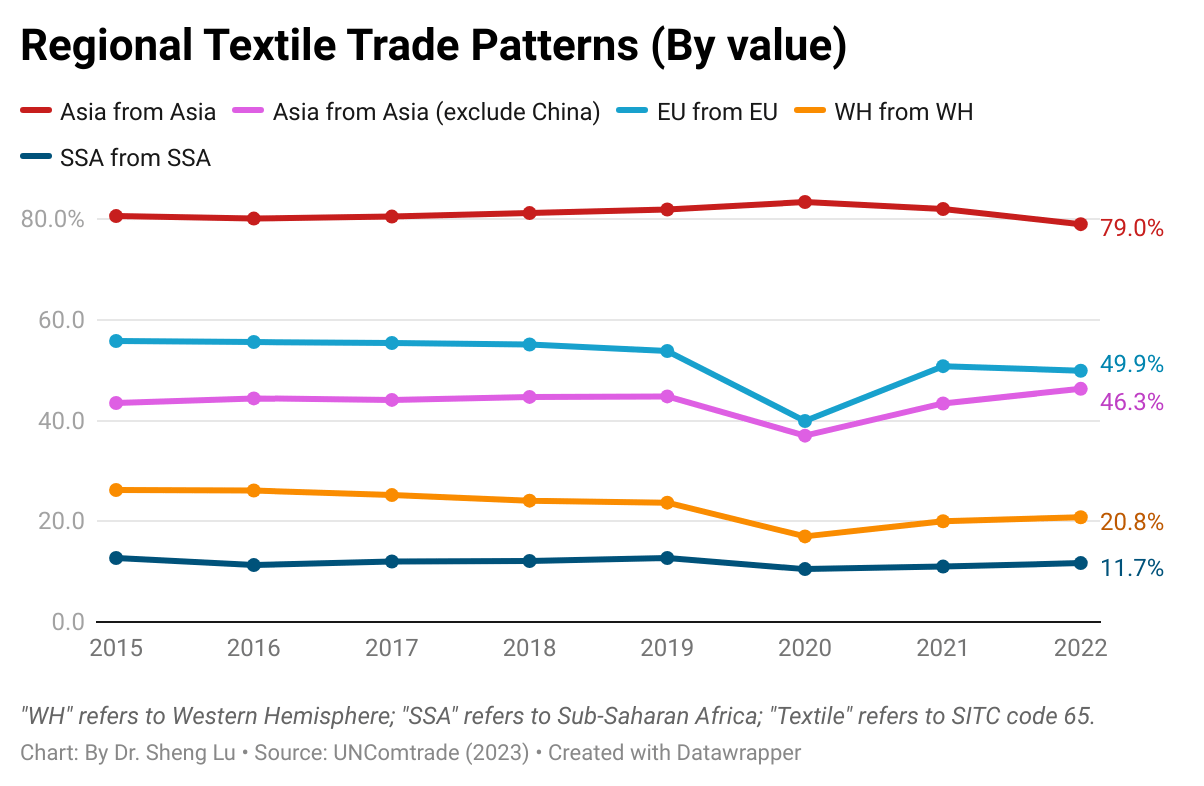
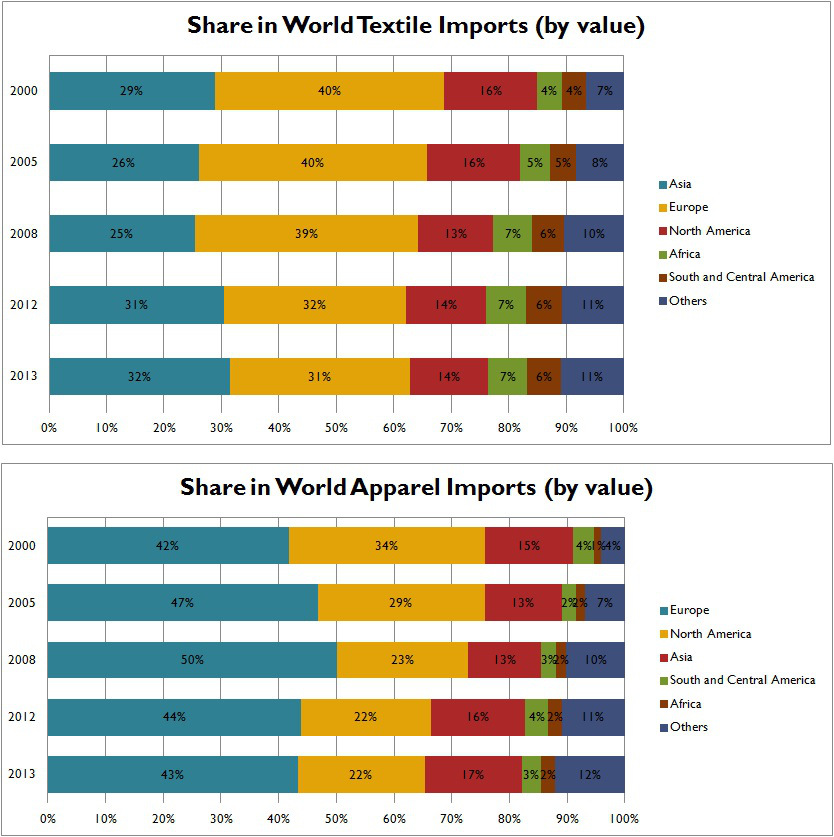
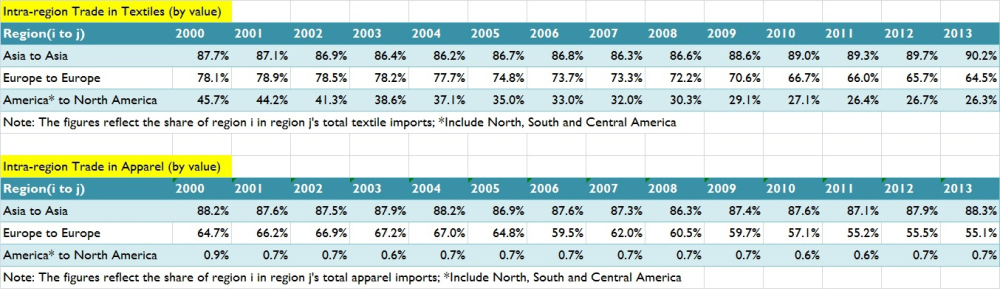
The regional textile and apparel supply chains were in good shape in Asia and Europe. For example, nearly 80 percent of Asian countries’ textile input and apparel imports came from within the region in 2022. Likewise, approximately half of EU countries’ textile imports were intra-region trade in 2022, and one-third were for apparel.
The Western Hemisphere (WH) textile and apparel supply chain became more integrated in 2022 thanks to the booming near-shoring trends. For example, 20.8 percent of WH countries’ textile imports came from within the region in 2022, up from 20.1 percent in the previous year. Likewise, about 15.1 percent of WH countries’ apparel imports came from within the region in 2022, higher than 14.7 percent in 2021 and 13.9 percent in 2022.
Compared with Asia and the EU, SSA clothing producers used much fewer locally-made textiles (i.e., stagnant at around 11% from 2011 to 2022), reflecting the region’s lack of textile manufacturing capability. A more comprehensive examination of strategies for bolstering the textile manufacturing sector in Sub-Saharan Africa, particularly in light of the recently enacted African Continental Free Trade Area (AfCFTA) agreement, might be warranted.
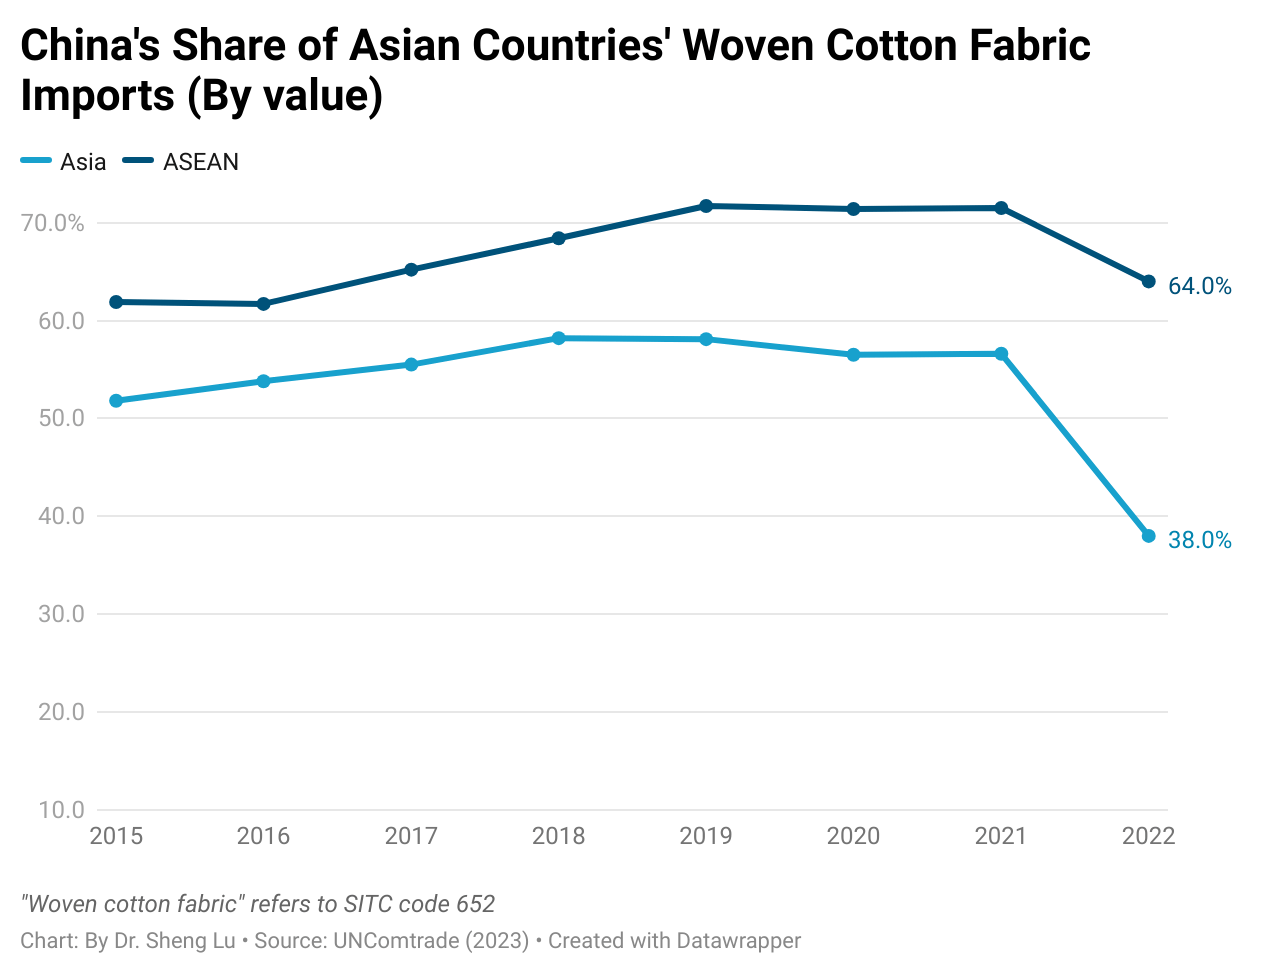
Additionally, data suggests that Asian countries began diversifying their textile imports away from China to mitigate supply chain risks. For example, with the official implementation of anti-forced labor legislation in the US and other primary apparel import markets directly targeting cotton made in China’s Xinjiang region, Asian countries significantly reduced their cotton fabric imports (SITC code 652) from China in 2022. Instead, Asian countries other than China accounted for 46.3 percent of the region’s textile supply in 2022, up from around 42-43 percent between 2019 and 2021.
It is critical to watch how willing, to what extent, and how quickly Asian countries can effectively reduce their dependency on textile supplies from China. The result is also an important reminder that Western fashion companies’ de-risking from China could exert significant and broad impacts across the entire supply chain beyond finished goods.
This article provided a comprehensive review of the world textiles and clothing trade patterns in 2021 based on the newly released data from the World Trade Statistical Review 2022 and the United Nations (UNComtrade). Affected by the ongoing pandemic and companies’ evolving production and sourcing strategies in response to the shifting business environment, the world textiles and clothing trade patterns in 2021 included both continuities and new trends. Specifically:
Pattern #1: As the world economy recovered from COVID, the world clothing export boomed in 2021, while the world textile exports grew much slower due to a high trade volume the year before. Specifically, thanks to consumers’ strong demand, world clothing exports in 2021 fully bounced back to the pre-COVID level and exceeded $548.8bn, a substantial increase of 21.9% from 2020. The apparel sector is not alone. With economic activities mostly resumed, the world merchandise trade in 2021 also jumped 26.5% from a year ago, the fastest growth in decades.
In comparison, the value of world textiles exports grew slower at 7.8% in 2021 (i.e., reached $354.2bn), lagging behind most sectors. However, such a pattern was understandable as the textile trade maintained a high level in 2020, driven by high demand for personal protective equipment (PPE) during the pandemic.
Nevertheless, the world textiles and clothing trade could face strong headwinds down the road due to a slowing world economy and consumers’ weakened demand. Notably, amid hiking inflation, high energy costs, and retrenchment of global supply chains, leading international economic agencies, from the World Bank to the International Monetary Fund (IMF), unanimously predict a slowing economy worldwide. Likewise, the World Trade Organization (WTO) forecasts that the growth of world merchandise trade will be cut to 3.5% in 2022 and down further to only 1% in 2023. As a result, the world textiles and clothing trade will likely struggle with stagnant growth or a modest decline over the next two years.
Pattern #2: COVID did NOT fundamentally shift the competitive landscape of textile exports but affected the export product structure. Meanwhile, some long-term structural changes in world textile exports continued in 2021.
Specifically, China, the European Union (EU), and India remained the world’s three largest textile exporters in 2021, a pattern that has stayed stable for over a decade. Together, these top three accounted for 68% of the world’s textile exports in 2021, similar to 66.9% before the pandemic (2018-2019). Other textile exporters that made it to the top ten list in 2021 were also the same as a year ago and before the pandemic (2018-2019).
Meanwhile, the growth rate of the top ten textile exporters varied significantly in 2021, ranging from -5.5% (China) to 47.8% (India). The demand shift from PPE to apparel-related yarns and fabrics was a critical contributing factor behind the phenomenon. For example, China’s PPE-related textile exports decreased by more than $33bn (or down 43%) in 2021. In contrast, the world knit fabric exports (SITC code 655) surged by more than 30% in 2021, led by India (up 74%) and Pakistan (up 72%). Nevertheless, as consumers’ lifestyles almost reached a “new normal,” we could expect the textile export product structure to stabilize soon.
On the other hand, as a trend already emerged before the pandemic, middle-income developing countries continued to play a more significant role in textile exports, whereas developed countries lost market shares. For example, the United States, Germany, and Italy led the world’s textile exports in the 2000s, accounting for more than 20% of the market shares. However, these three countries’ shares fell to 12.8% in 2019 and hit a new low of 11.3% in 2021. In comparison, middle-income developing countries like China, Vietnam, Turkey, and India have entered the development stage of expanding textile manufacturing. As a result, their market share in the world’s textile exports rose steadily. These countries also achieved a more balanced textiles/clothing export ratio over the years, meaning more textile raw materials like yarns and fabrics can be locally produced instead of relying on imports. For example, Vietnam, known for its competitive clothing products, achieved a new high of $11.5bn in textile exports in 2021 and ranked sixth globally. Vietnam’s textiles/clothing ratio also doubled from 0.15 in 2005 to 0.37 in 2021. It is not unlikely that Vietnam’s textile exports may surpass the United States over the next few years.
Pattern #3: Countries with large-scale production capacity stood out in world clothing exports in 2021. Meanwhile, clothing exporters compete to become China’s alternatives, but there seems to be no clear winner yet.
Consumers’ surging demand and COVID-related supply chain disruptions significantly impacted the world’s clothing export patterns in 2021. As fashion brands and retailers were eager to find sourcing capacity, countries with large-scale production capacity and relatively stable supply enjoyed the fastest growth in clothing exports. For example, except for Vietnam, which suffered several months of COVID lockdowns, all other top five clothing exporters enjoyed a more than 20% growth of their exports in 2021, such as China (up 24%), Bangladesh (up 30%), Turkey (up 22%), and India (up 24%).
As another critical trend, many international fashion brands and retailers have been trying to reduce their apparel sourcing from China, driven by various economic and non-economic factors, from cost considerations and trade tensions to geopolitics. Notably, despite its strong performance in 2021, China accounted for only 23.1% of US apparel imports in 2022 (January to September), much lower than 36.2% in 2015. Likewise, China’s market shares in the EU, Japanese, and Canadian clothing import markets also fell over the same period, suggesting this was a worldwide phenomenon.
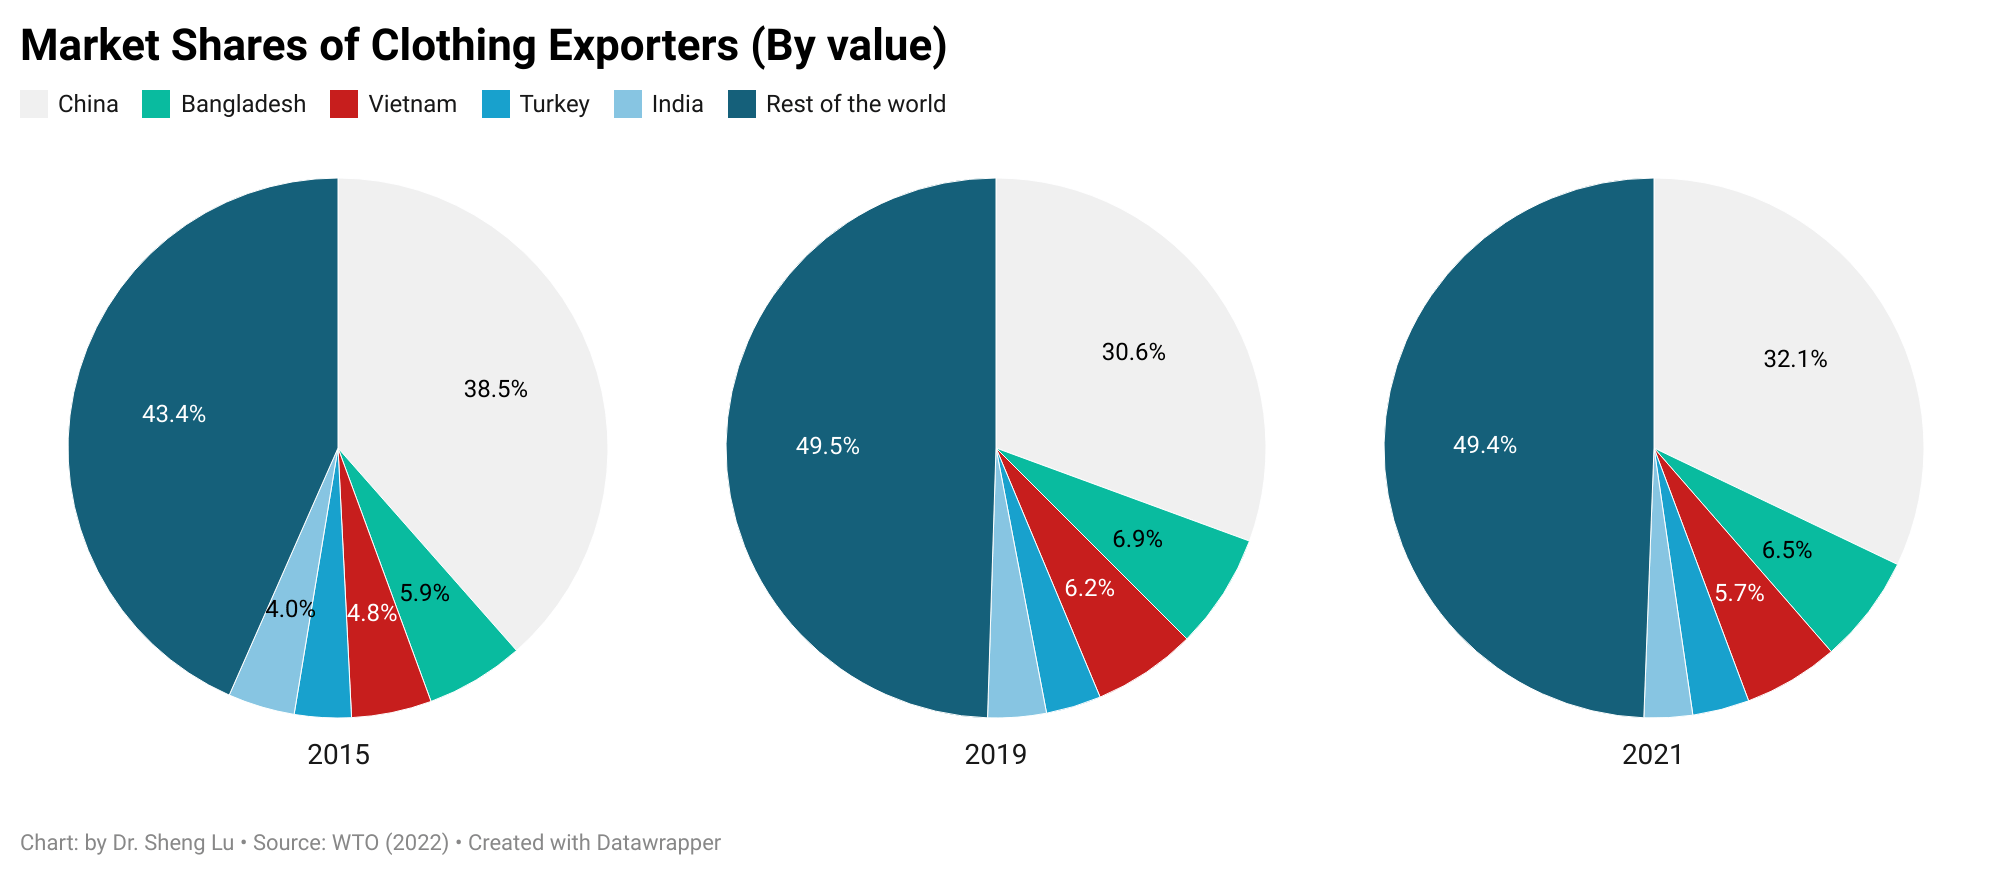
With reduced apparel sourcing from China, fashion companies have actively sought alternative sourcing destinations, but the latest trade data suggests no clear winner yet. For example, Vietnam and Bangladesh, the two most popular candidates for “Next China,” accounted for 6.5% and 5.7% shares in the world’s clothing export in 2021, still far behind China (32.1%). Interestingly, from 2015 to 2021, the world’s top four largest clothing exporters next to China (i.e., Bangladesh, Vietnam, Turkey, and India) did not substantially gain new market shares. Instead, China’s lost market was filled by “the rest of the world.”
Additionally, recent studies show that many fashion companies have switched back to the sourcing diversification strategy in 2022 as managing risks and improving sourcing flexibility become more urgent priorities. In other words, the world’s clothing export market could turn more “crowded” and competitive in the coming years.
Pattern #4: Regional supply chains remain critical features of the world textiles and clothing trade. Several factors support and shape the regional textiles and clothing trade patterns. First, as clothing production often needs to be close to where textile materials are available, many developing clothing-producing countries rely heavily on imported textile materials, primarily from more advanced economies in the same region. Second, through lowered trade barriers, regional free trade agreements also financially encouraged garment producers, particularly in Asia, the EU, and Western Hemisphere (WH), to use locally or regionally made textile materials. Further, fashion companies’ interest in “near-shoring” supported the regional supply chain, and related textiles and clothing trade flows between neighboring countries.
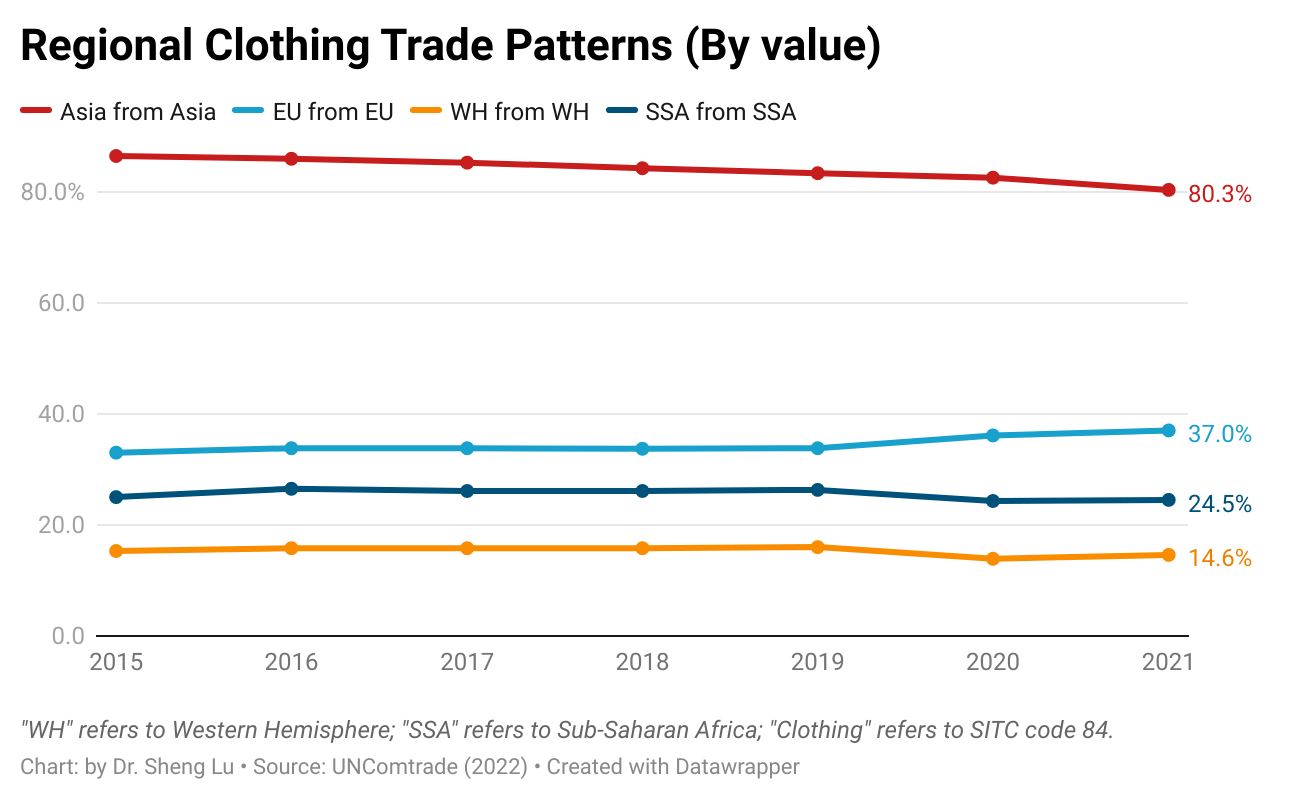
The latest trade data indicated that Asia’s regional textiles and clothing trade patterns strengthened further despite supply chain chaos during the pandemic. Specifically, in 2021, as many as 82% of Asian countries’ textile imports came from within Asia, up from 80% in 2015. China, in particular, has played a more prominent role as a leading textile supplier for other Asian clothing-exporting countries. For example, more than 60% of Vietnam’s textile imports came from China in 2021, a substantial increase from 23% in 2005. The same pattern applied to Pakistan, Cambodia, Bangladesh, and the Association of Southeast Asian Nations (ASEAN) members.
In January 2022, the Regional Comprehensive Economic Partnership (RCEP), a mega free trade agreement involving all major economies in Asia, entered into force. The tariff cut and very liberal rules of origin of the agreement will hopefully drive Asia’s booming regional textiles and clothing trade and further deepen its regional economic integration.
Besides Asia, the regional textiles and clothing trade pattern in the EU (or the so-called Intra-EU trade) was also in good shape. In 2021, 50.8% of EU countries’ textile imports and 37% of clothing imports came from other EU members. This pattern has changed little over the past decade, thanks to many EU countries’ commitment to maintaining local textiles and clothing production rather than outsourcing.
In comparison, the Western Hemisphere (WH) textile and apparel supply chain (e.g., clothing made in Mexico or Central America using US or regionally made textiles) seemed to struggle in recent years. As of 2021, only 20% of WH countries’ textile imports came from within WH, down from 26% in 2015. Likewise, WH countries (mainly the US and Canada) just imported 14.6% of clothing from WH in 2021, down from 15.3% in 2015 and much lower than their EU counterparts (37% in 2021). It will be interesting to see whether US and Canadian fashion companies’ expressed interest in expanding near-shoring may reverse the course.
Furthermore, the regional textiles and clothing trade patterns in Sub-Saharan Africa (SSA) are also worth watching. Compared with Asia and the EU, SSA clothing producers used much fewer locally-made textiles (i.e., stagnant at around 11% only from 2011 to 2021), reflecting the region’s lack of textile manufacturing capability. Most trade programs with SSA countries, such as the US-led African Growth and Opportunity Act (AGOA) and EU’s Everything But Arms (EBA) program, adopt liberal rules of origin for clothing products, allowing third-party textile input to be used. It can be studied whether such liberal rules of origin somehow disincentivize building SSA’s own textile manufacturing sector or are still essential given the reality of SSA’s limited textile production capacity.
Patrick Fox, Senior Director, Customs and Trade Strategy, VF Corporation
Cen Williams, Hub Leader for Africa and Middle East region, PVH
Greg Poole, Chief Sourcing Officer, The Children’s Place
Background:
Trade preference programs provide duty-free US market access to selected exports of eligible developing countries. Unlike free trade agreements, all preference programs are unilateral, meaning they do not require reciprocal trade concessions.
There are five major trade preference programs enacted in the United States, including:
Generalized System of Preferences (GSP), which applies to developing countries as a whole. However, the US GSP program excludes most textile and apparel products due to import competition concerns. GSP expired on December 31, 2020 and Congress is working with stakeholders to renew the program.
Four trade preference programs that target specific regions, including the Andean Trade Preference Act (APTA), the Caribbean Basin Economic Recovery Act (CBERA), the Caribbean Basin Trade Partnership Act (CBTPA), the African Growth and Opportunity Act (AGOA), and the Haitian Opportunity through Partnership Encouragement (HOPE) Act. In 2021, about 2% of US apparel imports came from trade preference partners.
US trade preferences reflect both economic development and foreign policy goals. In addition to the economic benefits, eligibility criteria create incentives for beneficiary countries to support objectives such as adopting and enforcing internationally recognized worker rights, reducing barriers to investment, and enforcing intellectual property rights.
However, the trade preference program is not without controversies. For example, it is debatable whether the trade preference program effectively enhances the genuine export competitiveness of developing countries. Also, despite preferential duty benefits, US fashion companies often hesitate to source more from trade preference partners due to concerns about a lack of critical infrastructure, limited production capacity, and political instability.
According to the World Trade Statistical Review 2021 report released by the World Trade Organization (WTO), the textiles and apparel trade patterns in 2020 include both continuities and new trends affected by the pandemic and companies’ evolving production and sourcing strategies in response to the shifting business environment.
Pattern #1: COVID-19 significantly affected the world textile and apparel trade volumes, resulting in substantial growth of textile exports and a declined demand for apparel.
Driven by increased personal protective equipment (PPE) production, global textile exports grew by 16.1% in 2020, reaching $353bn. In comparison, affected by lockdown measures, worsened economy, and consumers’ tighter budget for discretionary spending, global apparel export decreased by nearly 9% in 2020, totaling $448bn, the worst performance in decades. The apparel sector is not alone. The world merchandise trade in 2020 also suffered an unprecedented 8% drop from a year ago, with COVID-19 to blame.
Notably, as economic activities returned in the second half of 2020, the world clothing export quickly rebounded to around 95% of the pre-covid level by the end of 2020. That being said, the unexpected resurgence of COVID cases in summer 2021, especially the delta variant, caused new market uncertainties. Overall, the world textile and apparel trade recovery process from COVID-19 will differ from our experiences during the 2008 global financial crisis.
Pattern #2: COVID-19 did NOT shift the competitive landscape of the world textile exports; Meanwhile, textile exports from China and Vietnam gained new momentum during the pandemic.
China, the European Union (EU), and India remained the world’s three largest textile exporters in 2020. Together, these top three accounted for 65.8% of the world’s textile exports in 2020, similar to 66.9% before the pandemic (2018-2019).
Notably, China and Vietnam enjoyed a substantial increase in their textile exports in 2020, up 28.9% and 10.7% from a year ago, respectively. The complete textile and apparel supply chain and considerable production capability allow these two countries to switch clothing production to PPE manufacturing quickly. In particular, Vietnamexceeded South Korea and ranked the world’s sixth-largest textile exporter in 2020 ($10 bn of exports), the first time in history.
The United States dropped one place and ranked the world’s fifth-largest textile exporter in 2020 (was 4th from 2015 to 2019), accounting for 3.2% of the shares (was 4.4% in 2019). Production disruptions at the beginning of the pandemic and the shift toward PPE production for domestic consumption were the two primary contributing factors behind the decline in U.S. textile exports. Due to the regional trade patterns, around 67% of U.S. textile exports went to the Western Hemisphere in 2020, including 46% for members of the U.S.-Mexico-Canada Trade Agreement (USMCA) and another 17.2% for members of the Dominican Republic-Central America Free Trade Agreement (CAFTA-DR).
Pattern #3: Fashion companies’ efforts to diversify apparel sourcing from China somehow slowed during the pandemic.
China, the European Union, Vietnam, and Bangladesh unshakably remained the world’s four largest apparel exporters in 2020. Altogether, these top four accounted for 72.2% of the world market shares in 2020, higher than 71.4% in 2019.
Notably, while China steadily accounted for declining shares in the world’s total apparel exports since 2015, its market shares rebounded to 31.6% in 2020 from 30.7% in 2019. We can observe a similar pattern in Canada (up from 36.2% to 41.2%) and the EU (31.2% to 31.3%), two of the world’s leading apparel import markets. Even in the U.S. market, where Chinese goods face adverse impacts of the tariff war, the market shares of “Made in China” only marginally decreased from 30.8% in 2019 to 29.8% in 2020, compared with a more significant drop before the pandemic (i.e., fell from 34.4% 2018 to 30.8% in 2019).
Several factors could explain the resilience of China’s apparel exports: 1) fashion brands and retailers’ particular sourcing criteria match China’s competitiveness during the pandemic (e.g., flexibility, agility, and total landed sourcing cost). 2) China has one of the world’s most complete textile and apparel supply chains, allowing garment factories to access textile raw material and accessories locally. 3) Compared with many other apparel exporting countries, China suffered a shorter COVID lockdown period and resumed apparel production earlier and more quickly. Most Chinese textile and apparel factories started to reopen in April 2020, and they resumed an overall 90%-95% operational capacity rate by July 2020.
Nonetheless, fashion companies are NOT reversing their long-term strategies to reduce “China exposure” for apparel sourcing. On the contrary, non-economic factors, particularly the concerns about forced labor in China’s Xinjiang region, push most western fashion brands and retailers to develop apparel sourcing capacities beyond China. Meanwhile, no single country has yet and will likely become the “Next China” because of capacity limits. Instead, from 2015 to 2020, China’s lost market shares in the world apparel exports (around 7.8 percentage points) were picked up jointly by its competitors in Asia, including ASEAN members (up 4.4 percentage points), Bangladesh (up 1.3 percentage points), and Pakistan (up 0.3 percentage point). Such a trend is most likely to continue in the post-COVID world.
Pattern #4: Developed economies led textile PPE imports during the pandemic, whereas the developing countries imported fewer textiles as their apparel exports dropped.
On the one hand, the value of textile imports by developed economies, including EU members, the United States, Japan, and Canada, surged by more than 30 percent in 2020, driven mainly by their demand for PPE. The result also reveals the significant contribution of international trade in supporting the supply and distribution of textile PPE globally. On the other hand, the developing countries engaged in apparel production and export drove the import demand for textile raw materials like yarns and fabrics. However, most of these developing countries’ textile imports fell in 2020, corresponding to their decreased apparel exports during the pandemic.
Pattern #5: Despite COVID-19, the world apparel import market continues to diversify. The import demand increasingly comes from emerging economies with a booming middle class.
Affected by consumers’ purchasing power (often measured by GDP per capita) and the size of the population, the European Union, the United States, and Japan remained the world’s three largest apparel importers in 2020, a stable pattern that has lasted for decades. While these top three still absorbed 56.2% of the world’s apparel imports in 2020, it was a new record low in the past ten years (was 58.1% in 2019 and 61.5% in 2018), and much lower than 84% back in 2005.
Behind the numbers, it is not the case that consumers in the EU, the United States, and Japan necessarily purchase less clothing over the years. Instead, several emerging economies have become fast-growing apparel-consuming markets with robust import demand. For example, despite COVID-19, China’s apparel imports totaled $9.5bn in 2020, up 6.5% from 2019. From 2010 to 2020, China’s apparel imports enjoyed a nearly 15% annual growth, compared with only 0.56% of the traditional top three. Around 30% of China’s apparel imports today are luxury items made in the EU.
First, the volume of world textiles and apparel trade reduced in 2019 due to weakened demand and the negative impacts of trade tensions. According to the WTO, the value of the world textiles (SITC 65) and apparel (SITC 84) exports totaled $305bn and $492bn in 2019, respectively, decreased by 2.4% and 0.4% from a year ago. The world merchandise trade also fell by nearly 3% measured by value and 0.1% measured by volume 2018-2019, in contrast with a positive 2.8% growth 2017-2018. Put these numbers in context, the year 2019 was the first time that world merchandise trade fell since the 2008 global financial crisis, and the decline happened even before the pandemic. As noted by the WTO, the economic slowdown and the escalating trade tensions, particularly the tariff war between the United States and China, were among the major contributing factors for the contraction of trade flows.
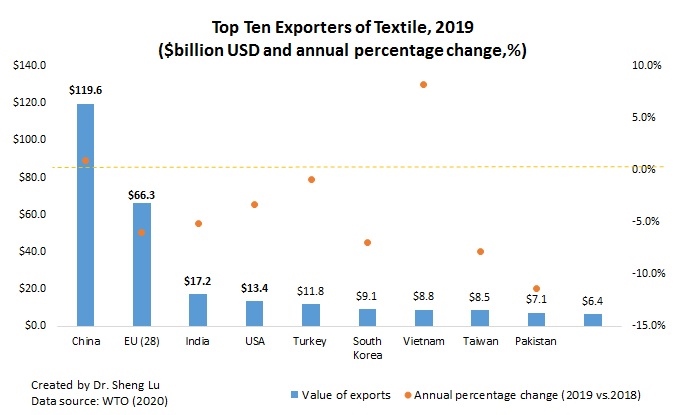
Second, the pattern of world textile exports overall stays stable in 2019; Meanwhile, China and Vietnam continue to gain momentum. China, European Union (EU28), and India remained the world’s top three exporters of textiles in 2019. Altogether, these top three accounted for 66.9% of the value of world textile exports in 2019, almost no change from two years ago. Notably, despite the headwinds, China and Vietnam stilled enjoy the positive growth of their textile exports in 2019, up 0.9%, and 8.3%, respectively. In particular, Vietnam exceeded Taiwan and ranked the world’s seventh-largest textile exporter in 2019 ($8.8bn of exports, up 8.3% from a year earlier), the first time in history. The change also reflects Vietnam’s efforts to continuously upgrade its textile and apparel industry and strengthen the local textile production capacity are paying off.
Third, the pattern of world apparel exports reflects fashion companies’ shifting strategies to reduce sourcing from China. China, the European Union (EU28), Bangladesh, and Vietnam unshakably remained the world’s top four exporters of apparel in 2019. Altogether, these top four accounted for as much as 71.4% of world market shares in 2019, which, however, was lower than 74% from 2016 to 2018—primarily due to China’s reduced market shares.
China is exporting less apparel and more textiles to the world. Notably, China’s market shares in world apparel exports fell from its peak of 38.8% in 2014 to a record low of 30.8% in 2019 (was 31.3% in 2018). Meanwhile, China accounted for 39.2% of world textile exports in 2019, which was a new record high. It is important to recognize that China is playing an increasingly critical role as a textile supplier for many apparel-exporting countries in Asia.
On the other hand, even though apparel exports from Vietnam (up 7.7%) and Bangladesh (up 2.1%) enjoyed fast growth in absolute terms in 2019, their gains in market shares were quite limited (i.e., no change for Vietnam and marginally up 0.3 percentage point from 6.8% to 6.5% for Bangladesh). This result indicates that due to capacity limits, no single country has yet emerged to become the “Next China.” Instead, China’s lost market shares in apparel exports were fulfilled by a group of Asian countries altogether.
Fourth, associated with the shifting pattern of world apparel production, the world textile import is increasingly driven by apparel-exporting countries in the developing world. Notably, 2019 marks the first time that Vietnam emerged to become one of the world’s top three largest importers of textiles, primarily due to its expanded apparel production and heavy dependence on imported textile raw materials. In comparison, although the US and the EU remain the world’s top two largest textile importers, their total market shares had declined from nearly 40% in 2010 to only 31.2% in 2019, the lowest in the past ten years. Furthermore, both the US and the EU have been importing more finished textile products (such as home furnishings and carpets) as well as highly specialized technical textiles, rather than conventional yarns and fabrics for apparel production purposes. The weakening import demand for intermediary textile raw materials also suggests that reshoring (i.e., making apparel locally rather than sourcing from overseas) has NOT become a mainstream industry practice in the developed economies like the US and the EU.
Fifth, the world apparel import market is becoming ever more diversified as import demand is increasingly coming from emerging economies with a booming middle class. Affected by consumers’ purchasing power (often measured by GDP per capita) and size of the population, the European Union (EU28), US, and Japan remained the world’s top three importers of apparel in 2019. This pattern has lasted for decades. Altogether, these top three absorbed 58.1% of world apparel in 2019, which, however, was a new historic low (was 84% back in 2005). Behind the numbers, it is not the case that consumers in the EU, US, and Japan are necessarily purchasing less clothing. Instead, several emerging economies are becoming fast-growing apparel consumption markets and starting to import more. For example, China’s apparel imports totaled $8.9bn in 2019, up 8.1% from a year earlier. From 2010 to 2019, China’s apparel imports enjoyed a nearly 15% annual growth, compared with only 1.9% of the traditional top three.
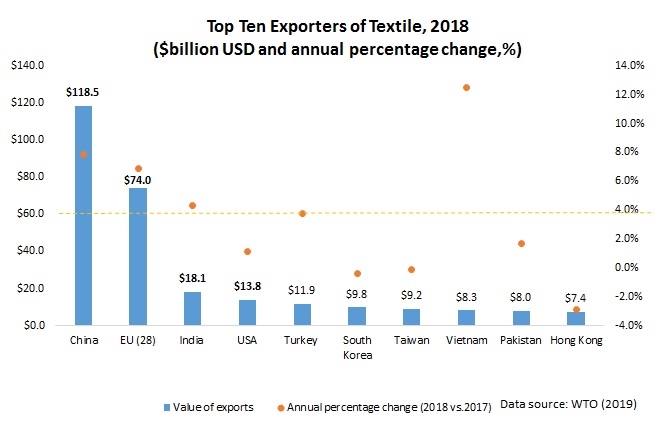
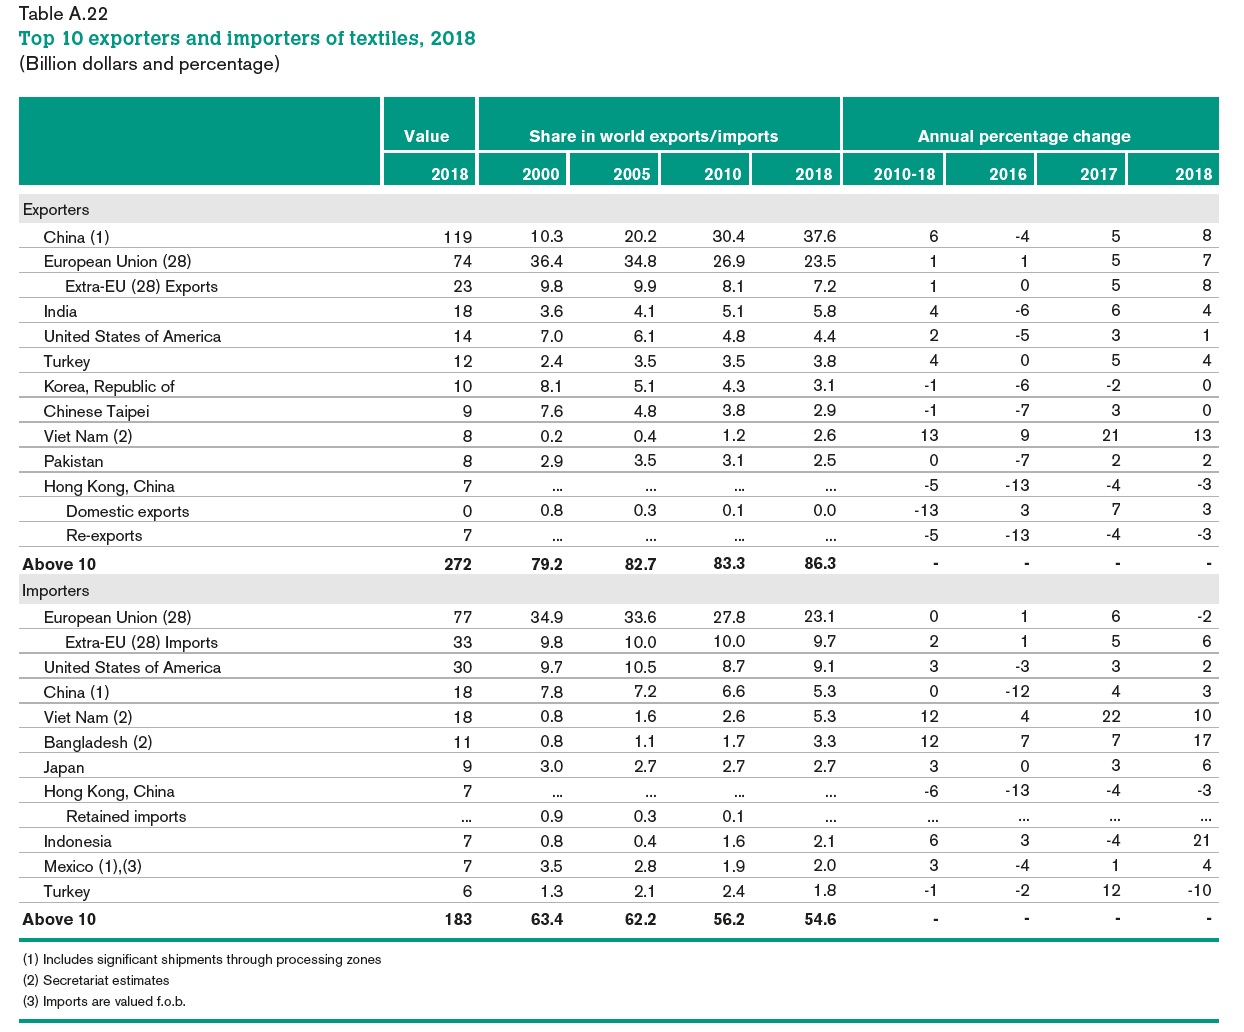
According to the World Trade Statistical Review 2019 newly released by the World Trade Organization (WTO), the current dollar value of world textiles (SITC 65) and apparel (SITC 84) exports totaled $315 billion and $505 billion in 2018 respectively, increased by 6.4% and 11.1% from a year earlier. This has been the fastest growth of world textile and apparel trade since 2012. Specifically:
I. Textile export
China, European Union (EU28), and India remained the world’s top three exporters of textiles in 2018. Altogether, these top three accounted for 66.9% of world textile exports in 2018, a new record high since 2011. Notably, China and EU (28) also enjoyed a faster-than-world-average export growth in 2018, up 7.9% and 6.9% respectively. The United States remained the world’s fourth top textile exporter in 2018, accounting for 4.4% of the shares, down slightly from 4.6% in 2017.
II. Apparel export
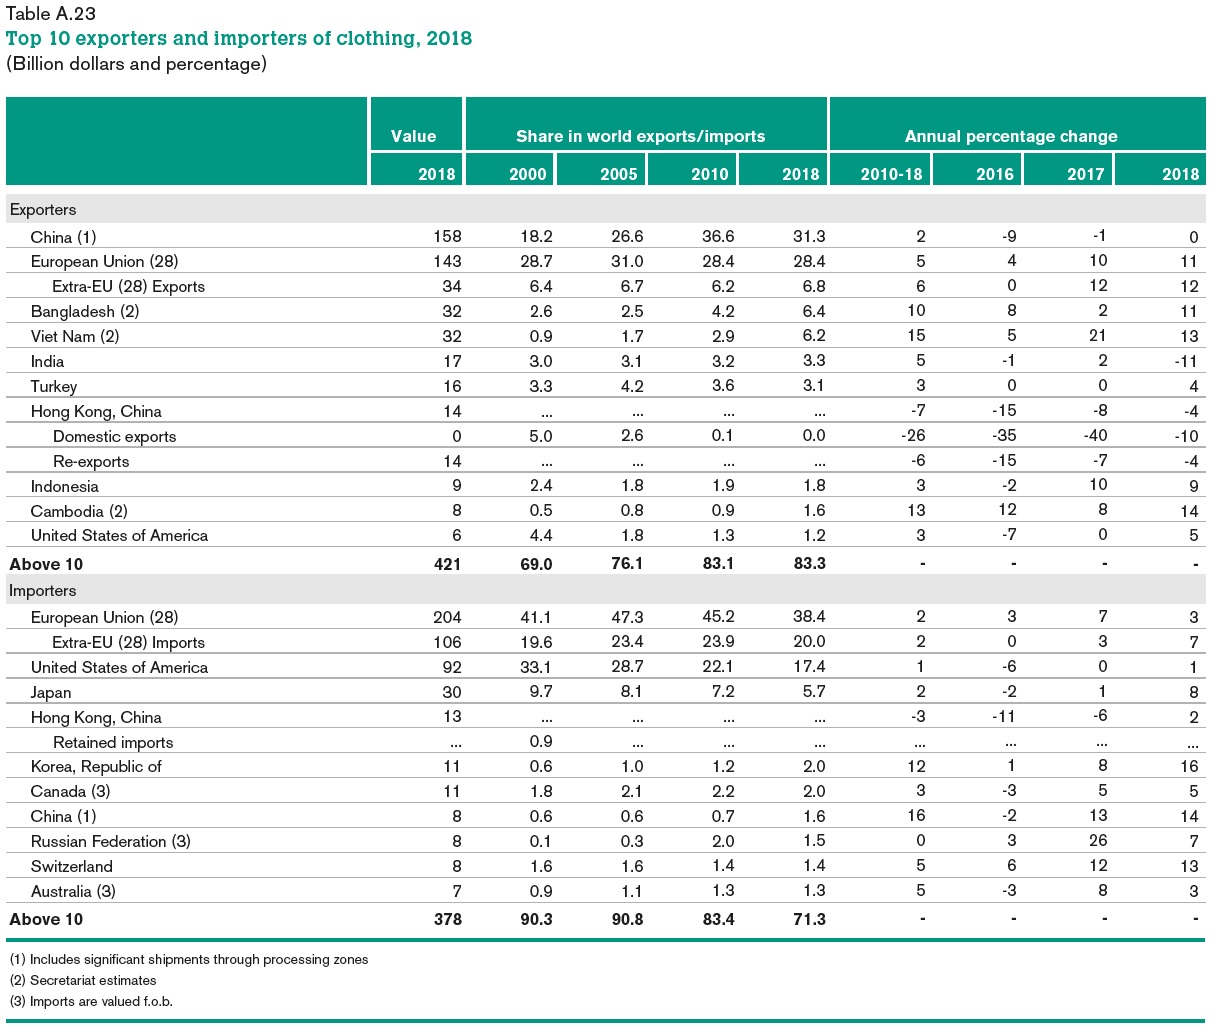
China, the European Union (EU28), Bangladesh, and Vietnam unshakably remained the world’s top four largest exporters in 2018. Altogether, these top four accounted for as much as 72.3% of world market shares in 2018, which, however, was lower than 75.8% in 2017 and 74.3% in 2016—primarily due to China’s declining market shares. Notably, even though apparel exports from Vietnam (up 13.4%) and Bangladesh (up 11.1%) enjoyed a fast growth in absolute terms in 2018, their gains in market shares were quite limited (up 0.3 percentage point from 5.9% to 6.2% for Vietnam and up 0.1 percentage point from 6.4% to 6.5% for Bangladesh). This result once again suggests that due to capacity limits, no single country has emerged to become the “Next China.” Instead, China’s lost market shares in apparel exports were fulfilled by a group of countries, a phenomenon which can be linked with fashion brands and retailers’ sourcing diversification strategy.
III. Textile import
The European Union (EU28), the United States, and China were the top three largest importers of textiles in 2018, accounting for 37.5% of the world’s total textile imports that year. Although the market shares of the top three in 2018 were close to 37.7% a year earlier, it nevertheless was much lower than over 50% back in the 2000s. The increasing diversification of textile import market is associated with the shifting pattern of world apparel manufacturing and export closely.
IV. Apparel import
Affected by consumers’ purchasing power (often measured by GDP per capita) and size of the population, the European Union, the United States, and Japan remained the world’s top three importers of apparel in 2018. Altogether, these top three absorbed 61.5% of world apparel in 2018, which, however, was lower than 62.3% in 2017 and a significant drop from 84% back in 2005. Behind the result, it is not the case that consumers in the EU, U.S., and Japan are importing less clothing. Instead, several emerging economies (such as China) are becoming fast-growing apparel consumption markets and starting to import more. As consumers’ purchasing power in these emerging economies continues to improve, we could expect a more diversified world apparel import market in the years ahead.
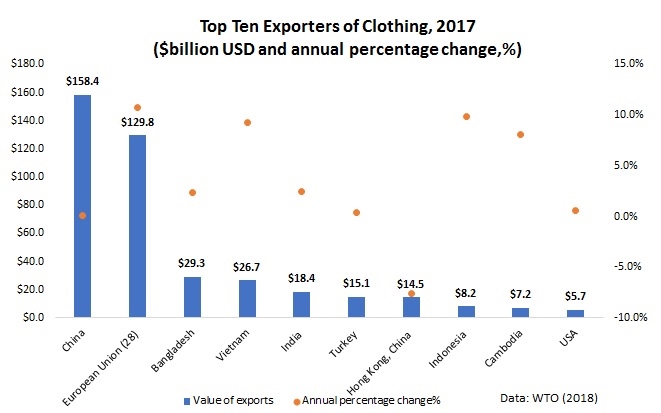
According to the newly released World Trade Statistical Review 2018 by the World Trade Organization (WTO), the current dollar value of world textiles (SITC 65) and apparel (SITC 84) exports totaled $296.1bn and $454.5bn respectively in 2017, increased by 4.2% and 2.8% from a year earlier. This is the first time since 2015 that the value of world textile and apparel exports enjoyed a growth.
Textiles and apparel are not alone. Driven by rising demand for imports globally, the current dollar value of world merchandise exports also grew by 4.7% in 2017–its most robust growth in six years, to reach $17.43 trillion. Particularly, the ratio of trade growth to GDP growth finally returned to its historic average of 1.5, compared to the much lower 1.0 ratio recorded in the years following the 2008 financial crisis.
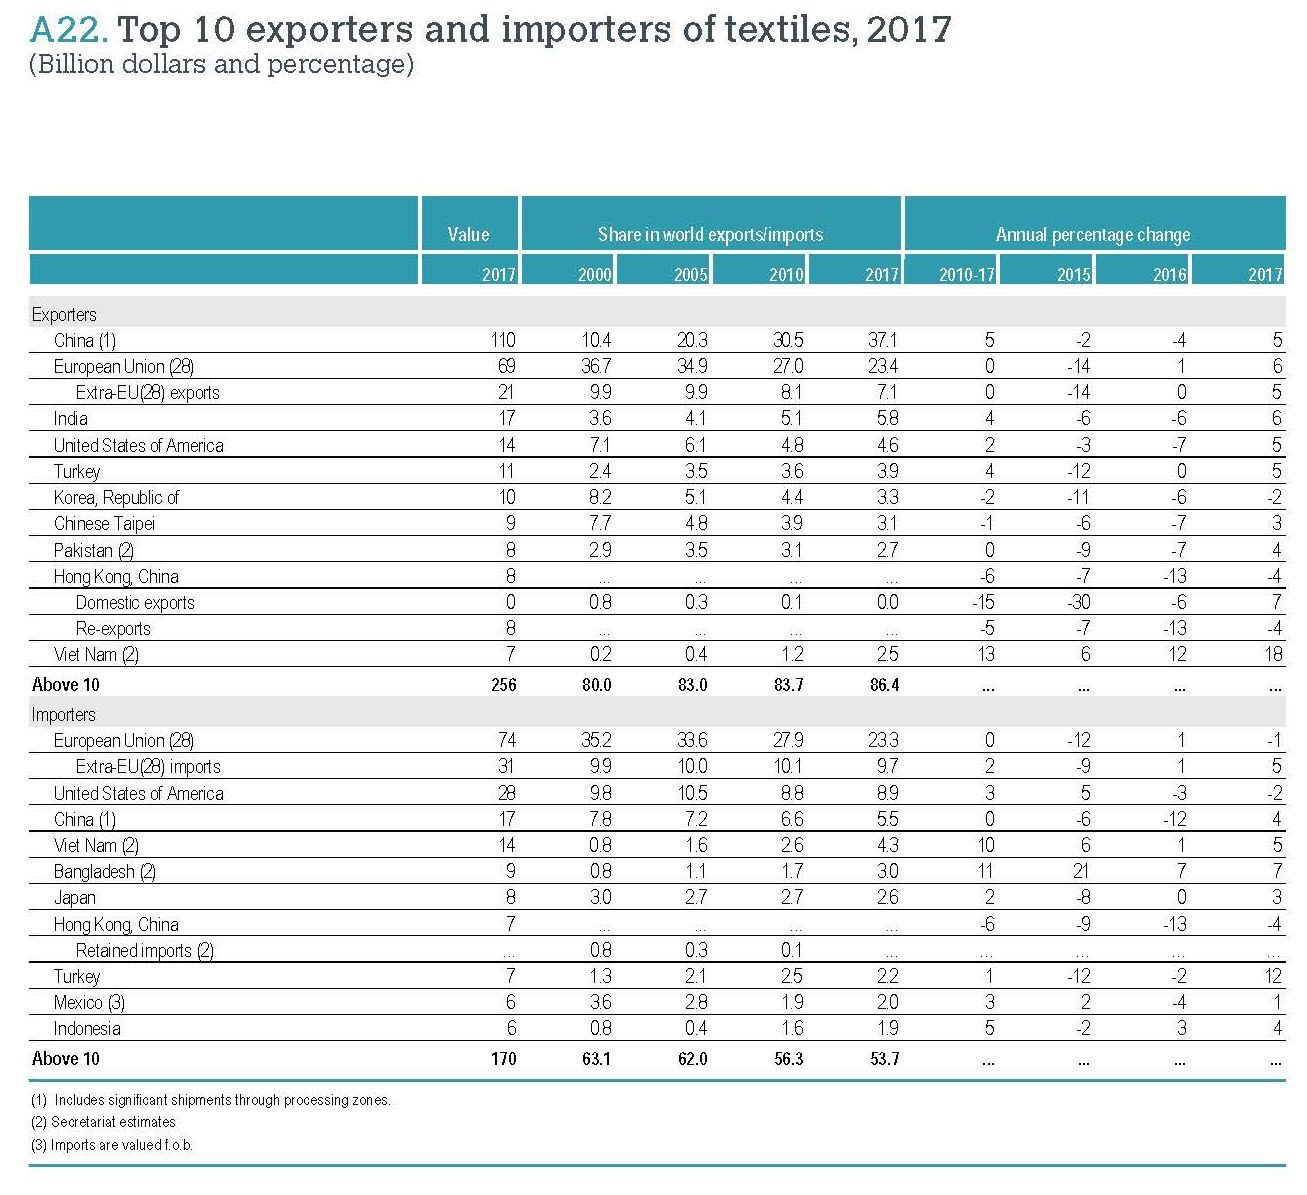
China, European Union (EU28), and India remained the world’s top three exporters of textiles in 2017. Altogether, these top three accounted for 66.3% of world textile exports in 2017, up from 65.9% in 2016. All the top three also enjoyed a faster-than-average export growth in 2017, including 5.0% of China, 5.8% of EU(28) and 5.9% of India. The United States remained the world’s fourth top textile exporter in 2017, accounting for 4.6 percent of the shares, the same as a year earlier.
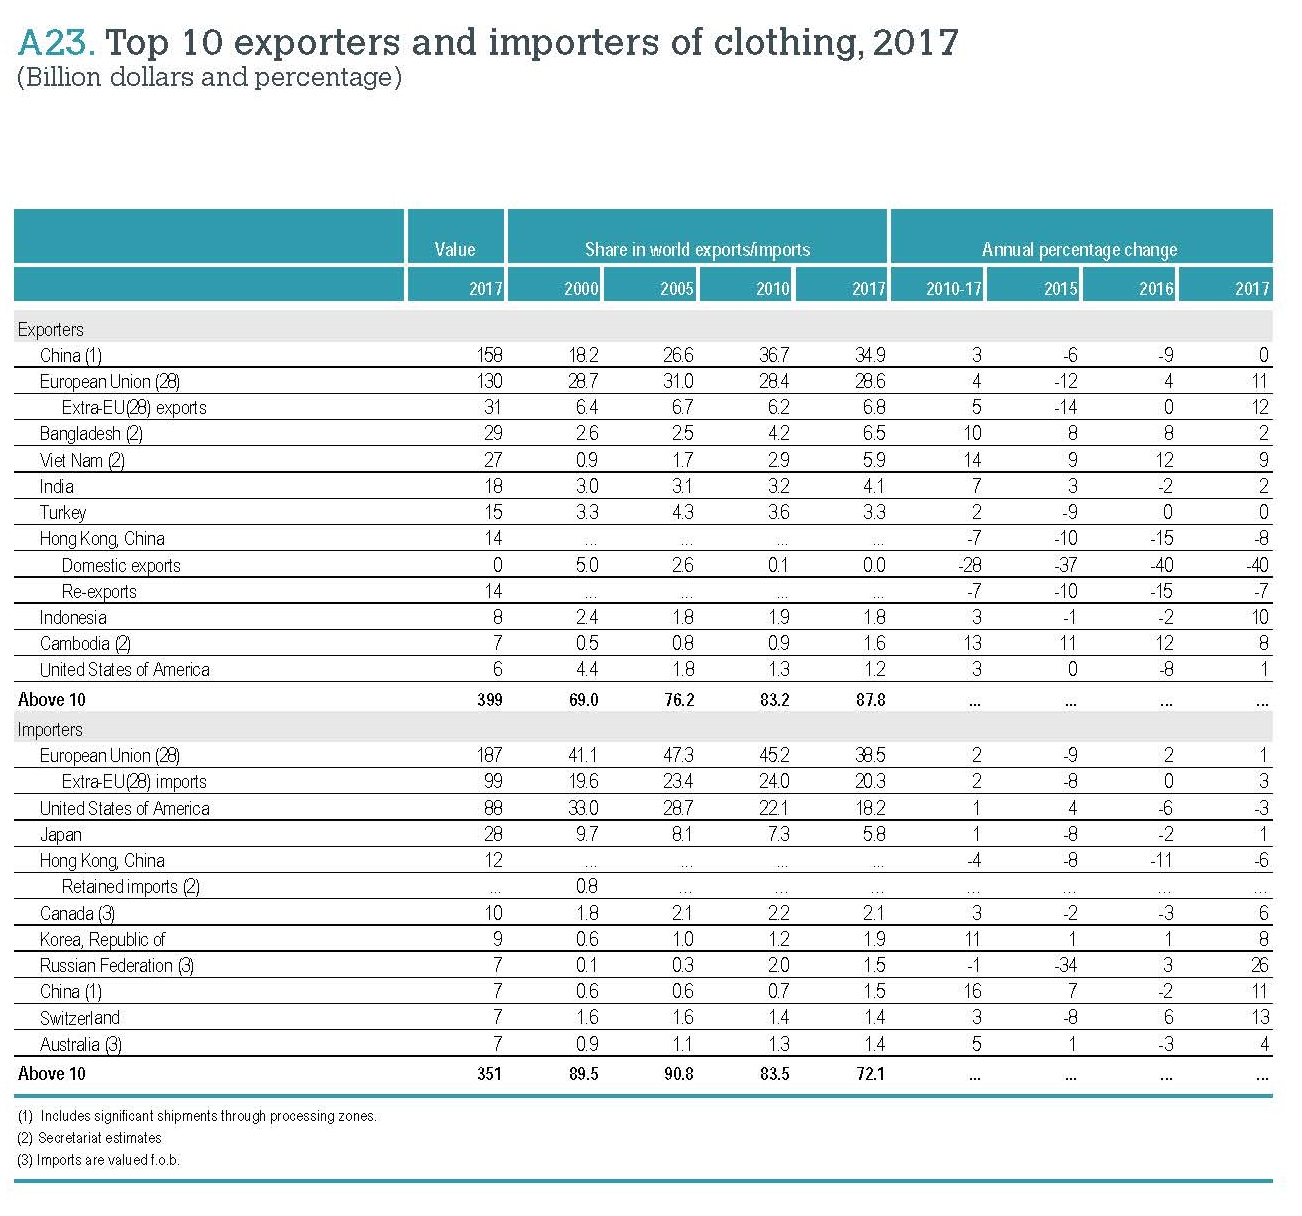
Regarding apparel, China, the European Union (EU28), Bangladesh and Vietnam unshakably remained the world’s top four largest exporters in 2017. Altogether, these top four accounted for as much as 75.8% of world market shares in 2017, which was higher than 74.3% a year earlier and a substantial increase from 68.3% back in 2007.
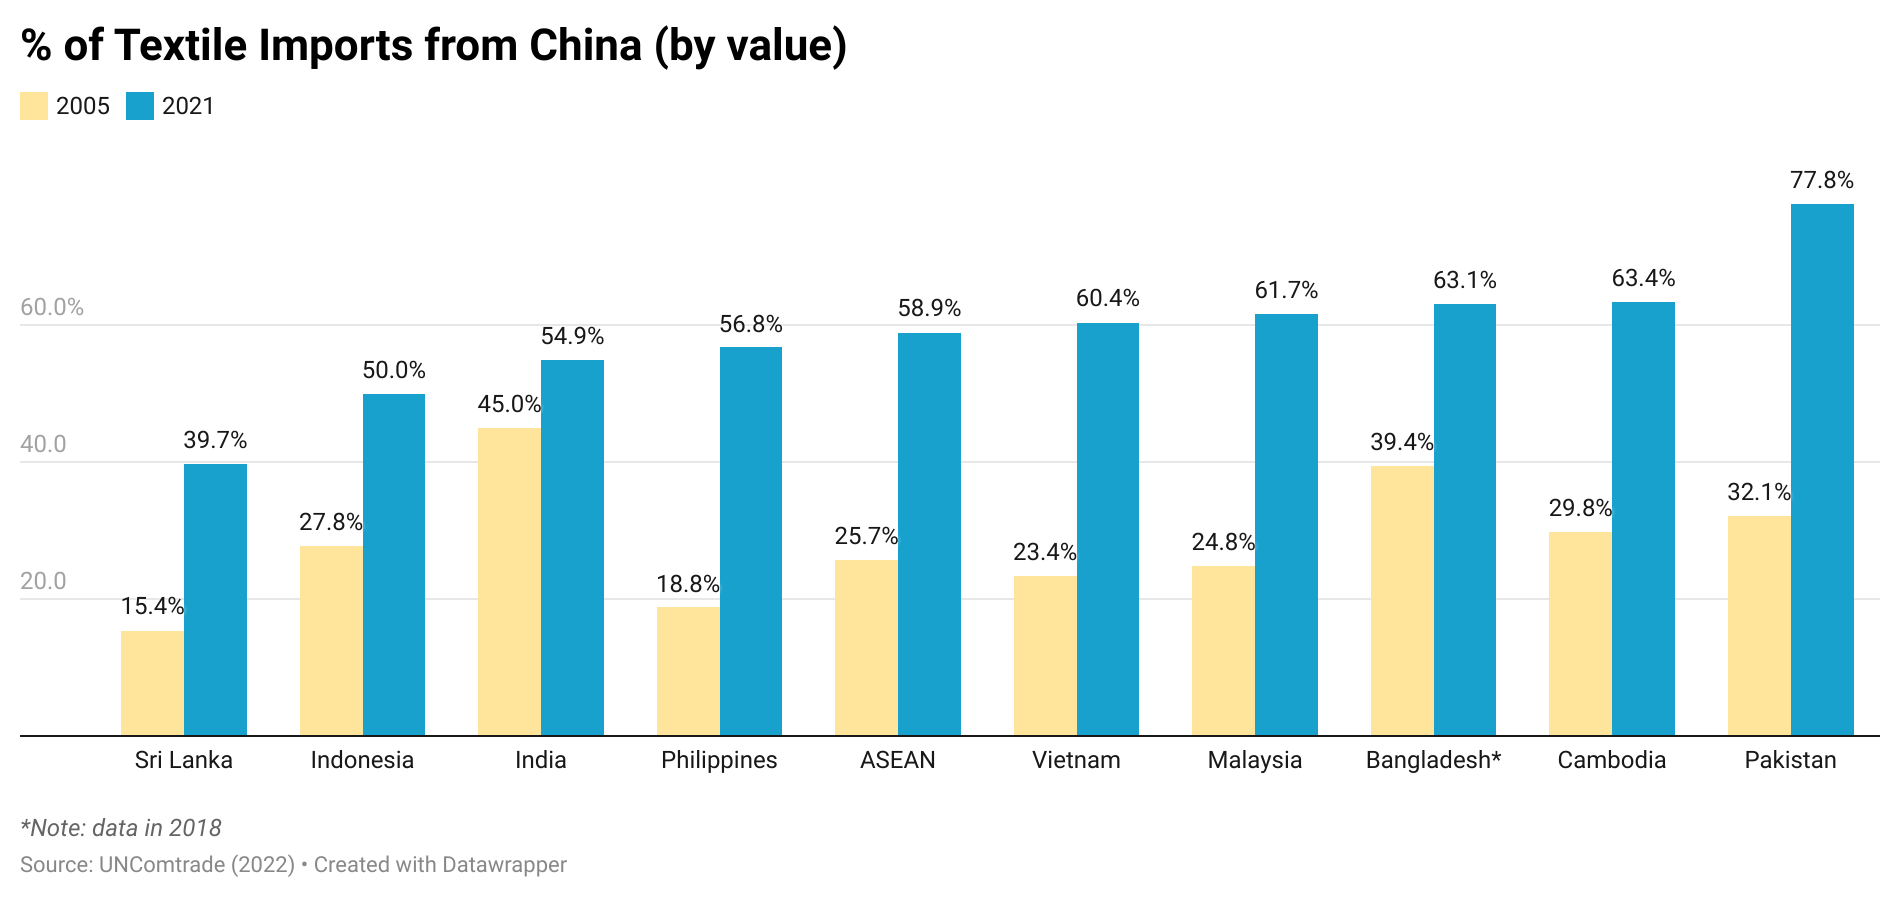
Continuing with the emerging trend in recent years, China is exporting less apparel and more textiles to the world. Notably, China’s market shares in world apparel exports fell from its peak—38.8% in 2014 to a record low of 34.9% in 2017. Meanwhile, China accounted for 37.1% of world textile exports in 2017, which was a new record high. It is important to recognize that China is playing an increasingly critical role as a textile supplier for many apparel-exporting countries in Asia.Measured by value, 47% of Bangladesh’s textile imports came from China in 2017, up from 39% in 2005. We observe similar trends in Cambodia (up from 30% to 65 %), Vietnam (up from 23 % to 50 %), Pakistan (up from 32 % to 71 %), Malaysia (up from 25 % to 54 %), Indonesia (up from 28 % to 46 %), Philippines (up from 19 % to 41 %) and Sri Lanka (up from 15 % to 39 %) over the same period.
In January 2018, Just-Style consulted a panel of industry leaders and scholars in its Outlook 2018–Apparel Industry Issues in the Year Ahead management briefing. Below is my contribution to the report. All suggestions and comments are most welcome!
1. What do you see as the biggest challenges – and opportunities – facing the apparel industry in 2018, and why?
One of the biggest opportunities facing the apparel industry in 2018 could be the faster growth of the world economy. According to the International Monetary Fund (IMF), the global growth forecast for 2018 is expected to reach 3.7 percent, about 0.1 percent points higher than 2017 and 0.6 percent points higher than 2016. Notably, the upward economic growth will be broad-based, including the United States, the Euro area, Japan, China, emerging Europe and Russia. Hopefully, the improved growth of the world economy will translate into increased consumer demand for clothing in 2018.
Nevertheless, from the macroeconomic perspective, oversupply will remain a significant challenge facing the apparel industry in 2018. Data from the World Bank and the World Trade Organization (WTO) shows that, while the world population increased by 21.6 percent between 2000 and 2016, the value of clothing exports (inflation-adjusted) surged by 123.5 percent over the same period. Similarly, between 2000 and 2016, the total U.S. population increased by 14.5 percent and the GDP per capita increased by 22.2 percent, but the supply of apparel to the U.S. retail market surged by over 67.8 percent during the same time frame. The problem of oversupply is the root of many challenges faced by apparel companies today, from the intense market competition, pressure of controlling production and sourcing cost, struggling with excessive inventory and deep discounts to balancing sustainability and business growth.
2: What’s happening with sourcing? How is the sourcing landscape likely to shift in 2018, and what can apparel firms and their suppliers do to stay ahead?
The 2017 US Fashion Industry Benchmarking Study, which I conducted in collaboration with the US Fashion Industry Association (USFIA) earlier this year, provides some interesting insights into companies’ latest sourcing strategies and trends. Based on a survey of 34 executives at the leading U.S. fashion companies, we find that:
First, most surveyed companies continue to maintain a relatively diversified sourcing base, with 57.6 percent currently sourcing from 10+ different countries or regions, up from 51.8 percent last year. Larger companies, in general, continue to have a more diversified sourcing base than smaller companies. Further, around 54 percent of respondents expect their sourcing base will become more diversified in the next two years, up from 44 percent in 2016; over 60 percent of those expecting to diversify currently source from more than 10 different countries or regions already. Given the uncertainties in the market and the regulatory environment (such as the Trump Administration’s trade policy agenda), companies may use diversification to mitigate potential market risks and supply chain disruptions due to protectionism.
Second, although U.S. fashion companies continue to seek alternatives to “Made in China” actively, China’s position as top sourcing destination remains unshakable. Many respondents attribute China’s competitiveness to its enormous manufacturing capacity and overall supply chain efficiency. Meanwhile, it is interesting to note that the most common sourcing model is shifting from “China Plus Many” to “China Plus Vietnam Plus Many” (i.e. China typically accounts for 30-50 percent of total sourcing value or volume, 11-30 percent for Vietnam and less than 10 percent for other sourcing destinations). I think this sourcing model will likely to continue in 2018.
Third, social responsibility and sustainability continue to grow in importance in sourcing decisions. In the study, we find that nearly 90 percent of respondents give more weight to sustainability when choosing where to source now than in the past. Around 90 percent of respondents also say they map their supply chains, i.e., keeping records of name, location, and function of suppliers. Notably, more than half of respondents track not only Tier 1 suppliers, suppliers they contract with directly, but also Tier 2 suppliers, i.e., supplier’s suppliers. However, the result also suggests that a more diversified sourcing base makes it more difficult to monitor supply chains closely. Making the apparel supply chain more socially responsible, sustainable and transparent will continue to be a hot topic in 2018.
3: What should apparel firms and their suppliers be doing now if they want to remain competitive further into the future? What will separate the winners from the losers?
I assume many experts will suggest what apparel firms should change to stay competitive into the future. However, the question in my mind is what should companies keep doing regardless of the external business environment? First, I think companies should always strive to understand and impress consumers and control their supply chains. Despite the growing popularity of e-commerce and the adoption of transformative new technologies, the fundamental nature of apparel as a buyer-driven business will remain the same. Second, companies should always leverage their resources and stay “unique,” no matter it means offering differentiated products or value-added services, maintaining exclusive distribution channels or keeping the leadership position in a particular niche market. Third, apparel firms should always follow the principle of “comparative advantage” and smartly define the scope of their core business functions instead of trying to do everything. Additionally, winners will always be those companies that can take advantage of the mega-development trends of the industry and be willing to make long-term and visionary investments, both physical and intangible (such as human talents).
4: What keeps you awake at night? Is there anything else you think the apparel industry should be keeping a close eye on in the year ahead? Do you expect 2018 to be better than 2017, and why?
I think the apparel industry should keep a close eye on the following issues in 2018:
The possible reaching of the Regional Comprehensive Economic Partnership (RCEP): Even though RCEP is less well-known than the Trans-Pacific Partnership (TPP), we should not ignore the potential impact of the agreement on the future landscape of textile and apparel supply chain in the Asia-Pacific region. One recent study of mine shows that the RCEP will lead to a more integrated textile and apparel supply chain among its members but make it even harder for non-RCEP members to get involved in the regional T&A supply chain in the Asia-Pacific. This conclusion is backed by the latest data from the World Trade Organization (WTO): In 2016, around 91 percent of Asian countries’ textile imports came from other Asian countries, up from 86 percent in 2006. The more efficient regional supply chain as a result of RCEP will further help improve the price competitiveness of apparel made by “factory Asia” in the world marketplace. Particularly in the past few years, textile and apparel exports from Asia have already posted substantial pressures on the operation of the textile and apparel regional supply chain in the Western Hemisphere.
Automation of apparel manufacturing and its impact on the job market: Recall my observations at the MAGIC this August, several vendors showcased their latest technologies which have the potential to automate the cut and sew process entirely or substantially reduce the labor inputs in garment making. The impact of automation on the future of jobs is not a new topic, but the apparel industry presents a unique situation. Globally, over 120 million people remain directly employed in the textile and apparel industries today, a good proportion of whom are females living in poor rural areas. According to the World Trade Organization (WTO), for quite a few low-income and lower-middle income countries such as Bangladesh, Gambia, Pakistan, Madagascar, Sri Lanka, and Cambodia, as much as over 70 percent of their total merchandise exports were textile and apparel products in 2016. Should these labor-intensive garment sewing jobs in the developing countries were replaced by machines, the social and economic impacts will be consequential. I think it is the time to start thinking about the possible scenarios and the appropriate policy responses.
According to the newly released World Trade Statistical Review 2017 by the World Trade Organization (WTO), the current dollar value of world textiles (SITC 65) and apparel (SITC 84) exports totaled $284 billion and $443 billion respectively in 2016, marginally decreased by 2.3 percent and 0.4 percent respectively from a year earlier. This is the second year in a roll since 2015 that the value of world textiles and apparel exports grew negatively.
However, textiles and apparel are not alone. The current dollar value of world merchandise exports also declined by 3 percent in 2015, to $11.2 trillion, mostly caused by the strong decline in exports of fuels and mining products (-14 percent). On the other hand, as noted by the WTO, the steep drop in commodity prices recorded in 2015 mostly halted in 2016, except energy prices.
Textile and apparel exports
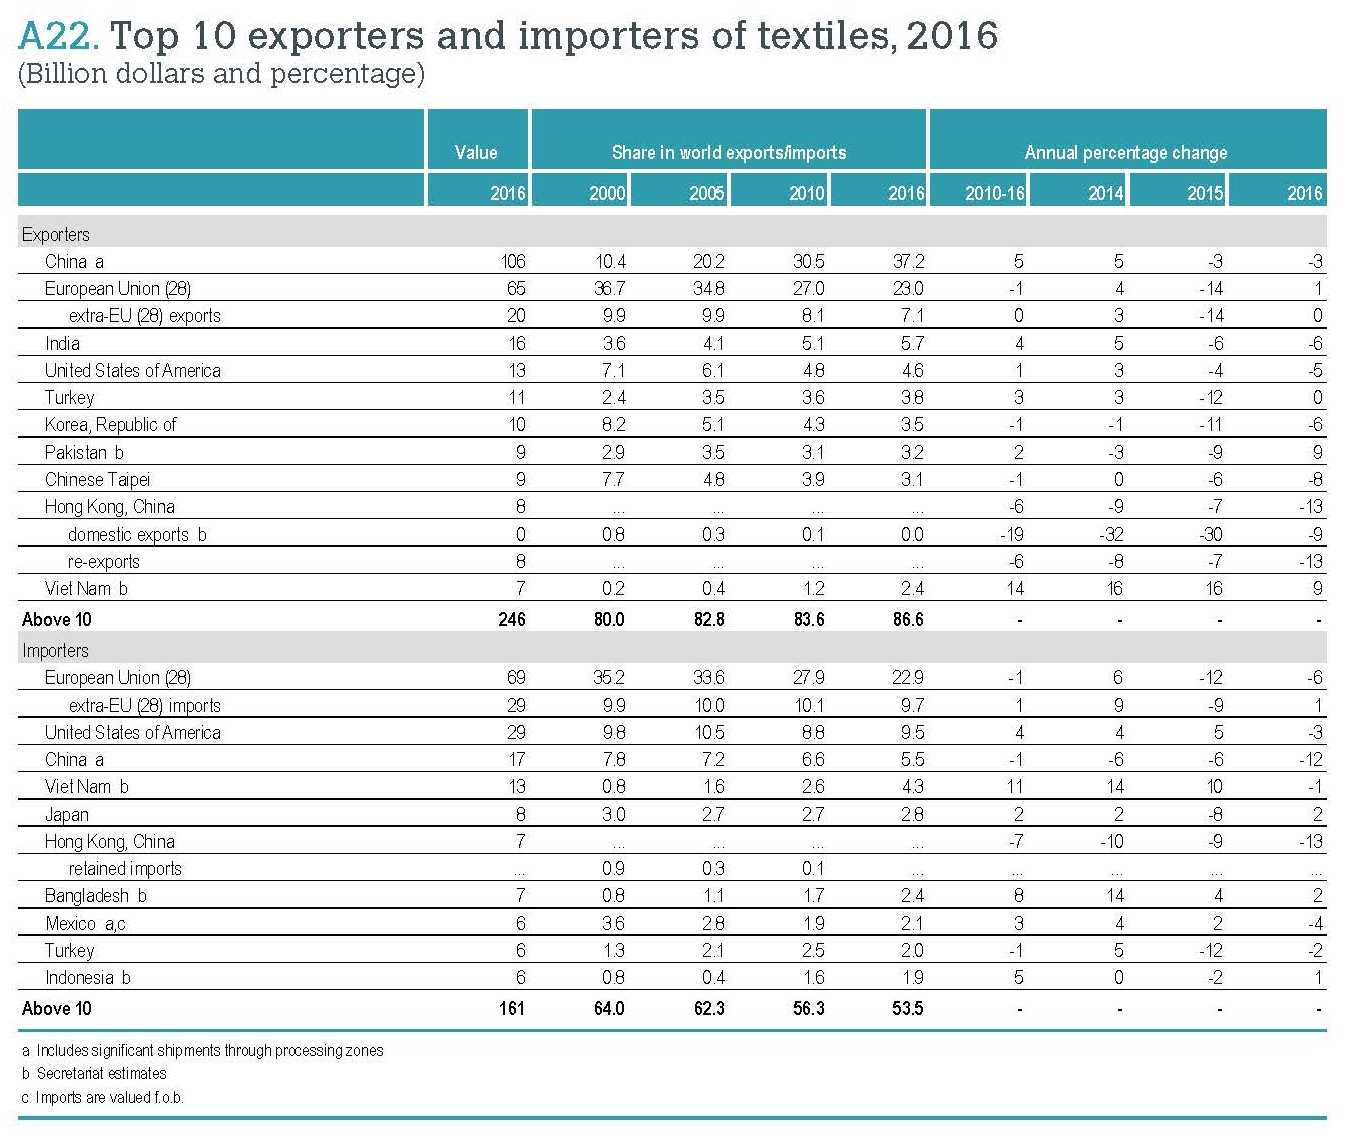
Measured in value, China, European Union, and India remained the top three exporters of textiles in 2016. Altogether, these top three accounted for 65.9 percent of world exports in 2016, slightly down from 66.5 percent in 2015, which is mostly due to India’s shrinking market shares.
The United States remained the fourth top textile exporter in 2016, accounting for 4.6 percent of the shares (down from 4.8 percent in 2015). Over half of the top ten exporters experienced a decline in the value of their exports in 2016, with the highest declines seen in Hong Kong (-13 percent), Taiwan (-8 percent), South Korea (-6 percent) and the United States (-6 percent). Notably, Vietnam entered the world’s top ten textile exporters for the first time (2 percent market shares, 9 percent growth rate from 2015).
Top three exporters of apparel include China, the European Union, and Bangladesh. Altogether, they accounted for 69.1 percent of world exports, close to 70.3 percent in 2015. Among the top ten exporters of apparel, increases in export values were recorded by Cambodia (+6 percent), Bangladesh (+6 percent), Vietnam (+5 percent), and European Union (+4 percent). Other leading exporters saw stagnation in their export values (such as Turkey) or recorded a decline (such as China, India, and Indonesia).
Could be negatively affected by the rising labor and production cost, China’s shares in the world textile exports dropped from 37.4 percent in 2015 to 37.2 percent in 2016, and the shares in the world apparel exports fell from 39.2 percent in 2015 to 36.4 percent in 2016—a record low since 2010.
Textile and apparel imports
Measured in value, the European Union, the United States, and China were the top three importers of textiles in 2016. These top three altogether accounted for 38 percent of world textile imports, slightly up from 37 percent in 2015, but remains much lower than over 53 percent back in 2000. Notably, over the past decade, apparel manufacturing continues to shift from developed to developing countries and many developing countries heavily rely on imported textile inputs due to the lack of local manufacturing capacity. This explains why more textile exports now go to the developing nations.
On the other hand, affected by consumers’ purchasing power (often measured by GDP per capita) and size of the population, the European Union, the United States, and Japan remained the top three importers of apparel in 2016. Altogether, these top three accounted for 62.9 percent of world apparel imports in 2016, up from 59 percent in 2015. Notably, China is quickly becoming one of the world’s top apparel importers. From 2010 to 2016, China’s apparel imports enjoyed an annual 17 percent growth, much higher than most other countries.
In its latest trade statistics and outlook report, the World Trade Organization (WTO) forecasts the world merchandise trade volume to grow within a range of 1.8-3.6% in 2017 (on average 2.4%). This growth rate is slightly up from a very weak growth of 1.3% in 2016. WTO expects trade growth to further pick up to 2.1-4% in 2018.
On the positive side, the global GDP growth is expected to rebound to 2.7% in 2017 from 2.3% in 2016, which will contribute to the expansion of world trade. Notably, WTO expects emerging economies to return to modest economic growth in 2017. However, WTO sees policy uncertainty, including the imposition of restrictive trade measures and monetary tightening, a main risk factor to world trade this year.
WTO also noted that since the financial crisis, the ratio of trade growth to GDP growth has fallen to around 1:1. And 2016 marked the first time since 2001 that this ratio has dropped below 1, to a ratio of 0.6:1. Historically, the volume of world merchandise trade has tended to grow about 1.5 times faster than world output. WTO is cautiously optimistic that the ratio will partly recover in 2017, but the ratio will remain a cause for concern.
At the press conference, Trump Administration’s trade policy receives significant attention. But according to Roberto Azevêdo, Director-General of WTO, “just an overall statement of the intention to go one particular way or another, does not tell us what the trade policy is and does not tell us what the impact of that trade policy will be. Instead, the devil is in the details”. Roberto said he is waiting to see Trump’s new trade team in place (for example, the new US Trade Representative) and he looks forward to the meaningful dialogues with the team to know more details and clarity of U.S. trade policy. Until then, any comments on the impact of Trump Administration’s trade policy would be just speculations.
Trade has proved to be one of the most powerful pro-growth, anti-poverty tools in history: In recent decades it has helped to lift one billion people out of poverty in developing countries. The World Bank found that income grew more than three times faster for developing countries that lowered trade barriers than for those that did not. in the US, estimates show that the gains from globalization have raised real household incomes by up to $10,000 annually.
Trade means more choice, lower prices and real dollar in the pocket for consumers: A joint study by UCLA and Columbia found that people with high incomes could lose up to 28% of their purchasing power if borders were closed to trade. But the poorest consumers, they could lose up to 63% of their spending power.
Trade is imperfect: Despite the obvious overall gains, trade can have negative effects in some parts of the economy. And those effects can have a big impact on some people’s lives. But we would be betraying those very same people, and many, many more, if we turned against trade and allowed the negative arguments to go unanswered.
Trade protectionism is an ineffective and very expensive way of protecting jobs: In the latter part of the 20th century, the EU protected various industries — including steel, agriculture and textiles. The French economist Patrick Messerlin analyzed this approach. He found that the average cost per job saved was several hundred thousand euros, or about 10 times the corresponding wage in each of those industries. The US applied tariffs on Chinese truck tires in 2009. Around 1,200 jobs were saved, but this came at a cost of $1.1 billion in higher prices for consumers. That works out as a cost of about $900,000 per job. The Petersen Institute estimates that these higher prices also resulted in around 2,500 job losses in the tire retail sector due to slumping sales.
Trade protectionist solutions do not reflect the nature of the modern economy and the international nature of production: Most goods aren’t made in one country. Most exports have components which have been imported. So by restricting imports, a country can restrict its own ability to export. Trade protectionism is also a two-way street. It leads to retaliation and the domino-effect.
Unemployment is not strictly or mainly a trade issue, trade measures will NOT address this disorder: trade is a relatively minor cause of job losses. The evidence shows that well over 80% of job losses in advanced economies are not due to trade, but to increased productivity through technology and innovation.
The real economic revolution that is happening today: Studies suggest that almost 50% of existing jobs in the US are at high risk of automation. An International Labor Organization (ILO) study on Cambodia, Indonesia, Vietnam, Philippines and Thailand found that 56% of jobs are at high risk of automation. And that’s just on average. In some sectors over 80% of jobs are at risk. In Japan, there are 315 robots per 10,000 workers. In China that number is only 36 — but it is rising fast. In the US, the number is 164, which is still relatively low. But it is set to go up!
Questions for thinking:
How do we ensure that trade can continue to promote growth and lift people out of poverty?
How to RESPOND to the rising anti-trade sentiment in public discourse? Is trade protectionism the right approach?
How to ensure that the benefits of trade reach further and wider– in other words, how to create a more inclusive global trading system? How to harness the power of e-commerce to support inclusiveness?
How do we help small and medium sized enterprises (SMEs) to leverage technology so that this marketplace doesn’t just become the preserve of the big players?
How can the trading system adjust to the shift from a world of few, large, known exporters to a world in which exporters are many, small and unknown? How can we ensure that this transition works for consumers?
According to the newly released World Trade Statistical Review 2016 by the World Trade Organization (WTO), the current dollar value of world textiles (SITC 65) and apparel (SITC 84) exports totaled $291 billion and $445 billion respectively in 2015, but decreased by 7.2 percent and 8.0 percent from a year earlier. This is the first time since the 2009 financial crisis that the value of world textiles and apparel exports grew negatively.
However, textiles and apparel are not alone. The current dollar value of world merchandise exports also declined by 13 percent in 2015,to $16.0 trillion, as export prices fell by 15 percent. In comparison, the volume of world trade grew slowly at a rate of 2.7 percent, which was roughly in line with world GDP growth of 2.4 percent. WTO says that falling prices for oil and other primary commodities, economic slowdown in China, a severe recession in Brazil, strong fluctuations in exchange rates, and financial volatility driven by divergent monetary policies in developed countries are among the major factors that contributed to the weak performance in world trade.
Textile and apparel exports
China, the European Union and India remained the top three exporters of textilesin 2015. Altogether, they accounted for 66.4 percent of world exports. The United States remained the fourth top textile exporter in 2015. The top ten exporters all experienced a decline in the value of their exports in 2015, with the highest declines seen in the European Union (-14 percent) and Turkey (-13 percent). The smallest decline was recorded in China (-2 percent).
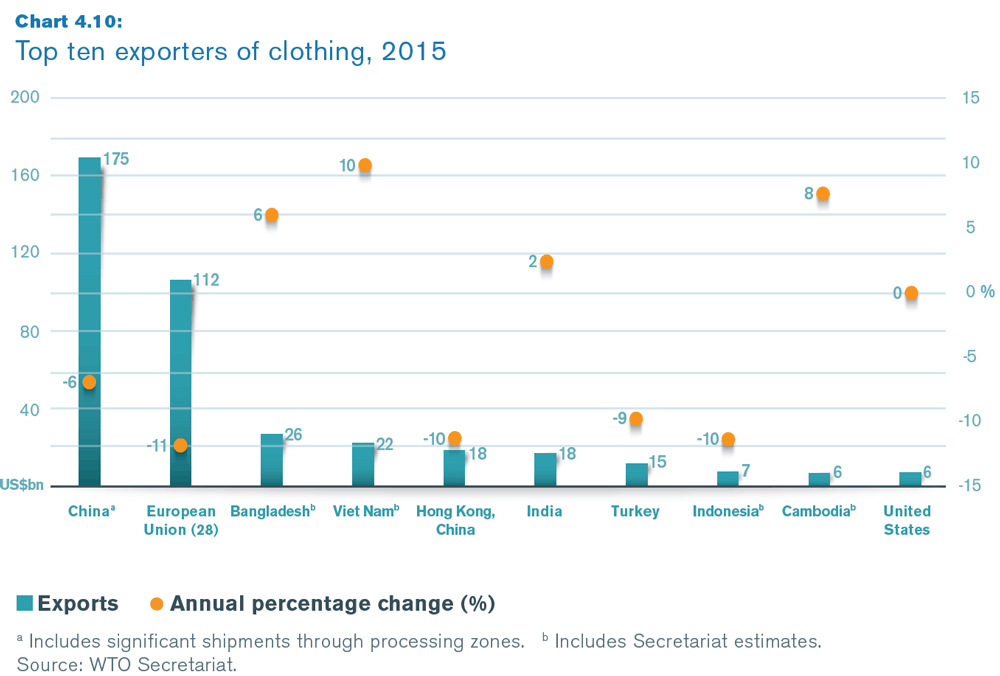
Top three exporters of apparel include China, the European Union and Bangladesh. Altogether, they accounted for 70.3 percent of world exports. Among the top ten exporters of apparel, increases in export values were recorded by Vietnam (+10 percent), Cambodia(+8 percent), Bangladesh (+6 percent) and India (+2 percent). The other major exporters saw stagnation in their export values (United States) or recorded a decline (all other top ten economies).
Additionally, despite reported rising production cost, China’s market shares in world textile and apparel exports continued to rise in 2015 (see the figure above).
Textile and apparel imports
The European Union, China and the United States were the top three importers of textiles in 2015. However, altogether they accounted for only 37 percent of world imports, down from 52.8 percent in 2000. Because a good proportion of textiles made by developed countries (such as the United States) are exported to developing countries for apparel manufacturing purposes, the pattern reflects the changing dynamics of world apparel manufacturing and exports in recent years.
Because of consumers’ purchasing power (often measured by GDP per capita) and size of the population, the European Union, the United States and Japan remained the top three importers of apparel in 2015. Altogether, they accounted for 59 percent of world imports, but down from 78 percent in 2000. This indicates that import demand from other economies, especially some emerging markets, have been growing faster over the past decade.
Erin Ennis has been Vice President of the US-China Business Council (USCBC) since May 2005. In that position, she directs the Council’s government affairs and advocacy work for member companies and oversees the Council’s Business Advisory Services. She also leads a coalition of other trade associations on issues of interest to companies doing business with China. Founded in 1973, the US-China Business Council provides extensive China-focused information, advisory, and advocacy services, along with comprehensive events, to nearly 250 US corporations operating within the United States and throughout Asia.
Prior to joining the Council, Ms. Ennis worked at Kissinger McLarty Associates, the international consulting firm headed by former Secretary of State Henry Kissinger and former White House Chief of Staff Thomas “Mack” McLarty. At Kissinger McLarty, Ms. Ennis was responsible for implementing strategies for international business clients on proprietary trade matters, primarily in Vietnam and Japan.
Before entering the private sector, Ms. Ennis held several positions in the US Government. From 1992 to 1996, Ms. Ennis was a legislative aide to former U.S. Senator John Breaux, working on international trade and commerce. She also worked on health care issues during the Senate’s consideration of President Bill Clinton’s health care reform, an issue on which Senator Breaux actively worked to broker a compromise.
At the Office of the US Trade Representative from 1996 to 2000, Ms. Ennis first worked in Congressional Affairs on Asia issues, including annual approvals of China’s most favored nation status and the ill-fated 1997 push to renew presidential “fast track” negotiating authority. Beginning in 1998, she was assistant to Deputy US Trade Representative Richard Fisher, who led US trade negotiations and enforcement with Asia, the Americas, and on intellectual property rights.
Interview Part
Sheng Lu: Our students wonder whether increased trade with China is good or bad for the U.S. economy. Many of them consider the U.S. trade deficit with China to be a serious problem and they are worried about the loss of U.S. jobs to China. What’s your view and insights?
Erin Ennis: We should be realistic about what trade balance data shows and what it doesn’t. There is almost no correlation between a high US trade deficit and a strong US economy. In fact, we tend to have the lowest trade deficits when our economy is doing the worst – take a look at the data from the recent global recession between 2009 and 2010 for example versus what the trade deficit looked like in the 1990s when our economy was booming. We also don’t save much of our earnings, which also factors into the data.
Focusing on a single country as the source of our concerns leads to an inaccurate view that what other countries do has more of an effect on our economy than our own domestic policies. We should indeed be concerned about job creation in the US, but to do that, we should be implementing policies that ensure that we have as competitive an economy as possible. That will require a combination of education, energy, tax and other domestic policies. It also requires our economy to be as open as possible and pursuing market openings globally so that US goods and services have opportunities for sales overseas.
Sheng Lu: The USCBC 2014 China Business Environment Survey describes China as “an extremely difficult business environment along with a vital, growing market for foreign businesses”. We all know that China is an emerging market, but what are the top challenges faced by U.S. companies doing business in China?
Erin Ennis: Our survey goes into detail about the various challenges that companies experience in China. Competition with Chinese companies was the top issue in 2014, an issue that was not only cited independently, but also factors into several other issues that were cited such as foreign investment restrictions, uneven enforcement of laws, licensing disparities, and discrimination in the market. IPR enforcement is also a top concern for companies. Beyond those, there are also issues that both Chinese and foreign companies are grappling with in the market: a very tight labor market and significant increases in the cost of doing business.
Sheng Lu: Related to the previous question, two numbers in the USCBC survey seem to be very interesting: Although 90 percent of respondents consider rising costs in China a concern, only 14 percent of respondents say they actually reduced or stopped planned investment in China in the past year. How to explain this phenomenon?
Erin Ennis: The simple answer is that companies don’t make decisions on where to do business solely on cost. Most companies report that they are doing business in China to access Chinese customers. While costs may have increased, their opportunities for increased sales have increased too. China’s market grew at about 7% in 2014 – still a rapid rate of growth, even though it is slower than in previous years. Companies are likely to stay in the market, even as costs increase, to continue to access those opportunities.
Sheng Lu: While it is under heated discussion whether China should join the Trans-Pacific Partnership (TPP) or not, USCBC suggests that a successful conclusion of the Bilateral Investment Treaty (BIT) negotiations should be the top priority in the US-China economic relationship. What is BIT and why does it matter for U.S. companies?
Erin Ennis: The short answer is that a BIT matters because it will require China to provide the same treatment to foreign companies that it provides to domestic ones and it will require China to open many sectors of its economy to foreign investment that remain closed. More detailed explanations of what the BIT is and why it matters can be found on USCBC’s website here: https://www.uschina.org/advocacy/bilateral-investment-treaty.
Sheng Lu: December 2015 will mark the 15th anniversary of China’s accession to the World Trade Organization (WTO). In your view, what are the most important changes in US-China economic relations since China joins the WTO?
Erin Ennis: China’s WTO access required it to open significant parts of its economy to foreign companies. In general China has done a good job of implementing those commitments. As a consequence, China has grown to be the United States’ third largest trading partners after Canada and Mexico, with whom we have a free trade agreement. More needs to be done, however, to open China’s market. The US-China BIT negotiations will be a useful tool in achieving that goal.
Sheng Lu: China’s recent sweeping anti-graft campaign has attracted the world attention. How does the US business community look at this campaign? Will this campaign have any long-term impact on China’s business environment?
Erin Ennis: In general, the anticorruption campaign is viewed very positively by foreign companies because it is an additional way to ensure that all companies are treated equally in China – bribes and other illegal activities should never be tolerated. To date, the only impact that foreign companies have reported is that it takes longer to get some projects or licenses approved because Chinese officials are being overly cautious in ensuring that there is no appearance of impropriety. Those kinds of delays are ones that companies are willing to deal with.
Sheng Lu: Our students wonder if China presents as a career opportunity for them as well. What’s your observation and do you have any suggestions for our students interested in working/interning in China?
Erin Ennis: If you are serious about working in China, then learning Chinese should be at the top of your to do list – but the same could be said about going to work in any foreign country: learn their language. Beyond that, go to China and experience it. There are plenty of ways to do both of those, but language and on the ground experience will establish your credibility as someone who is serious about the specific opportunities in China, rather than someone who just wants a chance to live in a different country. Final suggestions: read as much as you can and question what you read. China is not a monolith and, as anywhere, there are always multiple sides to every story – that’s especially true in business and politics. Having an informed view of those dynamics will serve you well.
The following analysis is conducted based on the statistics released by the World Trade Organization on August 5, 2014.
1. Asia continues to dominate the world textile and apparel exports from 2012 to 2013.
2. Despite concerns about its rising labor cost, China continues to gain more market shares in world textile and apparel exports from 2012 to 2013.
3. World market for textiles remains relatively stable from 2000 to 2013; world market for apparel is gradually shifting and diversifying. Although Europe and North America still account for lion’s shares in world apparel imports (due to their higher GDP per capita), Asia is the fast growing market.
4. Intra-region trade remains a distinct pattern in world T&A trade, particularly in Asia, Europe and America. However, the pattern has become substantially weakened in Europe and America from 2000 to 2013, which could be the results of increasing number of FTAs in these regions.
5. US textile and apparel exports increased 3.3% and 4.4% respectively from 2012 to 2013. North America remains the single largest T&A export market for the United States.
This past week, our class moved to the topic of trade policy, which as usual turned out to be one of the most challenging and “least exciting” chapters for our students. A common question in students’ mind is (and probably for some professors in the textile and apparel field as well): as a fashion major, why do I need to care about trade policy?
The answer is straightforward: textile market is shaped by rules—trade policy. Trade policy affects the availability of T&A products in the market in terms of quantity, price and speed. Trade policy also affects T&A companies’ access to the market, both domestic and foreign. Simply look at the clothing and shoes we wear daily: if they are imported, very likely the price we pay includes 10-30% additional tax (tariff). Even the clothing is “made in USA”, we should realize that the survival of US domestic apparel manufacturing could be the result of protection by the exact same trade policy which makes imported competing products 10—30% more expensive than otherwise in the US market.
Yet, trade policy does not happen naturally. Trade policies are deliberately made by policymakers and strongly influenced by industry players. Two things I hope our students can realize: first, the T&A industry cannot afford ignoring trade policy. Think about this case: if the US yarn manufacturers did not actively advocate “yarn-forward” rules of origin to be adopted in NAFTA and CAFTA, what will happen to their fate right now? Vice versa, how will the commercial interests of apparel retailers/importers be affected if they stop voicing themselves and simply leave the trade protectionism forces to influence trade policymakers? As the saying goes: if you are not at the table, you are on the menu. To certain extent, there is no good or bad trade policy, but winners and losers.
Second, understanding trade policy making is about understanding the real world. Trade policymaking is a painful balancing process like trying to “breathe and suck at the same time”.Not only different interests groups may have conflicting views on a specific trade policy, but also different policymakers may have their respective philosophies and priorities. As we mentioned in the class, agencies in the executive branch such as the US Trade Representative Office and the Commerce Department put national interests and international obligations of the United States at its heart whereas the Congress often times gives preferences to regional, sectoral and party interests. A full understanding of T&A trade policy thus requires familiarity with what’s going on in this unique industry sector, knowledge about its key players as well as having a big picture vision in mind. For example, without recognizing the value of becoming a WTO member for China, it will be difficult to appreciate why it was willing to allow US to restrict its apparel exports from 2003 to 2008 on a discriminatory basis (T-shirt book, part III).
Our FASH students shall be encouraged to jump out of the narrowly-defined fashion world, because no industry operates as an island. Instead, the T&A industry is part of the world economy and shaped by the “rest” of the world economy.
This is the introductory video of this year’s World Trade Organization (WTO) Public Forum hosted from Oct 1 to Oct 3. The WTO Public Forum is an annual event that provides a platform for public debate across a wide range of WTO issues and trade topics. The Public Forum is also an opportunity for us in the WTO to listen and exchange views with non-government organizations (NGOs), academia, the private sector, with those of you who are increasingly participating in shaping the world’s economic and political environment. This year’s Public Forum looks at the future of trade in an era of innovation and digitalization.
As put it by Michael Froman, the U.S. Trade Representative :” The global marketplace has experienced a sea change. Combining globalization with new technology and with new business models has dramatically accelerated the pace of change and innovation. The flow of data is as important as the movement of goods. Services are an increasing share of value-added manufacturing. And the market is determining standards at an increasingly rapid pace.”
For your reference. Many issues are relevant to textile and apparel sectors (for example: global value chain, trade and job, trade facilitation, competition policy, intelletrual property right protection, green economy, pluralism/regionalism as well as trade and development).
This year’s WTO Public Forum will debate:
formulating new approaches to multilateral trade opening in areas such as trade facilitation;
addressing 21st-century issues and identifying areas in need of new regulations;
looking at the role of non-state actors in strengthening the multilateral trading system
The session will cover the following sessions
Global value chain: implications for trade policy
Trade and job
The multilateral trading system in the 21st century: interaction between trade and competition policy
Plurilaterals and Bilaterals: Guardians or Gravediggers of the WTO?
This year’s Ideas Workshops will cover:
How to ensure green economy policies are implemented in a co-ordinated manner rather than at cross-purposes?
The future of the WTO dispute settlement system.
Rethinking trade-related aspects of intellectual property in today’s global economy.
WTO’s first ever Youth Ambassadors, selected by separate video and essay contests, will discuss the topic “How can trade promote development?”
A great commentary article on a recent study on trade protectionist measures by Chad Bown, a former professor from Brandeis university and a guru on trade remedy measures. It is interesting to note that the using of trade protectionist measures is much less frequent today than in the past. I agree with the reasons proposed by the article, such as the establishment of the WTO as a monitoring body, global production and emerging markets instead of developed countries becoming leading importers. On the other hand, trade protectionist measures are taking more diversified forms today and the scope has gone far beyond the traditional AD, CVD and safeguard measures. In particuar, measures that intend to promote export potentially could raise new trade disputes among leading exporters.
New Patterns of World Textile and Clothing Trade and Critical Trade Policy Issues
By Sheng Lu
Keywords: Post-quota era, world textile and clothing trade, trade policy
Impact of the elimination of the 40-year textile and clothing (T&C) quota system on January 1, 2005 has always been a research interest to scholars in the field. Shifting from a highly-distorted trading environment to a much more market-based competition, reshuffle of the world T&C trade in the post-quota era is widely believed to be unavoidable and will have ripple effects on the future landscape of the global T&C industry (Dickerson, 1999; Nordas, 2004).
After six years of transition, medium and long-term effects of quota elimination have begun to display, attributed to adjustment of business practices of T&A firms in response to the new “rules of the game” (UNIDO, 2009). By taking advantage of such great timing, this study scrutinizes patterns of world T&C trade that have been newly emerged so far in the post-quota era. Capturing these new trends of development at the macro-industry level can both deepen understanding about the 40-year quota system itself and raise awareness of emerging research agendas for world T&C trade.
Three specific post-quota patterns of world T&C trade are discussed in the study:
First, non-dominant position of China in world T&C export. At first glance, China increased its market share in world T&C export by roughly 10 percentage points from 2005 to 2008, suggesting China was one of the biggest winners of quota elimination (WTO, 2010). However, a closer look will find: (1) China gained its market share at a decelerating rate over that period, implying China’s export surge at the very beginning of quota elimination was mainly due to the temporary transition effect; (2) At the disaggregated 6-digit HS code level, China’s export performance varied greatly from product to product, implying other exporters was still able to compete with China in the post-quota era by focusing on certain T&C product categories; (3) A number of Asian and European countries other than China also enjoyed robust growth in T&C export since 2005, suggesting China was one of the beneficiaries rather than the only winner of the post-quota era. Last but not least, the emergence of the “China+1” sourcing strategy indicated that T&C importers already started selecting other possible substitution sourcing destination as China’s back-up. In particular, importers were cautions about China’s rising manufacturing cost and the business risks associated with placing “too many eggs in one basket”.
Second, geographic concentration of T&C trade and increasing dependence on textile manufacturing capacity for clothing export. This new pattern is closely associated with changes of buyers’ sourcing practices. Specifically: (1) Market concentration rate (Herfindahl index) in major T&C importing countries, such as the United States, Europe and Japan, quickly went up since 2005 because of buyers’ consolidation of their sourcing channels. Traditional trade patterns such as “triangle manufacturing” and “outward processing trade” which were artificially created by the quota system can no longer justify their rationality of existence when quota restriction were removed. (2) The traditional “Cut, Make and Trim” (CMT) sourcing practice was gradually replaced by full-package sourcing. This shift was largely caused by the upgrading of global T&C value chain, including the transition of branded manufacturers into marketers and retailers’ more active involvement in direct sourcing; (3) Compared to CMT, qualified destination for full package sourcing needs to have the capacity of locally manufacturing textiles. This requirement poses big challenges to many developing countries which haven’t established a sound textile industry yet due to their overall lagged behind economic development. Impacts of full package sourcing on many aspects of the global T&C industry can be further studied.
Third, widening gap of intra-region trade patterns between America and Europe. As one format of vertical division of labor formed by countries in the same region but at different development stages, intra-region trade was a special feature of the world T&C trade, especially in America and Europe (Dickerson, 1999). However, statistics showed that intra-region trade in America quickly dropped from 69% to 55.7% for textiles and 48.5% to 26.9% for clothing from 2004 to 2008 (WTO, 2010). The decline occurred despite the new passage of several free-trade agreements which deliberately include clauses encouraging the using of U.S.-made textile products by neighboring developing countries. Accompanied with lowering share of intra-region T&C trade, imports from Asia keep constant rising in America over the same period. In contrast, share of intra-region trade in Europe remained stable, stood at around 75% for textiles and 82% for clothing. More studies can be done to explore the causes of such widening gap between America and Europe in terms of intra-region trade patterns.
This study also calls for awareness of “unexpected” negative effects of some trade policies on developing countries’ T&C export in the post-quota era. These trade policies include although not limited to: (1) WTO Doha Development Agenda (DDA). The DDA negotiation set the goal to cut import tariff for T&C product worldwide. However, reduced tariff rate will also wear down the real benefits of preferential duty-free treatment enjoyed by some least developed countries when competing with T&C export giants such as China and India; (2) Rule of origin (ROO) provisions in free-trade agreements. ROO originally was developed to ensure preferential treatments be enjoyed only by eligible FTA members. However, as ROO is specific to each FTA, the complexity and inconsistency made many preferential treatments seldom be taken advantage of. ROO further reduces the incentives for developing countries to develop their own textile industry. This put developing countries at a special disadvantage position when buyers are shifting to full package sourcing as discussed above. (3) Generalized System of Preferences (GSP). Aimed at promoting economic growth in the developing world, developed countries allow preferential duty-free entry of imports from eligible developing countries through the GSP program. Ironically, although T&C account for 50%-90% of total exports for many developing countries (WTO, 2010), most T&C importers including the United States and the European Union still reject including T&C in their GSP programs due to opposition from political forceful domestic industries with concerns about import competition. It is a challenge for policy makers in the post-quota era to design a set of fair and rational trading rules under which developing countries can enjoy the benefits of quota elimination and have more opportunities participating in world T&C trade. Academia has its key role to play in this endeavor.
References
Dickerson, K. G. (1999). Textiles and apparel in the global economy. N.J.: Merrill
Nordas, H. K. (2004). The global textile and clothing industry post the agreement on textiles and clothing. WTO discussion papers, 5. Geneva: WTO Publications
United Nations Industrial Development Organization, UNIDO (2009). The Impact of Institutions on Structural Change in Manufacturing: the Case of International Trade Regime in Textiles and Clothing. Vienna: Austria
World Trade Organization, WTO. (2010). World Trade Statistics, Geneva: Switzerland