Updated data in 2020 is now available: WTO Reports World Textiles and Apparel Trade in 2020

According to the World Trade Statistical Review 2020 newly released by the World Trade Organization (WTO):
First, the volume of world textiles and apparel trade reduced in 2019 due to weakened demand and the negative impacts of trade tensions. According to the WTO, the value of the world textiles (SITC 65) and apparel (SITC 84) exports totaled $305bn and $492bn in 2019, respectively, decreased by 2.4% and 0.4% from a year ago. The world merchandise trade also fell by nearly 3% measured by value and 0.1% measured by volume 2018-2019, in contrast with a positive 2.8% growth 2017-2018. Put these numbers in context, the year 2019 was the first time that world merchandise trade fell since the 2008 global financial crisis, and the decline happened even before the pandemic. As noted by the WTO, the economic slowdown and the escalating trade tensions, particularly the tariff war between the United States and China, were among the major contributing factors for the contraction of trade flows.
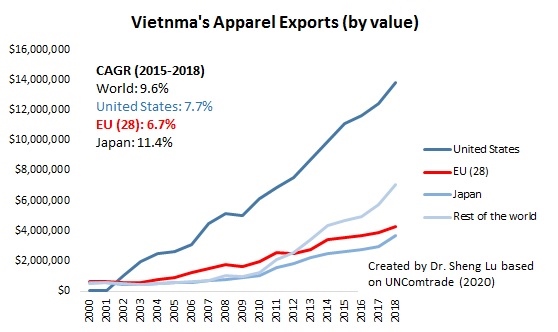
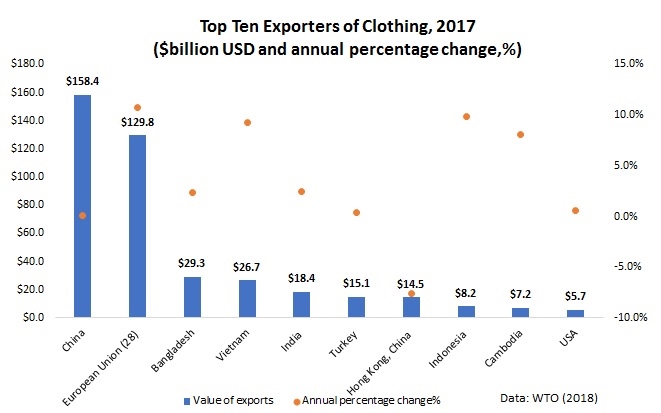
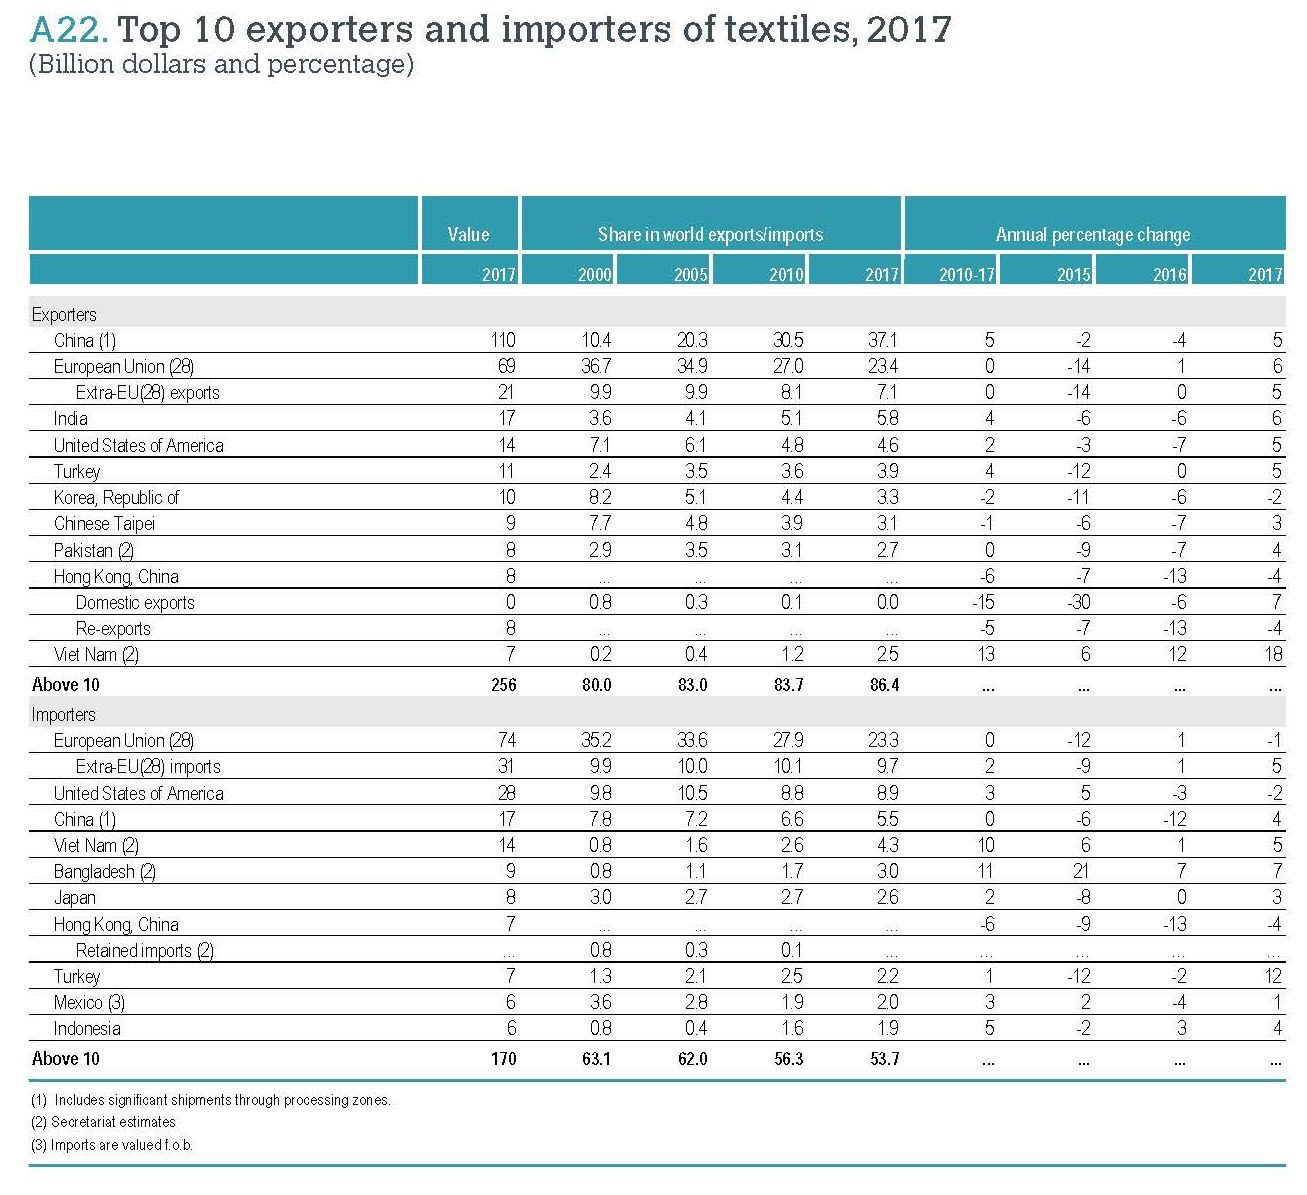
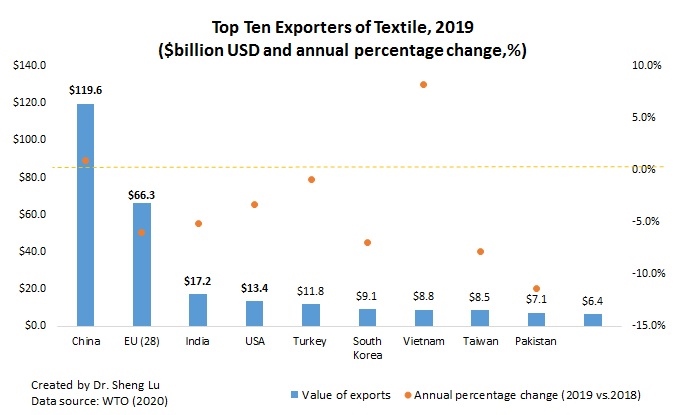
Second, the pattern of world textile exports overall stays stable in 2019; Meanwhile, China and Vietnam continue to gain momentum. China, European Union (EU28), and India remained the world’s top three exporters of textiles in 2019. Altogether, these top three accounted for 66.9% of the value of world textile exports in 2019, almost no change from two years ago. Notably, despite the headwinds, China and Vietnam stilled enjoy the positive growth of their textile exports in 2019, up 0.9%, and 8.3%, respectively. In particular, Vietnam exceeded Taiwan and ranked the world’s seventh-largest textile exporter in 2019 ($8.8bn of exports, up 8.3% from a year earlier), the first time in history. The change also reflects Vietnam’s efforts to continuously upgrade its textile and apparel industry and strengthen the local textile production capacity are paying off.
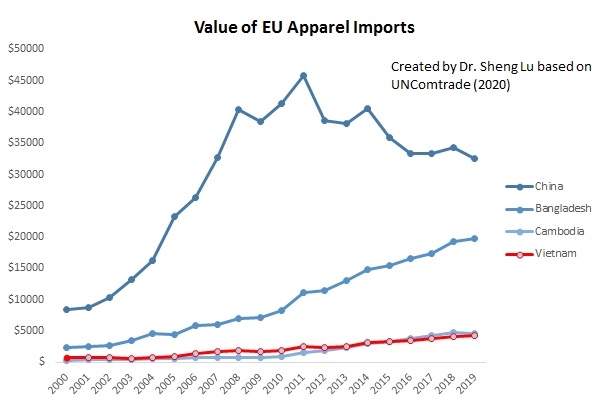
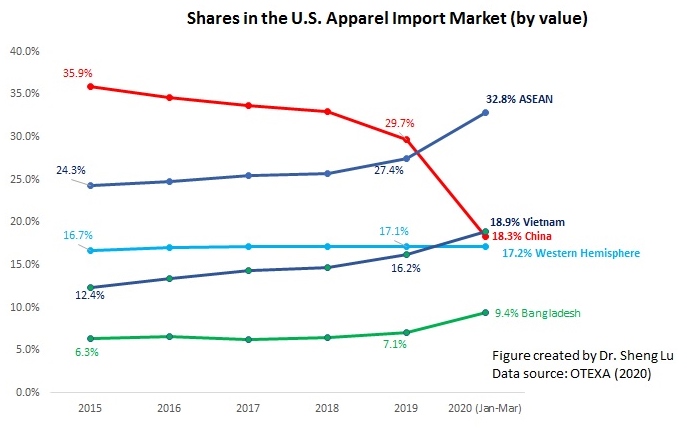
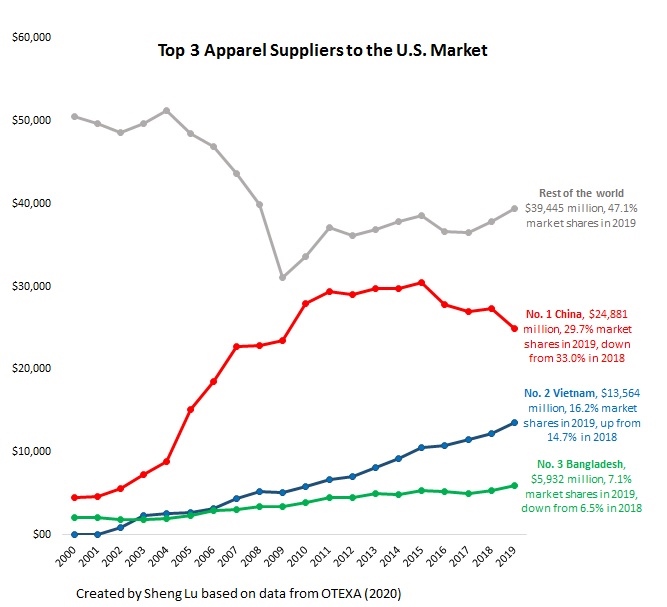
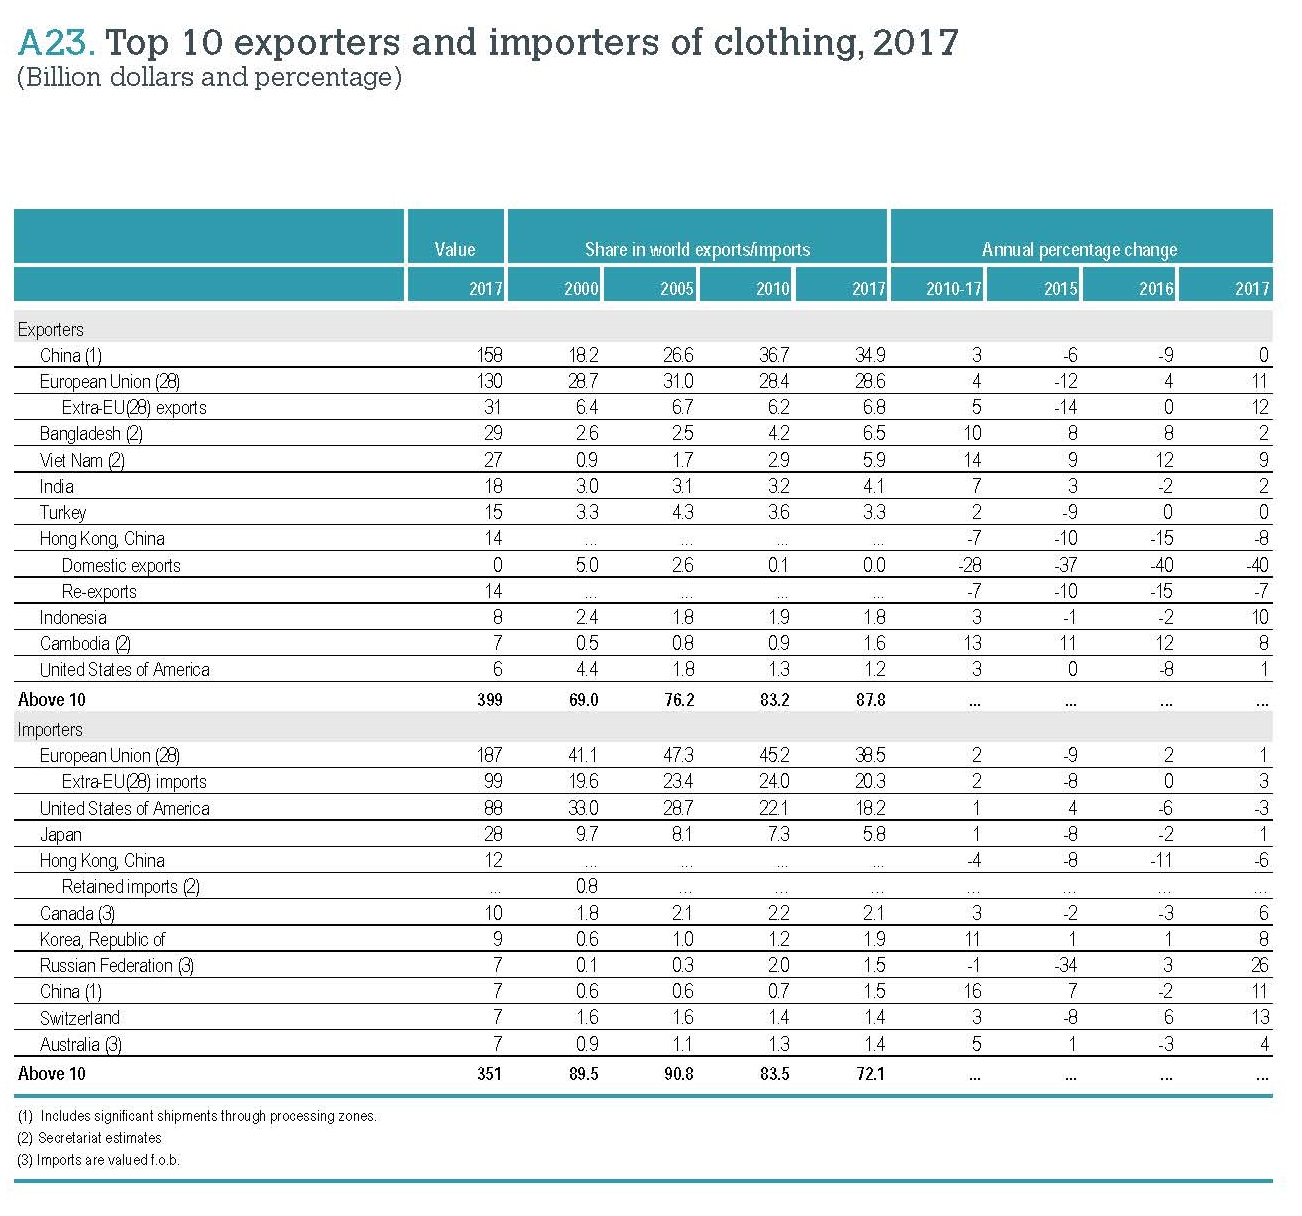
Third, the pattern of world apparel exports reflects fashion companies’ shifting strategies to reduce sourcing from China. China, the European Union (EU28), Bangladesh, and Vietnam unshakably remained the world’s top four exporters of apparel in 2019. Altogether, these top four accounted for as much as 71.4% of world market shares in 2019, which, however, was lower than 74% from 2016 to 2018—primarily due to China’s reduced market shares.
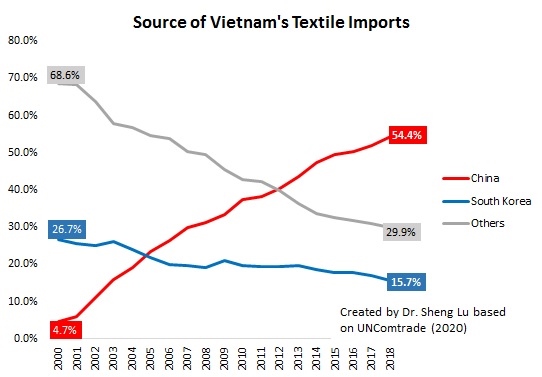
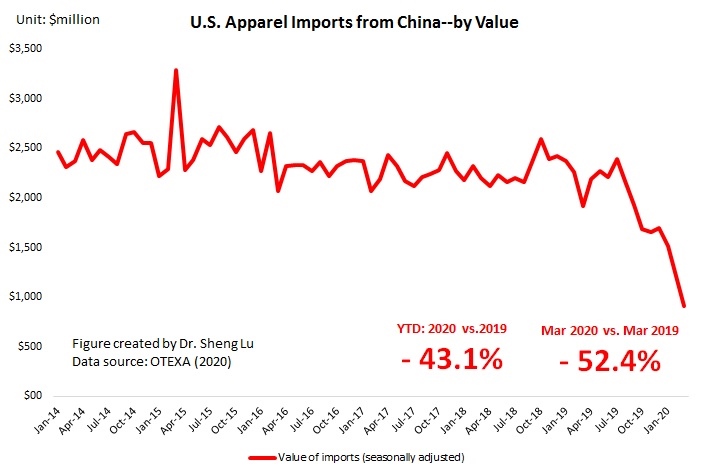
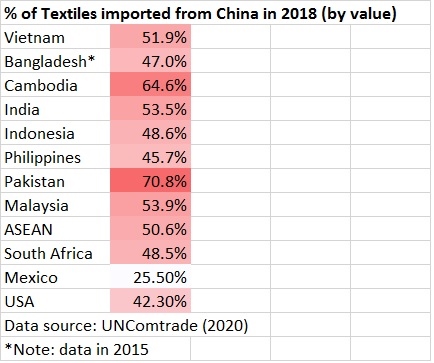
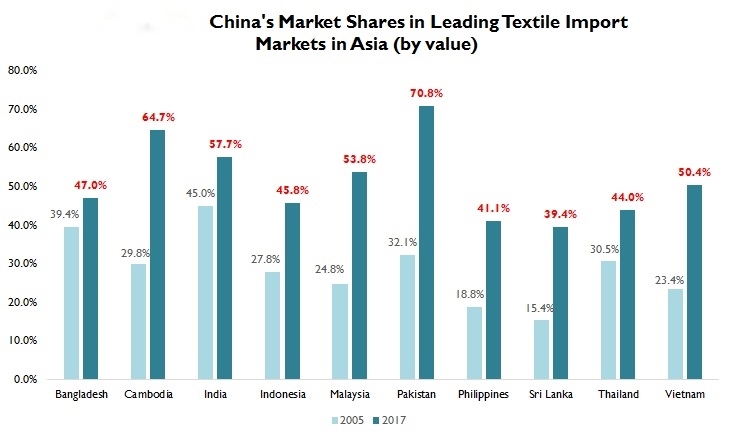
China is exporting less apparel and more textiles to the world. Notably, China’s market shares in world apparel exports fell from its peak of 38.8% in 2014 to a record low of 30.8% in 2019 (was 31.3% in 2018). Meanwhile, China accounted for 39.2% of world textile exports in 2019, which was a new record high. It is important to recognize that China is playing an increasingly critical role as a textile supplier for many apparel-exporting countries in Asia.
On the other hand, even though apparel exports from Vietnam (up 7.7%) and Bangladesh (up 2.1%) enjoyed fast growth in absolute terms in 2019, their gains in market shares were quite limited (i.e., no change for Vietnam and marginally up 0.3 percentage point from 6.8% to 6.5% for Bangladesh). This result indicates that due to capacity limits, no single country has yet emerged to become the “Next China.” Instead, China’s lost market shares in apparel exports were fulfilled by a group of Asian countries altogether.
Fourth, associated with the shifting pattern of world apparel production, the world textile import is increasingly driven by apparel-exporting countries in the developing world. Notably, 2019 marks the first time that Vietnam emerged to become one of the world’s top three largest importers of textiles, primarily due to its expanded apparel production and heavy dependence on imported textile raw materials. In comparison, although the US and the EU remain the world’s top two largest textile importers, their total market shares had declined from nearly 40% in 2010 to only 31.2% in 2019, the lowest in the past ten years. Furthermore, both the US and the EU have been importing more finished textile products (such as home furnishings and carpets) as well as highly specialized technical textiles, rather than conventional yarns and fabrics for apparel production purposes. The weakening import demand for intermediary textile raw materials also suggests that reshoring (i.e., making apparel locally rather than sourcing from overseas) has NOT become a mainstream industry practice in the developed economies like the US and the EU.
Fifth, the world apparel import market is becoming ever more diversified as import demand is increasingly coming from emerging economies with a booming middle class. Affected by consumers’ purchasing power (often measured by GDP per capita) and size of the population, the European Union (EU28), US, and Japan remained the world’s top three importers of apparel in 2019. This pattern has lasted for decades. Altogether, these top three absorbed 58.1% of world apparel in 2019, which, however, was a new historic low (was 84% back in 2005). Behind the numbers, it is not the case that consumers in the EU, US, and Japan are necessarily purchasing less clothing. Instead, several emerging economies are becoming fast-growing apparel consumption markets and starting to import more. For example, China’s apparel imports totaled $8.9bn in 2019, up 8.1% from a year earlier. From 2010 to 2019, China’s apparel imports enjoyed a nearly 15% annual growth, compared with only 1.9% of the traditional top three.
by Sheng Lu
Additional reading: Lu, S. (2020). Five ways world textile and apparel trade is changing. Just-Style.
Appendix: