Presenter: Kendall Keough (MS 2020, Fashion and Apparel Studies)
Textiles and apparel “Made in the USA” are gaining growing attention in recent years amid the escalating U.S.-China trade war, the rising cost of imports, and consumers’ increasing demand for “speed to market.” Statistics show that the value of U.S. textile and apparel (T&A) production totaled $US28.1bn in 2018, which was a record high since 2010. Meanwhile, different from the old days, more and more T&A “Made in the USA” are sold overseas today. According to the Office of Textiles and Apparel (OTEXA) under the U.S. Department of Commerce, the value of U.S. T&A exports reached US$22.9bn in 2019, up nearly 20% from ten years ago.
Despite the strong performance in production and export, however, U.S. T&A manufacturers do not seem to be “visible” enough. Given the information gap, we recently analyzed the 122 U.S. T&A manufacturers included in the OTEXA “Made in the USA” database. Information in the database is self-reported by companies and then verified by OTEXA. Our analysis intends to gain more insights into the state of U.S. T&A mills, including their demographics, production and supply chain strategies, as well as their export behaviors.
Key findings:
First, U.S. T&A manufacturers display a relatively high concentration of geographic locations. Notably, as much as 61% of self-reported yarn manufacturers are from North Carolina (NC), followed by South Carolina (SC), which accounts for another 11%. The concentration of yarn manufacturing in the south, in particular, can be attributed to the abundant cotton supply in that region. Meanwhile, California (CA) has one of the most complete T&A supply chains in the country, with the presence of manufacturers across all T&A sub-sectors.
Second, large-size textile mills are gradually emerging in the United States, whereas U.S. apparel manufacturers are predominantly small and medium-sized. U.S. textile mills, in general, have a high concentration of factories with over 100 employees, particularly those engaged in producing yarns (53%), fabrics (37%), and technical textiles (38%). In the past decade, many relatively small-sized U.S. textile mills had merged into larger ones to take advantage of the economies of scale and reduce production cost. In comparison, over half of the apparel mills in the OTEXA database reported having less than 50 employees. Notably, because of the significant disadvantage in labor cost, U.S. apparel mills are not trying to replace imports, but instead focusing on their “niche market.” For example, designer-based micro-factories are popular these days in U.S. fashion centers such as New York City and California. These factories typically provide customized services, ranging from proto-typing to sample production.
Third, “fabric + apparel” and “fabric + technical textiles” are the two most popular types of vertical integration among U.S. T&A mills. A relatively small proportion of T&A mills included in the OTEXA database had adopted the vertical integration business strategy. Notably, fabric mills seem to be most actively engaged in the vertical integration strategy–around one-third of them reported also making apparel, technical textiles, or home textiles. Additionally, 20% of technical textile manufacturers in the OTEXA database have incorporated an apparel component to their product portfolio. This is a significant trend to watch as more and more sportswear brands are developing technology-driven functional apparel. However, we find few U.S. T&A mills have created a vertical integration model that covers three or more different nature of products.
Fourth, U.S. T&A mills have shifted from only making products to also offering various value-added services. Notably, the majority of companies included in the OTEXA “Made in the USA” database reported having the in-house design capability, including apparel mills (86%), fabric mills (80%), yarn manufacturers (61%), home textiles manufacturers (71%) as well as those making technical textiles (91%). U.S. T&A mills also commonly describe themselves as “innovators” and “solutions providers” on their websites to highlight that the nature of their core business is to serve customers’ needs rather than just “making” physical products.
Fifth, exporting has become an important economic activity of U.S. T&A manufacturers today. Notably, of all the 122 U.S. T&A manufacturers in the OTEXA “Made in the USA” database, as many as 70.5% reported engaged in export, a trend which echoes the rising value of U.S. textile and apparel exports in recent years. Regarding the particular export behaviors of U.S. T&A mills, several patterns are interesting to note:
- U.S. textile mills (76%) are more actively engaged in export than those that make apparel products only (37%).
- Larger U.S. T&A mills overall had a higher percentage engaged in export than those manufacturers smaller in size.
- The Western Hemisphere is the dominant export market for U.S. yarn, fabric, and home textile mills, whereas the export markets for U.S. apparel mills and technical textile producers are relatively more diverse.
- Except for apparel producers, the export diversification strategy is commonly adopted by U.S. T&A mills. As many as 77% of yarn manufacturers included in the OTEXA database reported exporting to three or more different markets in the world. Likewise, around 40% of the fabric, home textiles, and technical textiles mills did the same.
- Free trade agreements support U.S. T&A exports. A high percentage of U.S. T&A mills that reported exporting to the Western Hemisphere said they took advantage of NAFTA and CAFTA-DR, two primary U.S. free trade agreements with the region. The utilization of NAFTA and CAFTA-DR is particularly high among U.S. yarn producers (83.3%).
Sixth, imports support textile and apparel “Made in the USA”. Using imported inputs such as cut parts, fabrics, accessories and trims is a very common practice among U.S. textile and apparel manufacturers. Notably, more than 76% of companies which make apparel in the United States say they use imported inputs, followed by companies which make technical textiles (52%) and fabrics (46%). Moreover, the lack of sufficient supply of locally made fabrics is the top reason why U.S. textile and apparel companies use imports as alternatives.
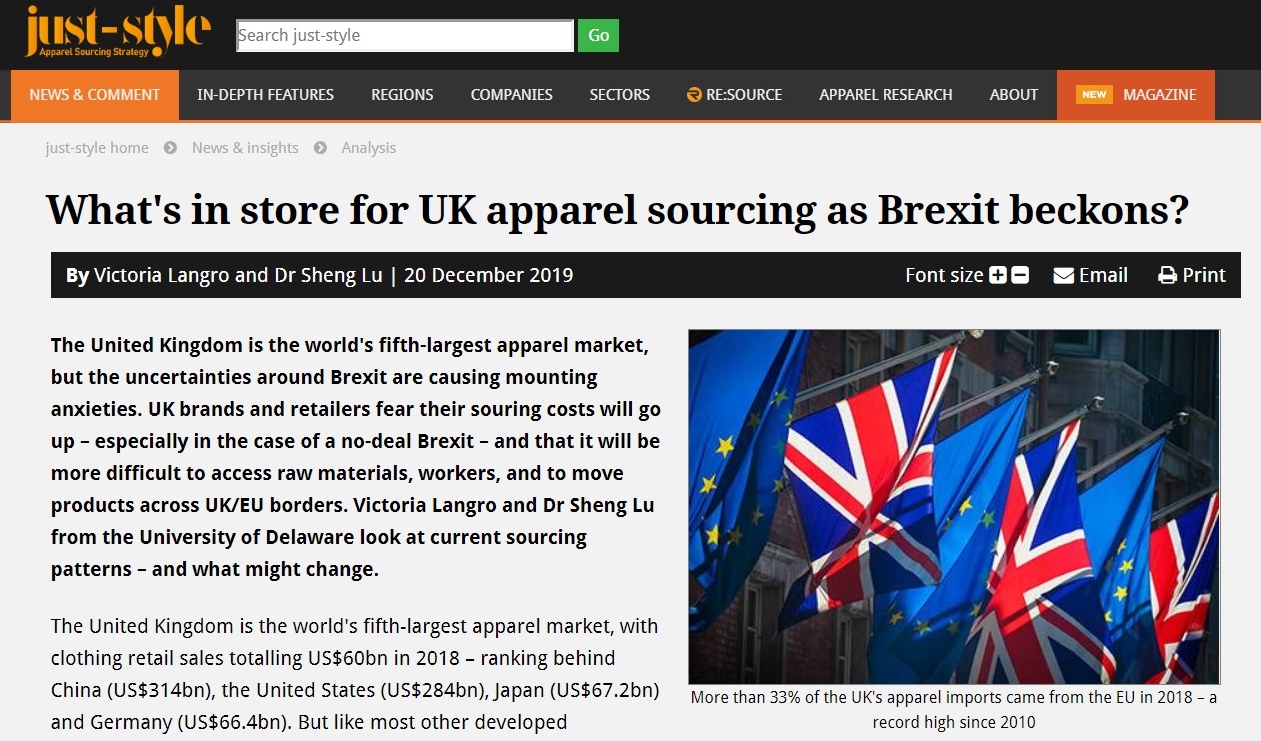
Additional reading: Kendall Keough and Sheng Lu. (2020). ‘Made in the USA’ textiles and apparel – Key production and export trends. Just-Style.